WHY GBPUSD BULLISH ???GBPUSD is unfolding exactly as anticipated, with price now hovering around the 1.3740 region and maintaining strong bullish momentum. Price has successfully bounced from the key support zone near 1.3430, which was previously a major resistance turned into solid demand. This level held firmly during multiple retests, confirming a clean breakout-retest continuation pattern. As long as this structure remains intact, I continue to hold a bullish bias targeting 1.4000 in the coming sessions.
From a fundamental perspective, the British Pound is gaining strength on the back of improved UK economic sentiment. The latest UK inflation data surprised to the upside, pushing annual CPI back above 3%, which reinforces expectations that the Bank of England may need to act sooner rather than later on rate hikes. Markets are now pricing in higher probability of a rate adjustment before the end of Q3 2025. Meanwhile, the US Dollar is under moderate pressure as recent soft labor data and downward revisions in consumer confidence readings have dampened expectations for further tightening from the Fed.
Technically, GBPUSD has cleared major Fibonacci resistance levels and is now forming higher highs and higher lows across the higher timeframes. The current bullish wave is fueled by clean institutional demand and strong price action momentum. If the pair can sustain above 1.3650–1.3680, a swift move toward the psychological 1.4000 handle is highly probable. The 1.4218 Fibonacci extension aligns as a longer-term secondary target for swing traders holding this bullish continuation.
This setup offers a solid blend of macroeconomic backing and technical structure. GBPUSD remains one of the top trending forex pairs right now, favored by strong price action, central bank divergence, and global capital rotation. I'm closely monitoring for intraday pullbacks to add long positions, aiming for extended upside as the market follows through on this bullish breakout continuation.
USDGBP trade ideas
GBPUSD INTRADAY sideways consolidation breakoutThe GBPUSD currency pair continues to exhibit a bullish price action bias, supported by a sustained rising trend. Recent intraday movement reflects a sideways consolidation breakout, suggesting potential continuation of the broader uptrend.
Key Technical Level: 1.3600
This level marks the prior consolidation range and now acts as pivotal support. A corrective pullback toward 1.3600 followed by a bullish rejection would reinforce the bullish trend, targeting the next resistance levels at:
1.3825 – Near-term resistance
1.3865 – Minor swing high
1.3900 – Longer-term bullish objective
On the other hand, a decisive daily close below 1.3600 would invalidate the bullish setup, shifting the outlook to bearish in the short term. This could trigger a deeper retracement toward:
1.3550 – Initial support
1.3500 – Key downside target
Conclusion:
As long as 1.3600 holds as support, the technical outlook remains bullish, favoring long positions on dips. A confirmed break below this level would signal a shift in sentiment and open the door to a corrective pullback phase.
This communication is for informational purposes only and should not be viewed as any form of recommendation as to a particular course of action or as investment advice. It is not intended as an offer or solicitation for the purchase or sale of any financial instrument or as an official confirmation of any transaction. Opinions, estimates and assumptions expressed herein are made as of the date of this communication and are subject to change without notice. This communication has been prepared based upon information, including market prices, data and other information, believed to be reliable; however, Trade Nation does not warrant its completeness or accuracy. All market prices and market data contained in or attached to this communication are indicative and subject to change without notice.

GBPUSD SHORT GBP/USD looks overextended and rejecting the 1.3750 level. At the same time, DXY is bouncing from the 97.00 support. This could suggest a possible pullback in GBP/USD.

GBPUSD Hits Channel Highs – Watch for Exhaustion or BreakoutGBPUSD continues its impressive rally, tapping into the upper boundary of a clean ascending channel across the 1D and 4H timeframes.
🔹 Daily:
Structure remains bullish with price pressing into long-term channel resistance near 1.3765. This is a key inflection point — bulls may need fresh momentum to break above.
🔹 4H:
Sharp impulsive move has stretched to the upside channel line. RSI likely overextended. Look for signs of exhaustion or bearish divergence here.
🔹 1H / 23m:
Lower timeframes show aggressive bullish control, but price is stalling near the highs. If we break structure or reject this zone, we could see a correction toward 1.3660 or deeper.
📉 If rejection occurs here, short opportunities may present toward mid-range or trendline support.
📈 If we break and close above 1.3780 with volume, continuation toward 1.3850 becomes likely.
💡Key Levels:
• Resistance: 1.3780, 1.3850
• Support: 1.3660, 1.3600

What Is a Change of Character (CHoCH) and How Can You Trade It?What Is a Change of Character (CHoCH) and How Can You Trade It?
Navigating the nuances of Smart Money Concept (SMC) trading requires a keen understanding of market signals like the Change of Character (CHoCH). This concept can help traders detect and react to potential trend reversals. Today, we’ll delve into the mechanics of CHoCHs, explaining how they manifest in different market conditions and how they can be strategically leveraged for trading decisions.
Understanding Breaks of Structure
Understanding Breaks of Structure (BOS) is essential for traders before delving into concepts like Change of Character (CHoCH). A BOS in trading signifies a continuation within the current trend and is marked by a clear deviation from established swing points that indicate previous highs and lows.
In the context of an uptrend, a BOS is identified when the price exceeds a previous high without moving below the most recent higher low. This action confirms that the upward momentum is still strong and likely to continue as buyers push the market to new heights.
Similarly, in a downtrend, a BOS occurs when prices drop below a previous low without breaking the prior lower high, suggesting that sellers remain in control and the downward trend is set to persist.
By recognising these points where the market extends beyond its former bounds, traders can confirm that the current trend is robust and act accordingly. This foundational concept of BOS not only helps in assessing trend strength but also sets the stage for understanding more complex patterns like CHoCH, where the focus shifts from trend continuation to potential trend reversals.
CHoCH Trading Meaning
In trading, a Change of Character (CHoCH) signals a potential shift in market dynamics, often indicating a reversal from the prevailing trend. This concept is particularly valuable as it helps traders discern when the momentum is shifting, offering a strategic point to consider adjusting their positions.
A CHoCH occurs when there's a noticeable deviation in the market's price trend. For example, in a bullish trend characterised by a series of higher highs and higher lows, a CHoCH is indicated by the price failing to set a new high and subsequently falling below a recent higher low. This suggests that buyers are losing control, and a bearish trend could be emerging.
Similarly, during a bearish trend marked by lower highs and lower lows, a bullish CHoCH would occur if the price unexpectedly breaks above a recent lower high. This break indicates that sellers are losing their grip, and a bullish trend may be starting.
The Significance of CHoCHs Across Timeframes
The fractal nature of financial markets means that patterns and behaviours recur across various timeframes, each providing unique insights and implications for trading. Understanding CHoCHs in different timeframes is crucial for traders to effectively align their strategies with both short-term opportunities and long-term trend shifts.
In intraday trading, where decisions are made on lower timeframes (like minutes or hours), a CHoCH can signal a possible short-term trend reversal. For example, if a currency pair in a downtrend on a 15-minute chart suddenly posts a higher high, this could indicate a weakening of the bearish momentum, suggesting a potential bullish reversal.
Traders might use this information to close short positions or to consider a long position, capitalising on the emerging upward trend. These short-term CHoCHs allow traders to respond quickly to market changes, potentially securing returns before larger market shifts occur.
Conversely, CHoCHs observed on higher timeframes, such as daily or weekly charts, are particularly significant because they can indicate a shift in the broader market trend that might last days, weeks, or even months. Such changes can then be used by both long and short-term traders to adjust their positioning and directional bias.
How to Identify a CHoCH
The initial step to identify a CHoCH in trading involves clearly defining the existing trend on a specific timeframe. This is done by marking the significant swing highs and lows that delineate the trend's progress. These points should represent somewhat meaningful retracements in the price, providing clear markers of trend continuity or potential reversal points.
According to the Smart Money Concept (SMC) theory, the integrity of an uptrend is maintained as long as the price does not trade through the most recent significant higher low. Conversely, a downtrend is considered intact if the price does not surpass the most recent significant lower high. Therefore, traders focus their attention on these critical points.
To identify a CHoCH, traders watch for a break in these crucial high or low points. For instance, in an uptrend, a bearish CHoCH is indicated when the price achieves a higher high but then reverses to descend below the previous significant higher low.
Similarly, in a downtrend, a bullish CHoCH occurs when the price drops to a lower low before reversing to break above the previous significant lower high, setting a new high. Both types of breaks signal a potential reversal in the trend direction.
How to Trade a CHoCH
When trading a CHoCH, it’s essential to recognise that it should be integrated with other aspects of the SMC framework to get the best results. This includes the use of order blocks and imbalances, which are key components in identifying potential reversals.
Order Blocks and Imbalances
An order block is essentially a substantial consolidation area where significant buying or selling has occurred, and prices often revisit these zones before reversing. These blocks can be seen as levels where institutional orders were previously concentrated.
An imbalance, also known as a fair value gap, occurs when the price moves sharply up or down, leaving a zone that has not been traded extensively. Price often returns to these gaps to 'fill' them, establishing equilibrium before a potential reversal happens.
In practice, traders can look for a sequence where the price first approaches an order block and begins to fill any existing imbalances. This setup increases confidence in a potential reversal. As the price meets these criteria and a CHoCH occurs, this indicates that the influence of the order block is likely to initiate a price reversal.
Practical Example on GBP/USD
Consider the 4-hour chart of the GBP/USD pair above. We see the pair encounter an order block on the left, one that’s visible on the daily chart. As the price interacts with this block, it begins to retrace, attempting to fill the imbalance but moves away. Eventually, the price completes the fill of the imbalance and meets the previously established order block.
Switching to a 1-hour timeframe, this scenario unfolds similarly. After reaching the order block on the 4-hour chart, another CHoCH occurs, signalling the start of a new uptrend. This lower timeframe CHoCH, following the meeting of the order block, corroborates the potential for a reversal initiated by the higher timeframe dynamics.
This example illustrates how CHoCHs can be effectively utilised across different timeframes, tying back to the fractal nature of markets discussed earlier. By recognising these patterns and understanding their interaction with order blocks and imbalances, traders can strategically position themselves to capitalise on potential market reversals, aligning their trades with deeper market forces at play.
CHoCH vs Market Structure Shift
A Market Structure Shift (MSS) is a specific type of Change of Character that includes additional signals suggesting a potential trend reversal. Unlike a straightforward CHoCH that typically indicates a trend is shifting but may also be a false break, an MSS can be seen as a higher confluence CHoCH. An MSS occurs after the market first makes a key movement contrary to the established trend—forming a lower high in an uptrend or a higher low in a downtrend—without plotting a higher high or lower low.
Following these preliminary signals, an MSS is confirmed when there is a decisive break through a significant swing point accompanied by a strong displacement (i.e. impulse) move, creating a CHoCH in the process. This sequence not only reflects that the prevailing trend has paused but also that a new trend in the opposite direction is establishing itself.
Due to these additional confirmations, an MSS can offer added confirmation for traders, indicating a stronger likelihood that a new, sustainable trend has begun. This makes the MSS particularly valuable for traders looking for more substantiated signals in their trading strategy.
The Bottom Line
The concept of a CHoCH is instrumental in navigating the complexities of SMC trading. By identifying these crucial market signals, traders may align their strategies to capitalise on market movements efficiently.
FAQs
What Is CHoCH in Trading?
In trading, CHoCH is a technical observation that signifies a change in the trend's character, where the price movement breaks from its established pattern of highs and lows, suggesting a potential reversal or substantial shift in the market's direction.
What Is CHoCH in SMC Trading?
In Smart Money Concept (SMC) trading, a Change of Character (CHoCH) refers to a clear shift in market behaviour that indicates a potential reversal of the prevailing trend. This concept is used by traders to detect early signs of a momentum shift that might lead to significant changes in price direction, enabling strategic adjustments to their trading positions.
What Is a CHoCH in the Market Structure?
A CHoCH in market structure is identified when there is an observable deviation from established price patterns — specifically when new highs or lows contradict the current trend. It signifies that the previous market sentiment is weakening, and a new opposite trend may be starting, prompting traders to reassess their strategies.
How Do You Identify a CHoCH?
Identifying a CHoCH involves monitoring significant swing highs and lows for breaks that are contrary to the existing trend. For instance, in an uptrend, a CHoCH would be indicated by a failure to reach a new high followed by a drop below the recent higher low, suggesting a shift to a bearish outlook.
What Is ChoCH vs BOS in Trading?
While both CHoCH and Break of Structure (BOS) are critical in assessing market dynamics, they serve different purposes. CHoCH indicates a potential trend reversal by highlighting a significant change in the price pattern. In contrast, a BOS indicates a continuation of the current trend by showing the price surpassing previous significant highs or lows, reinforcing the ongoing direction.
This article represents the opinion of the Companies operating under the FXOpen brand only. It is not to be construed as an offer, solicitation, or recommendation with respect to products and services provided by the Companies operating under the FXOpen brand, nor is it to be considered financial advice.

The Day Ahead Economic Data Highlights (US & Europe):
A busy day for economic indicators, particularly out of the US.
Durable Goods Orders (May): Markets will watch for signs of resilience or weakness in US manufacturing, with core capital goods orders acting as a proxy for business investment.
Chicago Fed National Activity Index: Could offer a broader snapshot of US economic momentum ahead of the July FOMC.
Pending Home Sales: Will shed light on housing market trends amid fluctuating mortgage rates.
Advance Goods Trade Balance & Wholesale Inventories: These will feed into Q2 GDP tracking estimates.
Kansas City Fed Manufacturing Activity (June): Regional data may add color to the broader ISM picture.
Initial Jobless Claims: As always, a key gauge of labor market tightness.
Germany GfK Consumer Confidence (July): Expected to reflect persistent economic pessimism, weighing on EUR sentiment.
Central Bank Speakers:
A full slate of Fed, ECB, and BoE commentary may offer insight into diverging policy paths.
Fed’s Barkin, Hammack, and Barr could provide updates on inflation dynamics and balance sheet strategy.
ECB’s Schnabel and Guindos may hint at the pace of further policy easing amid eurozone stagnation.
BoE’s Governor Bailey and Deputy Governor Breeden speak following recent UK inflation and growth data, with focus on the rate outlook into Q3.
Corporate Earnings:
Nike (NKE): Focus will be on forward guidance and China recovery amid margin pressure and inventory management.
H&M: May offer cues on European consumer demand and retail sector performance.
Other Key Events:
European Council Summit (Brussels, through June 27): Leaders gather to discuss key policy areas including fiscal rules, Ukraine aid, and EU top jobs. Potential EUR sensitivity depending on political developments.
US 7-Year Note Auction: Watch for demand and yield levels, as Treasury issuance remains in focus amid deficit concerns.
This communication is for informational purposes only and should not be viewed as any form of recommendation as to a particular course of action or as investment advice. It is not intended as an offer or solicitation for the purchase or sale of any financial instrument or as an official confirmation of any transaction. Opinions, estimates and assumptions expressed herein are made as of the date of this communication and are subject to change without notice. This communication has been prepared based upon information, including market prices, data and other information, believed to be reliable; however, Trade Nation does not warrant its completeness or accuracy. All market prices and market data contained in or attached to this communication are indicative and subject to change without notice.

GU-Thu-26/06/25 TDA-GU rallying higher in NY-Asian session!Analysis done directly on the chart
Follow for more, possible live trades update!
I often share my live trades in Tradingview public chat in London session, stay tuned!
Losses are part of the game. We are risk takers,
we take losses but it's important to know how to
manage them properly. Not every day, every session
is good to trade. Being a good trader means valuing
more risk management over profits.
Active in London session!
Not financial advice, DYOR.
Market Flow Strategy
Mister Y

Could the price reverse from here?The Cable (GBP?USD) is reacting off the pivot and could reverse to the 1st support which acts as a pullback support.
Pivot: 1.3710
1st Support: 1.3620
1st Resistance: 1.3799
Risk Warning:
Trading Forex and CFDs carries a high level of risk to your capital and you should only trade with money you can afford to lose. Trading Forex and CFDs may not be suitable for all investors, so please ensure that you fully understand the risks involved and seek independent advice if necessary.
Disclaimer:
The above opinions given constitute general market commentary, and do not constitute the opinion or advice of IC Markets or any form of personal or investment advice.
Any opinions, news, research, analyses, prices, other information, or links to third-party sites contained on this website are provided on an "as-is" basis, are intended only to be informative, is not an advice nor a recommendation, nor research, or a record of our trading prices, or an offer of, or solicitation for a transaction in any financial instrument and thus should not be treated as such. The information provided does not involve any specific investment objectives, financial situation and needs of any specific person who may receive it. Please be aware, that past performance is not a reliable indicator of future performance and/or results. Past Performance or Forward-looking scenarios based upon the reasonable beliefs of the third-party provider are not a guarantee of future performance. Actual results may differ materially from those anticipated in forward-looking or past performance statements. IC Markets makes no representation or warranty and assumes no liability as to the accuracy or completeness of the information provided, nor any loss arising from any investment based on a recommendation, forecast or any information supplied by any third-party.

GBPUSD.UK 10-Year Gilt Yield and Interest Rate
UK 10-Year Gilt Yield: The yield stands at 4.48% as of June 25, 2025, after touching a recent high of 4.73%. This elevated yield reflects persistent inflation and cautious market expectations for Bank of England policy.
Bank of England Interest Rate: The current policy rate is 4.25%. Markets expect potential cuts in August and November, possibly bringing the rate to 3.75% by year-end, but the BoE remains cautious due to inflation still above target.
The US dollar is at multi-year lows, pressured by political uncertainty around the Fed, rising expectations for rate cuts, and a broad shift in global risk sentiment away from the dollar
Investors remain cautious due to fiscal policy worries, including the impact of US government spending and debt levels, as well as geopolitical risks.
The market currently prices in two 25-basis-point Federal Reserve rate cuts by the end of 2025, likely in September and December, which influences bond yields.
The 10-year yield is a key benchmark for mortgage rates, corporate borrowing costs, and is often considered the "risk-free rate" in financial valuations
The US10Y stands at 4.29%-4.33%
and interest rate remains 4.25-4.5%
The 10-year yield remains a critical indicator of US economic health, inflation expectations, and monetary policy stance.
#GBPUSD

GBPUSD InsightHello to all subscribers.
Please feel free to share your personal opinions in the comments. Don’t forget to hit the booster and subscribe.
Key Points
- NATO’s 32 member countries have agreed to increase defense spending to 5% of GDP by 2035, as requested by U.S. President Trump.
- Federal Reserve Chair Jerome Powell, speaking before the Senate, stated that the Fed is "in a position to wait" and noted it is difficult to predict how tariffs will impact inflation.
- The Fed has decided to ease the Supplementary Leverage Ratio (SLR) regulation that applied to major banks. With the regulatory easing, large banks are expected to increase their purchases of U.S. Treasuries, which could lead to lower bond yields.
Key Economic Events This Week
+ June 26: U.S. Q1 GDP
+ June 27: U.S. May Personal Consumption Expenditures (PCE) Price Index
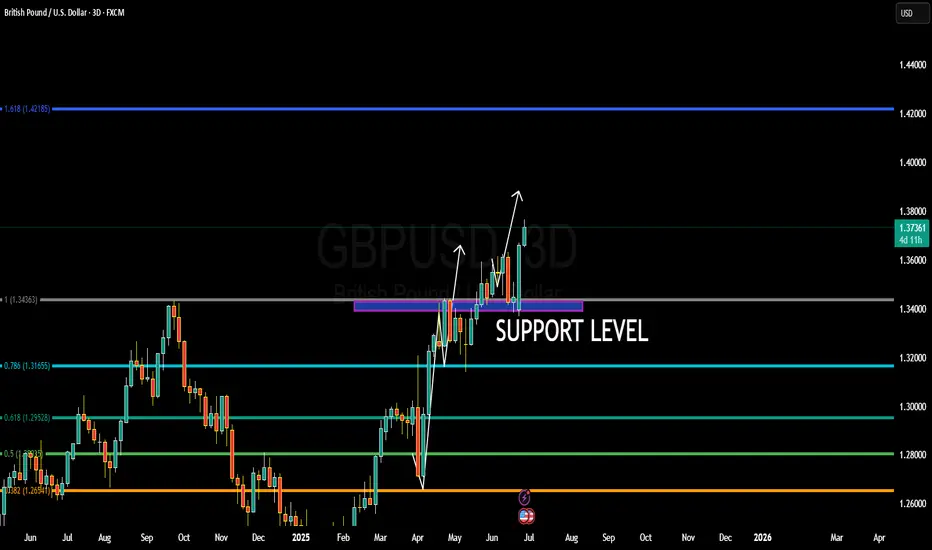
GBPUSD Chart Analysis
Although the pair pulled back after encountering resistance from the trendline, it successfully rebounded from the 1.34000 level and climbed to 1.37000. After breaking through the resistance this time, it is now likely to rise toward the upper trendline. The projected high is expected to be around the 1.40000 level.

GBP_USD WILL KEEP GROWING|LONG|
✅GBP_USD broke the key structure level of 1.3620
While trading in an local uptrend
Which makes me bullish biased
And I think that after the retest of the broken level is complete
A rebound and bullish continuation will follow
LONG🚀
✅Like and subscribe to never miss a new idea!✅
Disclosure: I am part of Trade Nation's Influencer program and receive a monthly fee for using their TradingView charts in my analysis.

GBPUSD Wave Analysis – 25 June 2025- GBPUSD broke resistance level 1.3590
- Likely to rise to resistance level 1.3880
GBPUSD currency pair recently broke the resistance level 1.3590, which is the upper border of the narrow sideways price range inside which the price has been moving from May.
The breakout of the resistance level 1.3590 accelerated the active intermediate impulse wave (3).
Given the clear daily uptrend and the strong US dollar sales seen today, GBPUSD currency pair can be expected to rise to the next resistance level 1.3880.

GBPUSD GBPUSD is currently exhibiting short-term bearish momentum, targeting the fresh demand zone at 1.36416.
This level aligns with a key order block that could act as a pivot for the next bullish leg.
As long as price holds above this zone, we anticipate a potential bullish reversal from 1.36416 on the 15-minute timeframe. We’ll be monitoring for confirmation and continuation to the upside from that level.

GBPUSD | 24.06.2025SELL 1.35900 | STOP 1.36500 | TAKE 1.35000 | Price movement in the range of the medium-term ascending channel.

GBPUSD For A Long BuyDerived from the somewhat correlated nature of the EURUSD to the GBPUSD
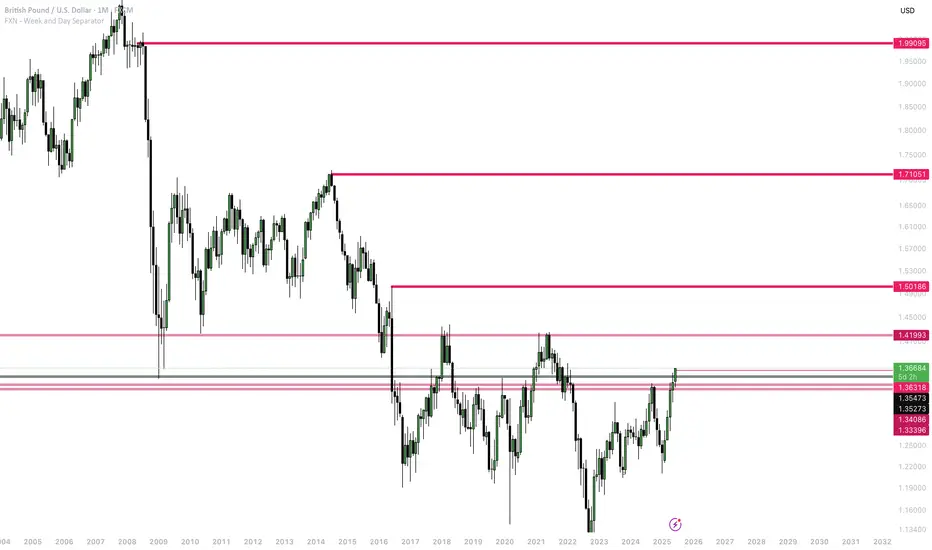
Current level of resistance is 1.41993 (current buying objective)
Previous resistance 1.36318, now support. Price aiming for 1.41993.
Mid-term resistance level: 1.50186
Long-term resistance levels are 1.71051 and 1.99095
Mid-term and long-term levels will hold provided price breaks through the 1.41993 level, and the bullish bias remains the same.
GBP/USD Launch to Fresh 3-Year HighsGBP/USD had a mild pullback earlier in the morning until the 1.3593 level came in to help set the lows. I had looked at that price in yesterday's post and that's held the lows for today ahead of another strong breakout with the pair pressing into fresh three-year highs.
Chasing breakouts can be tough especially when they've already started, so at this point there's a couple of spots of support that bulls can defend to keep the door open for shorter-term trend continuation purposes.
The price of 1.3639 is an aggressive level of support potential, and below that is 1.3616. If bulls fail to hold support at those prices, the bullish momentum that's driving the current breakout would come into question and the door would open to deeper retracement potential. In that scenario, there may be more attractive options to work with USD-strength. - js

Short trade
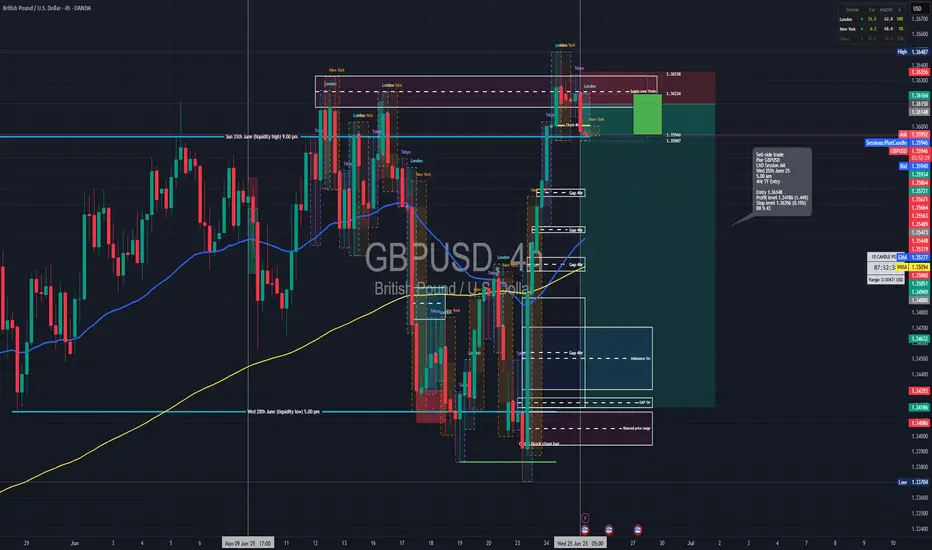
🔻 Trade Journal Entry – Sell-side Trade
📍 Pair: GBPUSD
📅 Date: Wednesday, June 25, 2025
🕒 Time: 5:00 AM (London Session AM)
⏱ Time Frame: 4 Hour
📉 Direction: Sell-side
📊 Trade Breakdown:
Metric Value
Entry Price 1.36148
Profit Level 1.34186 (−1.44%)
Stop Loss 1.36356 (+0.15%)
Risk-Reward
Ratio 9.43 : 1
🧠 Context / Trade Notes:
4HR OB Rejection in Premium Zone:
Entry taken off a confirmed bearish order block after price tapped into a premium zone at the top of the internal range.
London Session Liquidity Sweep:
Trade captured the classic London stop-hunt above a short-term high, initiating a sell-off and confirming smart money movement.
Sell GBPUSDGBPUSD looking to go short from the resistance. This resistance has proven a strong barrier for price as observed. Sells here with the stop loss just hovering above 1,365

Waiting for Pullback at Green Support GBP/USD Forex Update – Waiting for Pullback at Green Support 📈
GBP/USD is currently in an uptrend. One option is to wait for a pullback to the green support zone level, where buyers could step in and push the price back up again. 📊

High-Reward GBPUSD Setup: Entry 1.3598, TP 1.3867, SL 1.3478The GBP/USD pair has recently shown a clean bullish breakout from a short-term consolidation zone. Price has decisively moved above the 1.3478–1.3480 support-turned-resistance level, which previously acted as a ceiling within a rising channel. This breakout is meaningful—it comes after a retracement toward the lower boundary of the ascending structure, suggesting that buyers are once again gaining control.
The recent bullish candle has closed strong and full-bodied, indicating momentum. Historically, as you mentioned, GBPUSD tends to follow through for a few sessions once a bullish breakout begins. This is visible in prior moves throughout March and April, where an initial spike was often followed by two or three additional bullish candles. That behavior adds confluence to this setup.
Moreover, there is a clear path for price to move toward the long-term resistance near 1.3867, which aligns well with prior supply zones and the upper boundary of historical price reactions.
📈 Trade Idea
• Entry: 1.3598 (current price after breakout confirmation)
• Stop Loss: 1.3478 (just below the support flip and last swing low)
• Take Profit: 1.3867 (next major resistance level)
• Risk–Reward Ratio: ~2.24:1
This setup offers a clean bullish continuation pattern with room to run. If the pair maintains its current momentum, reaching the target in the next few trading days is entirely plausible. Any daily close above 1.3600 with volume would further validate the trend.

GBPUSD I H4 CLS I KL - DOB I Liquidity on TOPHey, Market Warriors, here is another outlook on this instrument
If you’ve been following me, you already know every setup you see is built around a CLS Footprint, a Key Level, Liquidity and a specific execution model.
If you haven't followed me yet, start now.
My trading system is completely mechanical — designed to remove emotions, opinions, and impulsive decisions. No messy diagonal lines. No random drawings. Just clarity, structure, and execution.
🧩 What is CLS?
CLS is real smart money — the combined power of major investment banks and central banks moving over 6.5 trillion dollars a day. Understanding their operations is key to markets.
✅ Understanding the behavior of CLS allows you to position yourself with the giants during the market manipulations — leading to buying lows and selling highs - cleaner entries, clearer exits, and consistent profits.
📍 Model 1
is right after the manipulation of the CLS candle when CIOD occurs, and we are targeting 50% of the CLS range. H4 CLS ranges supported by HTF go straight to the opposing range.
"Adapt what is useful, reject what is useless, and add what is specifically your own."
— David Perk aka Dave FX Hunter ⚔️
👍 Hit like if you find this analysis helpful, and don't hesitate to comment with your opinions, charts or any questions.

GBPUSD LONGS Price is forming higher highs and higher lows on the 15-minute timeframe, while 70% of retail traders remain positioned short

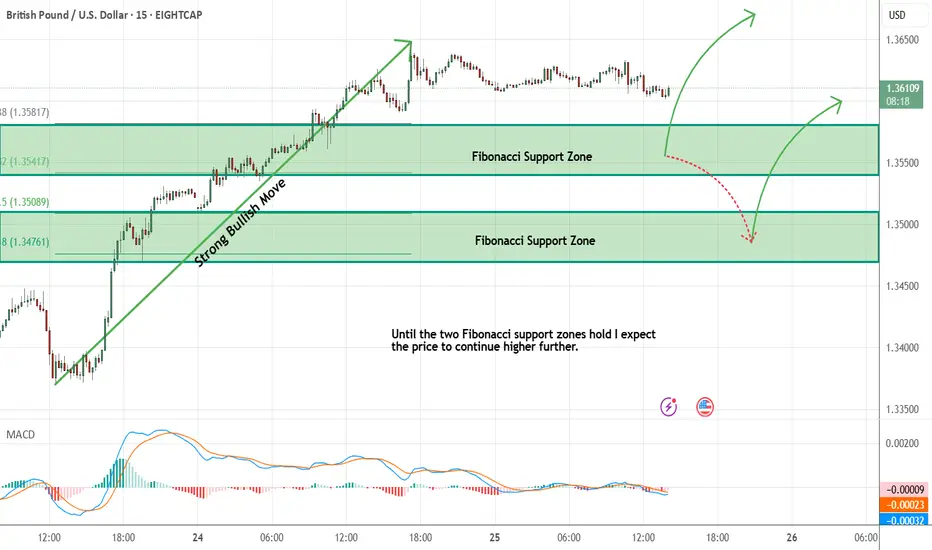
GBPUSD - Expecting Bullish Continuation In The Short TermM15 - Strong bullish momentum followed by a pullback.
No opposite signs.
Until the two Fibonacci support zones hold I expect the price to move higher further.
If you enjoy this idea, don’t forget to LIKE 👍, FOLLOW ✅, SHARE 🙌, and COMMENT ✍! Drop your thoughts and charts below to keep the discussion going. Your support helps keep this content free and reach more people! 🚀
--------------------------------------------------------------------------------------------------------------------