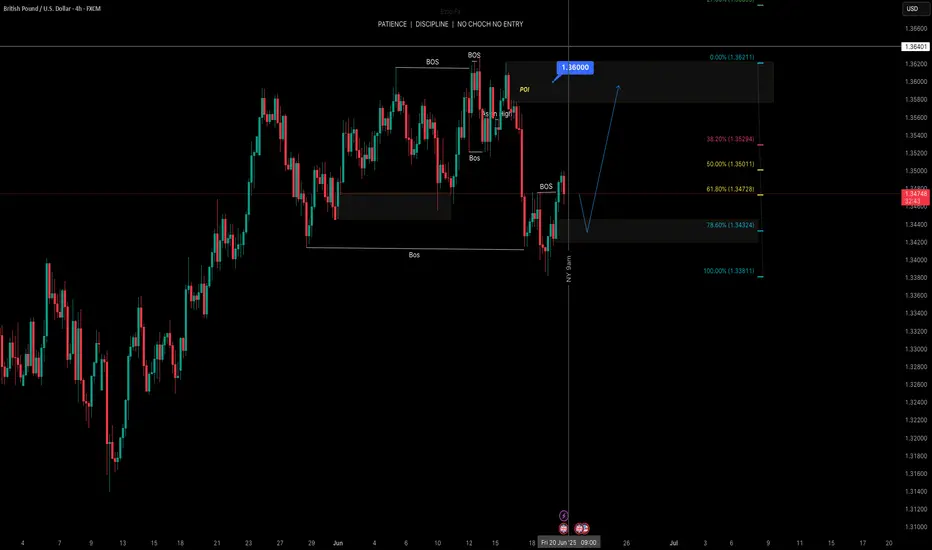
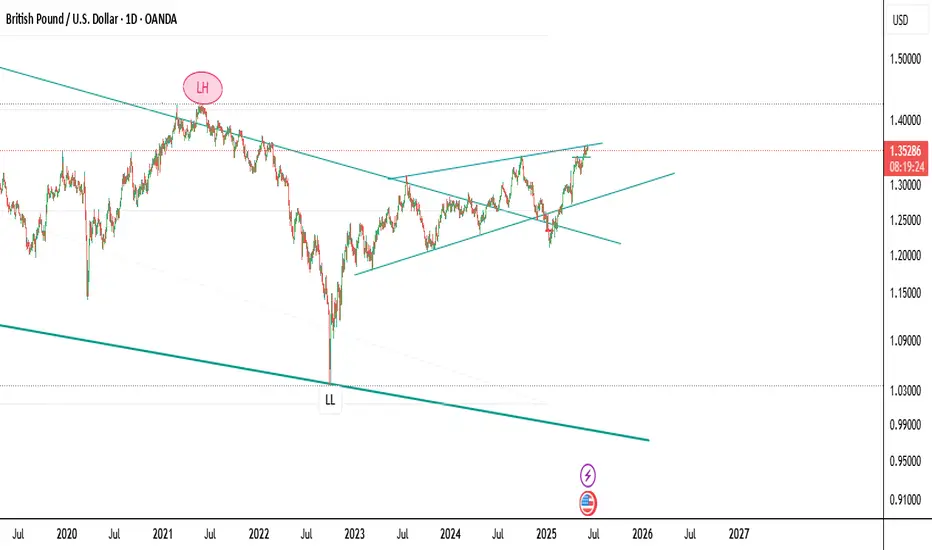
GBPUSD SHORT/SELL 1:3.5Reason for selling:
* Break of structure
* B wave of corrective structure forming
* Expanding flat forming
* MACD divergence
* Liquidity under 1.33860
Strategy to use: FIB retracement on 50/61.8
Engulfing candle to the downside
Entry: 1.35616
Stop Loss: 1.36155
Take Profit: 1.33875
USDGBP trade ideas

Idea on a ChartGBP/USD found a slight rebound to muscle back above 1.3450 on Thursday.
Despite near-term Greenback strength on geopolitical concerns, markets took a break during the midweek US holiday session.
Israel-Iran tensions continue to rise, and the Trump administration is drawing out a decision on getting involved directly.
GBP/USD found some room on the high side on Thursday, climbing back above the 1.3450 level after catching an early technical bounce from the 1.3400 handle. Broad-market flows have favored the US Dollar recently as Middle East tensions continue to rise, but US markets were dark for a national holiday on Thursday, giving Cable some room to breathe and easing off of USD bidding.
BUY CABLEIn todays session we are monitoring GBPUSD for bullish opportunities. Our buy entry is at 1.34120 and stops are below 1.3380 our target is 1.3500. Use proper risk management and best of luck. Cheers
GU-Fri-20/06/25 TDA-DR 1.34921 hit, potential bearish continue!Analysis done directly on the chart
Follow for more, possible live trades update!
I trade from level to level and see how price
reacts to interest zone. I adapt my sl and tp
based on market conditions and as well the
risk per trade but generally 1% max risk or
lower.
Active in London session!
Not financial advice, DYOR.
Market Flow Strategy
Mister Y

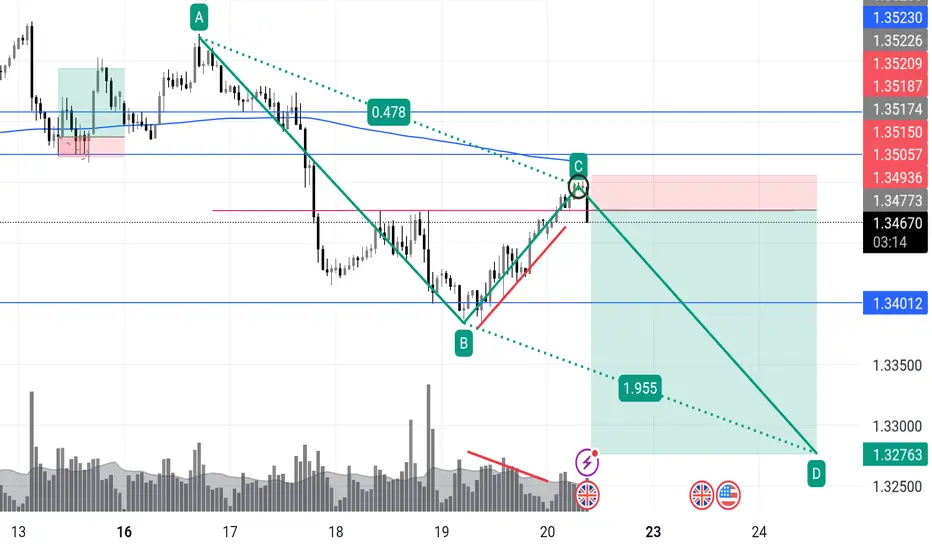
GBPUSD short!Classic Wyckoff upthrust, this is A+
We’ve got a clear AB=CD completion at C, tagging previous support-turned-resistance, while the volume on the climb is drying up (classic clue of passive buyers getting trapped). The channel top + Fibonacci confluence + previous swing zone adds weight.
🔻 Trade Idea:
Entry: 1.3477
Stop: 1.3521 (above wick highs and structure)
Target 1: 1.3401 (break structure)
Target 2: 1.3276 (full measured move / spring's origin)
Risk-Reward: ~3.5R
Volume divergence confirms exhaustion.
Ideal reaction would break through mid-line and sustain under 1.3401.
🔍 Watch For:
Bearish engulfing confirmation on 1h
Volume spike during breakdown = smart money selling
If price lingers above 1.3515, trap invalid
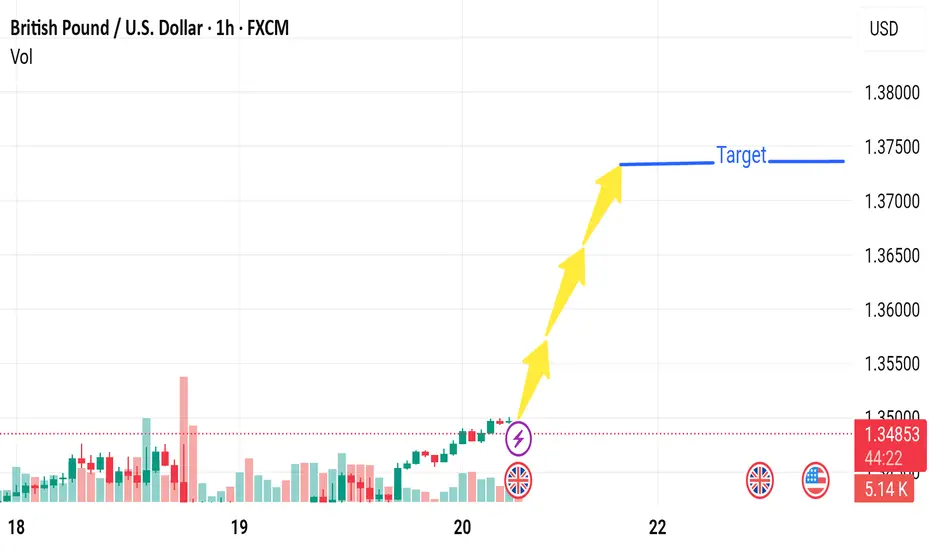
Market next target
🔻 Bearish Disruption Analysis
1. Overbought Conditions / RSI Exhaustion
The recent bullish momentum appears strong, but it could be entering overbought territory, especially on the 1-hour chart.
A correction may follow if technical indicators like RSI or MACD start diverging.
2. Resistance Zone at 1.35000 - 1.35500
The price is nearing a historical resistance area around 1.3500–1.3550, where sellers have previously stepped in.
Without strong volume or a news catalyst, this zone may reject further upside movement.
3. Low Volume Breakout
The breakout visible before the arrows is accompanied by relatively moderate volume, which can indicate a false breakout or bull trap.
4. Fundamental Uncertainty
Upcoming U.S. or UK economic data (indicated by the flags on the chart) could disrupt the expected bullish move.
Example: A strong USD labor report or hawkish Fed comment could reverse the GBP/USD rally.
GBPUSD(20250620)Today's AnalysisMarket news:
The Bank of England kept interest rates unchanged at 4.25%, and the voting ratio showed that internal differences were increasing. Traders expect the bank to cut interest rates by another 50 basis points this year.
Technical analysis:
Today's buying and selling boundaries:
1.3439
Support and resistance levels:
1.3526
1.3494
1.3473
1.3406
1.3385
1.3353
Trading strategy:
If it breaks through 1.3473, consider buying, and the first target price is 1.3494
If it breaks through 1.3439, consider selling, and the first target price is 1.3406

GBPUSD H4 I Bearish Reversal Off the Fib confluence Based on the H4 chart, the price is approaching our sell entry level at 1.3502, a pullback resistance that aligns with the 50% Fib retracement and the 127.2% Fib extension, providing a significant level for a potential bearish reversal.
Our take profit is set at 1.3427, a pullback support.
The stop loss is set at 1.3587, a pullback resistance.
High Risk Investment Warning
Trading Forex/CFDs on margin carries a high level of risk and may not be suitable for all investors. Leverage can work against you.
Stratos Markets Limited (tradu.com ):
CFDs are complex instruments and come with a high risk of losing money rapidly due to leverage. 63% of retail investor accounts lose money when trading CFDs with this provider. You should consider whether you understand how CFDs work and whether you can afford to take the high risk of losing your money.
Stratos Europe Ltd (tradu.com ):
CFDs are complex instruments and come with a high risk of losing money rapidly due to leverage. 63% of retail investor accounts lose money when trading CFDs with this provider. You should consider whether you understand how CFDs work and whether you can afford to take the high risk of losing your money.
Stratos Global LLC (tradu.com ):
Losses can exceed deposits.
Please be advised that the information presented on TradingView is provided to Tradu (‘Company’, ‘we’) by a third-party provider (‘TFA Global Pte Ltd’). Please be reminded that you are solely responsible for the trading decisions on your account. There is a very high degree of risk involved in trading. Any information and/or content is intended entirely for research, educational and informational purposes only and does not constitute investment or consultation advice or investment strategy. The information is not tailored to the investment needs of any specific person and therefore does not involve a consideration of any of the investment objectives, financial situation or needs of any viewer that may receive it. Kindly also note that past performance is not a reliable indicator of future results. Actual results may differ materially from those anticipated in forward-looking or past performance statements. We assume no liability as to the accuracy or completeness of any of the information and/or content provided herein and the Company cannot be held responsible for any omission, mistake nor for any loss or damage including without limitation to any loss of profit which may arise from reliance on any information supplied by TFA Global Pte Ltd.
The speaker(s) is neither an employee, agent nor representative of Tradu and is therefore acting independently. The opinions given are their own, constitute general market commentary, and do not constitute the opinion or advice of Tradu or any form of personal or investment advice. Tradu neither endorses nor guarantees offerings of third-party speakers, nor is Tradu responsible for the content, veracity or opinions of third-party speakers, presenters or participants.

POSSIBLE SELL OPPORTUNITY ON GBPUSDPrice has fallen dramatically from an area of supply forming a classical reversal pattern. As price moves back up after encountering some demand, we have identified a supply level from which to join the sell trade.

Potential bullish rise?The Cable (GBP/USD) has bounced off the pivot which is an overlap support and could rise to the 1st resistance.
Pivot: 1.3403
1st Support: 1.3319
1st Resistance: 1.3517
Risk Warning:
Trading Forex and CFDs carries a high level of risk to your capital and you should only trade with money you can afford to lose. Trading Forex and CFDs may not be suitable for all investors, so please ensure that you fully understand the risks involved and seek independent advice if necessary.
Disclaimer:
The above opinions given constitute general market commentary, and do not constitute the opinion or advice of IC Markets or any form of personal or investment advice.
Any opinions, news, research, analyses, prices, other information, or links to third-party sites contained on this website are provided on an "as-is" basis, are intended only to be informative, is not an advice nor a recommendation, nor research, or a record of our trading prices, or an offer of, or solicitation for a transaction in any financial instrument and thus should not be treated as such. The information provided does not involve any specific investment objectives, financial situation and needs of any specific person who may receive it. Please be aware, that past performance is not a reliable indicator of future performance and/or results. Past Performance or Forward-looking scenarios based upon the reasonable beliefs of the third-party provider are not a guarantee of future performance. Actual results may differ materially from those anticipated in forward-looking or past performance statements. IC Markets makes no representation or warranty and assumes no liability as to the accuracy or completeness of the information provided, nor any loss arising from any investment based on a recommendation, forecast or any information supplied by any third-party.

GU BUY FROM MAJOR SUPPORT LEVELThe pound has been bullish against the dollar since mid January this year. As bullish pressure persists, we observe price as a previous resistance turned support, with current price action we can look to buy into weekly resistance level.

Potential bullish rise for the Cable?The price has bounced off the support level which is an overlap support that aligns with the 50% Fibonacci retracement and could bounce from this level to our take profit.
Entry: 1.3399
Why we like it:
There is an overlap support level that aligns with the 50% Fibonacci retracement.
Stop loss: 1.3337
Why we like it:
There is a pullback support level that lines up with the 61.8% Fibonacci retracement.
Take profit: 1.3505
Why we like it:
There is a pullback resistance level that aligns with the 50% Fibonacci retracement.
Enjoying your TradingView experience? Review us!
Please be advised that the information presented on TradingView is provided to Vantage (‘Vantage Global Limited’, ‘we’) by a third-party provider (‘Everest Fortune Group’). Please be reminded that you are solely responsible for the trading decisions on your account. There is a very high degree of risk involved in trading. Any information and/or content is intended entirely for research, educational and informational purposes only and does not constitute investment or consultation advice or investment strategy. The information is not tailored to the investment needs of any specific person and therefore does not involve a consideration of any of the investment objectives, financial situation or needs of any viewer that may receive it. Kindly also note that past performance is not a reliable indicator of future results. Actual results may differ materially from those anticipated in forward-looking or past performance statements. We assume no liability as to the accuracy or completeness of any of the information and/or content provided herein and the Company cannot be held responsible for any omission, mistake nor for any loss or damage including without limitation to any loss of profit which may arise from reliance on any information supplied by Everest Fortune Group.

GBPUSD in Downtrend ContinuationExpect the GBPUSD to fill the orders created by the imbalance and then continue the downtrend.
Sell Limit
Entry Price 1.3524
Stop Loss 1.3640
Risk 1%
TP 1.3292

Pound Steady as BoE holds ratesThe British pound is showing limited movement for a second straight day. In the European session, GBP/USD is trading at 1.3435, up 0.18% on the day.
The Bank of England didn't have any surprises up its sleeve as it held rates at 4.25%. This follows a quarter-point cut at last month's meeting. The MPC vote indicated that six members voted to hold while three voted to lower rates. The markets had projected that the vote would be 7-2 in favor of holding rates.
Today's decision to hold rates was widely expected, but that doesn't mean there aren't economic signals which support a rate cut. The UK economy is in trouble and GDP came in at -0.3% in April, its deepest contraction in 18 months.
The weak economy could desperately use a rate cut, but inflation remains stubbornly high and a rate cut would likely send inflation even higher. Annual CPI remained at 3.4% in May, its highest level in over a year.
The geopolitical tensions, most recently the war between Israel and Iran have led to greater economic uncertainty and complicated any plans to lower rates. The BoE is expected to lower rates one or twice in the second half of the year, with the direction of inflation being a key factor in the Bank's rate path.
The Federal Reserve held rates at Wednesday's meeting for a fourth straight time. The Fed noted that inflation remains higher than the target but said the labor market remains strong. President Trump has pushed hard for the Fed to lower rates but Fed Chair Jerome Powell has stuck to his position and repeated on Wednesday that current policy was the most appropriate to respond to the economic uncertainty.

GBPUSDOn the current GBPUSD chart, price action is exhibiting a bullish market structure with consistent higher highs and higher lows on the 4H and 1H timeframes. Price recently broke above a key internal range high, signaling strength from buyers and a likely continuation of the current trend.
Key Technical Points:
Structure Shift: After clearing previous liquidity above 1.2810, the pair established a new bullish internal structure, indicating strong momentum from institutional participants.
Demand Retests: We observed multiple retests of higher timeframe demand zones, which held cleanly with impulsive bullish reaction, confirming the presence of buy-side interest.
Volume and Momentum: Volume increased significantly on the last bullish leg, suggesting participation aligned with the directional move.
Trendline Support: A dynamic trendline from early June lows has acted as support and continues to guide the trend upward.

Cable bounces from $1.34 for nowCable’s established uptrend seems to have paused for now after a slight decline in British inflation and caution from the Bank of England. The BoE highlighted risks in both directions for inflation in its statement and press conference on 19 June while the Fed seemed more concerned about the possibility of rising inflation after its meeting the day before. There seems to have been some demand for the dollar as a haven in recent days as Israel’s war on Iran continues.
The intersection of $1.34 and the 50 SMA from Bands looks like an obvious static-dynamic support which might resist further testing unless there’s a significant change in narratives. The slow stochastic had been flirting with overbought at the start of the week but has now declined strongly, close to the zone of selling saturation.
Resistance is less of an obvious area. A new high seems possible in the near future but trading in the belief that the uptrend will continue seems to be risky in this situation; the risk of a false breakout looks quite high. A range might develop between approximately $1.34 and $1.363. Flash British PMIs on 23 June probably won’t have a strong impact here but a surprise from American final GDP on 26 June might bring a clearer direction.
This is my personal opinion, not the opinion of Exness. This is not a recommendation to trade.

GBP/USD HOLDS NEAR 1.3400 AFTER BOE RATE HOLDGBP/USD hovers around the 1.3400 mark following the Bank of England’s decision to keep interest rates steady at 4.25%, as widely expected. The hold reflects the central bank’s cautious approach amid slowing economic data and persistent global uncertainties.
Meanwhile, during the Asian session, the pair dropped sharply, hitting a one-month low of 1.3382, equivalent to a 0.24% decline on the day. The move was largely driven by a stronger U.S. dollar, which gained traction following the Federal Reserve’s hawkish tone on Wednesday. Additionally, investor sentiment was weighed down by growing concerns over potential U.S. military involvement in the Middle East conflict, further boosting safe haven flows into the dollar and pressuring the pound.
However, a rebound was observed during the European session, as the pair regained some ground. The recovery was buoyed by positive market reaction to BoE Governor Andrew Bailey’s remarks, which, while dovish in tone, provided a sense of stability
TECHNICAL VIEW
From a technical perspective, the pair remains in a clear downtrend, with lower highs and lower lows confirming bearish momentum, as sellers continue to dominate amid broader risk aversion in global markets.
In the face of heightened geopolitical tensions in the Middle East, safe-haven demand for the U.S. dollar has strengthened. This macro backdrop supports continued downside pressure on the pair. If the price breaks below the 1.3382 support, it will signal renewed bearish momentum, opening the door for further declines toward 1.3334, followed by 1.3253.
On the other hand, if buyers’ step and push the price above 1.3476, this would mark a break of the immediate market structure, potentially signaling a bullish reversal or short-term correction. In this scenario, the next upside targets would be 1.3579 and 1.3632, key resistance levels. Meanwhile break out of these levels are not ruled out.
Conclusively, while the prevailing trend remains bearish, volatility driven by geopolitical headlines and dollar strength could result in breakouts on either side.

GBPUSD(20250619)Today's AnalysisMarket news:
Fed's June meeting - kept interest rates unchanged for the fourth time in a row, and the dot plot showed two rate cuts this year, but the number of officials who expected no rate cuts this year rose to 7, and the rate cut expectations for next year were cut to 1. Powell continued to call for uncertainty, and the current economic situation is suitable for waiting and watching. He also expects tariff-driven inflation to rise in the coming months.
Technical analysis:
Today's buying and selling boundaries:
1.3432
Support and resistance levels:
1.3507
1.3479
1.3461
1.3403
1.3385
1.3357
Trading strategy:
If the price breaks through 1.3432, consider buying, and the first target price is 1.3461
If the price breaks through 1.3403, consider selling, and the first target price is 1.3385

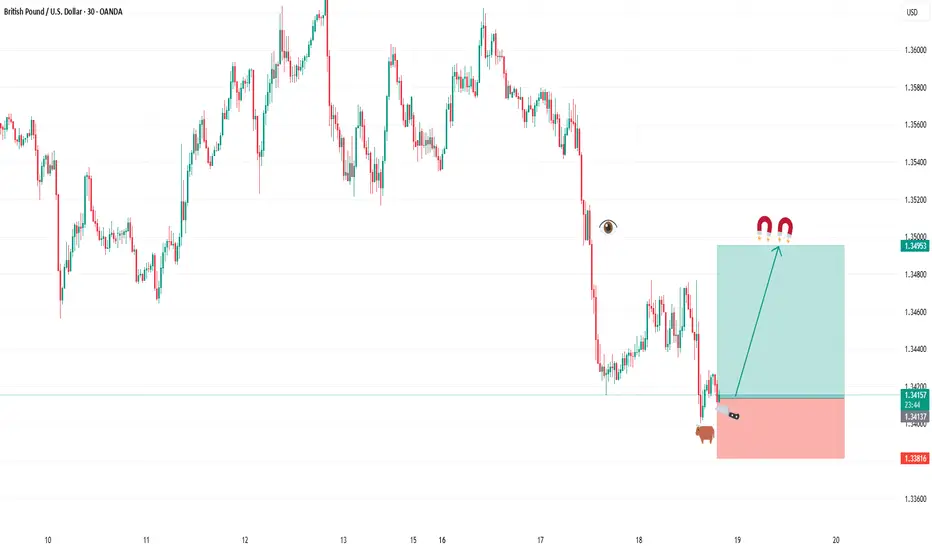
GBPUSD shortPrice retested an area of interest and a orderblock. Price is also in downtrend. Price is also rejecting the area of interest and the 30min orderblock. The take profit and stop loss are indicated on the chart.

WILL THE GBPUSD DIP?Looking at that upward trendline I think the GBPUSD might sell down to the 1.34225 level or even sell further if it manages to break the resistance turned support thats near the upward trendline, and also considering the previous candlestick, a bearish pinbar, showing sellers are coming in, I dont plan on selling for long here.
GBPUSDSell. Market Execution. trade 1:2. risk 0.50%
we are going in sell because of the market respecting que sellers zone.

GBPUSdSeeing a really positive bullish movement for GU. Liquidity got swept and lows got taken out on daily and weekly

GBPUSD Analysis todayHello traders, this is a complete multiple timeframe analysis of this pair. We see could find significant trading opportunities as per analysis upon price action confirmation we may take this trade. Smash the like button if you find value in this analysis and drop a comment if you have any questions or let me know which pair to cover in my next analysis.
