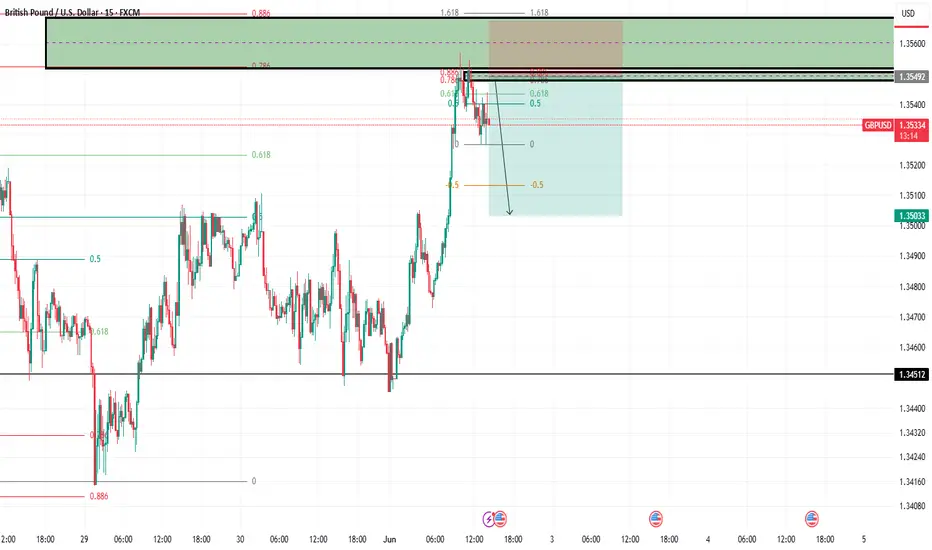
BUY OPPORTUNITYGBP/USD Trade
Entry: 1.35229
Take Profit (TP): 1.35545
Stop Loss (SL): 1.35144
Risk-Reward Ratio: 1:3
Technical Analysis
Price Action:
The GBP/USD pair is currently trading within a tight range between 1.35160 (support) and 1.35582 (resistance) on the 15-minute timeframe. Price has shown multiple touches on both ends of this range, indicating a consolidation phase where neither buyers nor sellers have taken control.
ADX Indicator:
The Average Directional Index (ADX) is hovering around 10, which signals very weak trend strength and confirms the current consolidation. This means the market lacks clear momentum to break out decisively in either direction, increasing the probability of price continuing to oscillate within this range in the short term.
Oscillators & Momentum:
With weak ADX and price stuck within the range, momentum indicators suggest limited directional bias. This setup is ideal for a mean reversion or range trading strategy, where the price is expected to bounce between support and resistance.
USDGBP trade ideas

GBPUSDGBP/USD Upcoming Economic Data, 10-Year Bond Yield, Interest Rate Differential, and Carry Trade (June 1–10, 2025)
1. Upcoming Economic Data (June 1–10, 2025)
Date Event Expected Impact on GBP/USD
June 2 UK PMI Composite (May) Strong PMI supports GBP; weak data pressures GBP
June 3 UK Services PMI Key for assessing UK economic momentum; influences GBP sentiment
June 4 UK Construction PMI Reflects sector health; positive print supports GBP
June 6 US Nonfarm Payrolls (NFP) Strong US jobs data strengthens USD, pressures GBP/USD
June 6 US Average Hourly Earnings Wage growth impacts Fed policy outlook and USD strength
June 9 UK GDP (Preliminary Q1) Critical for BoE policy outlook; strong GDP supports GBP
June 10 UK CPI Inflation (May) Higher inflation may delay BoE cuts, supporting GBP
Note: UK inflation data recently printed higher than expected, and US jobs data will be a major driver of USD strength.
2. 10-Year Bond Yields and Interest Rate Differential
UK 10-Year Gilt Yield: Approximately 4.77% (as of late May 2025)
US 10-Year Treasury Yield: Approximately 4.51% (late May 2025)
Yield Spread:
4.77% (UK)−4.51% (US)=+0.26%
The UK’s higher bond yield provides a modest carry advantage for GBP over USD.
Policy Rates:
Bank of England (BoE): 4.25% (recently cut by 25bps)
Federal Reserve (Fed): 4.25–4.50%
Interest Rate Differential: Slightly favors USD on policy rates but favors GBP on bond yields.
3. Carry Trade Directional Bias
The carry trade involves borrowing in a currency with lower interest rates and investing in one with higher yields.
Given the UK’s higher 10-year gilt yields (+0.26%), there is a modest carry trade advantage supporting GBP against USD.
However, the Fed’s slightly higher policy rate and the BoE’s dovish stance (rate cuts expected) temper this advantage.
Overall, the carry trade bias for GBP/USD is neutral to slightly bullish for GBP, supported by bond yields but capped by policy rate expectations.
4. Technical and Market Outlook
GBP/USD recently tested resistance near supply roof and faced selling pressure, but got support the broken supply roof on daily and now trades on the floor as demand .
Market sentiment remains cautious due to geopolitical uncertainties and tariff negotiations impacting USD strength.
The upcoming US jobs data (June 6) is a key event that could sway USD and thus GBP/USD direction.
Summary Table
Metric UK (GBP) US (USD)
10-Year Bond Yield ~4.77% ~4.51%
Policy Interest Rate 4.25% (BoE) 4.25–4.50% (Fed)
Yield Spread (10Y) +0.26% (GBP over USD) —
Interest Rate Differential Slightly favors USD —
Carry Trade Directional Bias Neutral to slightly bullish for GBP —
Key Upcoming Data UK PMI, GDP, CPI US NFP, Wage Data
Conclusion
GBP/USD faces a mixed outlook with modest carry trade support from higher UK bond yields but pressure from Fed’s higher policy rates and USD strength.
Upcoming UK data (PMI, GDP, CPI) will shape BoE policy expectations and GBP sentiment.
US jobs data on June 6 is critical for USD direction and, by extension, GBP/USD.
#gbpusd #dollar

Dollar Bearish Dollar is always the bible in my analysis. Beautiful run down towards the target as outline 2 weeks ago. Still got some legs to hit our targets eventually.
#swingtrading #usd


GBPUSD | Harmonics Pattern ABCDGBPUSD has printed diverngence on top and is probably going into a bearish trend.

GBP USD LONG (LONDON BREAKOUT) 1possible scenario: backed by London break out and the fact that there is no such important news today till new York session its possible that it can hold on to the momentum it has ...
note for my self: today i mixed the UTC hours with my time zone so i missed my Strat to open a trade, i saw the setup is on then i got anxious so i put a instant buy order, for future i got to be more disciplined and i know i did a bad thing and maybe not today but ill be punished for this kind of of behavior, i put two buy limits on proper prices with lower risks, i have to have a plan maybe not to do such a thing, its still not back tested, to put buy orders, but the good thing is that all of the setup has the same sl so as we get lower the sl would be shorter too
this is like a journal for me, for future i would try to execute trades as planned and show the real setup, today cause i missed the fire accept a hollow of it , and i hope your portfolio to be green!❤️

Potential bearish drop?GBP/USD has rejected off the reistance level which is a pullback resistance and could drop from this level to our take profit.
Entry: 1.3551
Why we like it:
There is a pullback resistance level.
Stop loss: 1.3590
Why we like it:
There is a pullback resistance level.
Take profit: 1.3446
Why we like it:
There is an overlap support level.
Enjoying your TradingView experience? Review us!
Please be advised that the information presented on TradingView is provided to Vantage (‘Vantage Global Limited’, ‘we’) by a third-party provider (‘Everest Fortune Group’). Please be reminded that you are solely responsible for the trading decisions on your account. There is a very high degree of risk involved in trading. Any information and/or content is intended entirely for research, educational and informational purposes only and does not constitute investment or consultation advice or investment strategy. The information is not tailored to the investment needs of any specific person and therefore does not involve a consideration of any of the investment objectives, financial situation or needs of any viewer that may receive it. Kindly also note that past performance is not a reliable indicator of future results. Actual results may differ materially from those anticipated in forward-looking or past performance statements. We assume no liability as to the accuracy or completeness of any of the information and/or content provided herein and the Company cannot be held responsible for any omission, mistake nor for any loss or damage including without limitation to any loss of profit which may arise from reliance on any information supplied by Everest Fortune Group.

GBP/USD Testing Resistance- Battle Lines Drawn into June OpenOne of the cleaner setups into the start of the week / month- Sterling opens the session with a test of confluent resistance into the yearly high-day close (HDC) at 1.3564- looking for a reaction there today with a breach / close above needed to fuel the next leg of the advance towards 1.3671-1.3705.
Initial support rests with the 2019 high at 1.3515 backed closely by the 78.6% retracement / 2024 high at 1.3414/34- note that the median-line converges on this threshold over the next few days and a break / close below would suggest a more significant high was registered last month / a larger reversal is underway.
-MB

post news (gbpusd) 1US Manufacturing PMI at 48.5%; May 2025 Manufacturing ISM Report On Business
.
.
.
SM: US manufacturing activity slows further in June
.
.
.
can be a viable setup with sl equal to one hour atr and tp 1.5 times the sl

The current trend of the US dollar remains bullish.During the European session, the US Dollar Index extended its weakness, falling 0.67% intraday to 98.7731, approaching the low seen on April 22nd. GBP/USD rose synchronously by 0.61% to 1.3538.
Key Drivers:
Tariff rhetoric reignites market concerns
Potential impact of the S899 clause
Diverging expectations on Federal Reserve policy
ING analyst Chris Turner noted: "The risk of early termination of the trade agreement and the S899 clause have created dual pressures, causing the US dollar to continue weakening. GBP/USD is likely to remain bullish-dominated."
Humans need to breathe, and perfect trading is like breathing—maintaining flexibility without needing to trade every market swing. The secret to profitable trading lies in implementing simple rules: repeating simple tasks consistently and enforcing them strictly over the long term.
Trading Strategy:
buy@1.13400-1.13450
TP:1.13550-1.13600

BullishGiving a clear bullish entry point now. There I a sweet in the asain H1 candle and a break of structure, that gave me a clear trade idea.

GBP/USD - Rejection of lower prices On GBP/USD , it's nice to see a strong buying reaction at the price of 1.34370.
There's a significant accumulation of contracts in this area, indicating strong buyer interest. I believe that buyers who entered at this level will defend their long positions. If the price returns to this area, strong buyers will likely push the market up again.
Rejection of lower prices and high volume cluster are the main reasons for my decision to go long on this trade.
Happy trading
Dale

Buy GBPUSD The present structure shows a bullish trend but there will be a pullback to the entry point, which is what drives the liquidity market.

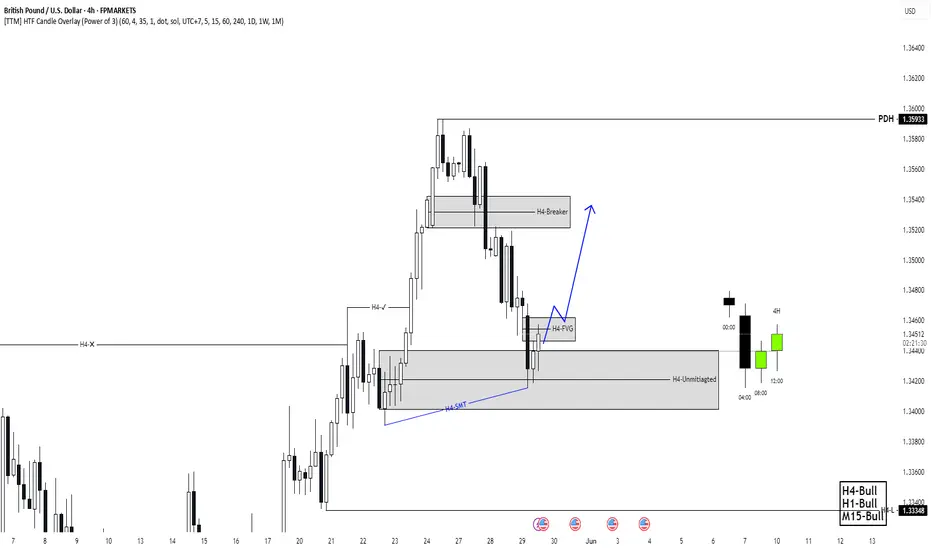
GBPUSD Bullish Flag and W formation on H4DXY is weak and it is therefore not surprising that GBPUSD is gaining strength. According to the rules of the bull flag measured move target, the bulls will be in this ride for a while.
As long as that H4 demand continues to hold, look for buying opportunities and ride the trend to the upside.

GBP/USD HEIST ALERT: Bullish Breakout or Bearish Trap?🌟 Hey! Hola! Ola! Bonjour! Hallo! Marhaba! 🌟
Calling all Market Robbers & Profit Pirates!💸💰
🔥 Thief Trading Intel: Our crew’s latest heist targets GBP/USD "The Cable"—bullish breakout incoming! Long entry only. High-risk Red Zone ahead: overbought, consolidating, and ripe for a reversal. Don’t get caught in the bear trap! 🏴☠️
"Take your loot and run, trader—you’ve earned this steal!" 💪🎯
🚪 ENTRY: The Heist Begins!
📈 "Wait for MA breakout (1.36000) then STRIKE—bullish profits await!"
Option 1: Buy Stop above Pink Resistance (breakout confirmation).
Option 2: Buy Limit at swing low/high (15-30 min TF).
📌 Pro Tip: SET AN ALERT! Don’t miss the breakout.
🛑 STOP LOSS: Escape Route
🔊 "Yo, listen up! 🗣️
Buy Stop orders? NO SL until after breakout! 🚀
Rebels: Place SL wherever—but you’ve been warned! ⚠️🔥
📍 Thief SL (Smart Crew): Recent/swing low (1.35000, 4H TF).
📍 Adjust based on your risk, lot size, and orders.
🎯 TARGET: Loot & Exit!
🎯 1.37500 (or escape early if the market turns!)
⚡ SCALPERS’ QUICK GRAB
👀 Long scalps ONLY!
Big wallets? Raid now.
Small stacks? Join swing traders.
Trailing SL = Your Money Shield! 🛡️💰
📢 WHY THIS HEIST? (GBP/USD Bullish Momentum)
"The Cable" is heating up! Key drivers:
Fundamentals (COT, Macro Data)
Sentiment & Intermarket Trends
Future Targets & Score Outlook
🔗 Full intel? Bio links below! 👉👉
⚠️ TRADING ALERT: News = Danger Zone! 📰🚨
News = Volatility Spikes! Protect your loot:
❌ Avoid new trades during news.
🔒 Trailing SL = Profit Lock.
💖 SUPPORT THE HEIST CREW!
💥 SMASH THAT BOOST BUTTON! 💥
More boosts = easier money grabs!
Stronger crew = bigger heists!
Profit daily with Thief Trading Style! 🏆🚀
Next heist coming soon—stay tuned! 🤑🐱👤🤩

GBPUSD SELL📉 Trade Setup Alert – GBP/USD
Get ready to SELL GBP/USD 🔻
We're waiting for price to hit our sensitive zone before entering the trade.
🎯 Zone of Sensitivity: Watch closely for price reaction
📌 Action: Sell after confirmation
🛑 Risk Management: Set stop-loss just above the zone
💡 Tip: Wait for bearish confirmation (e.g. candlestick patterns, trend rejection)
Patience pays — let the market come to you.
AQV trade setup CRT candle light dinner and dinner and a giye or after tapped it was thinking about today and closes the candle or not to mention I am a right 👍👍👍👍👍👍👍👍👍👍👍 enjoy kar ke lye ❤️❤️🥺 acha laga hai 😳 I take the time and dinner with the wahi baat to ye kya kar Raha hu wo kaise ho, "" don't take the upper words seriously, 😳 these are just key board suggestions 😉"" watch the trade

GBPUSD Analysis Today: Technical and Order Flow !In this video I will be sharing my GBPUSD analysis today, by providing my complete technical and order flow analysis, so you can watch it to possibly improve your forex trading skillset. The video is structured in 3 parts, first I will be performing my complete technical analysis, then I will be moving to the COT data analysis, so how the big payers in market are moving their orders, and to do this I will be using my customized proprietary software and then I will be putting together these two different types of analysis.

$GBPUSD #IDEA#GBPUSD #IDEA BAse on higher TF is my bullish idea and i will wait until it from something in bullish in Smaller Tf for confirm my IDEA
GBPUSD: Important Breakout📈GBPUSD has surpassed and closed above a crucial intraday horizontal resistance level.
The highlighted blue region represents the neckline of a cup and handle pattern.
This breakout suggests further upward movement.
The next resistance level is at 1.3580.

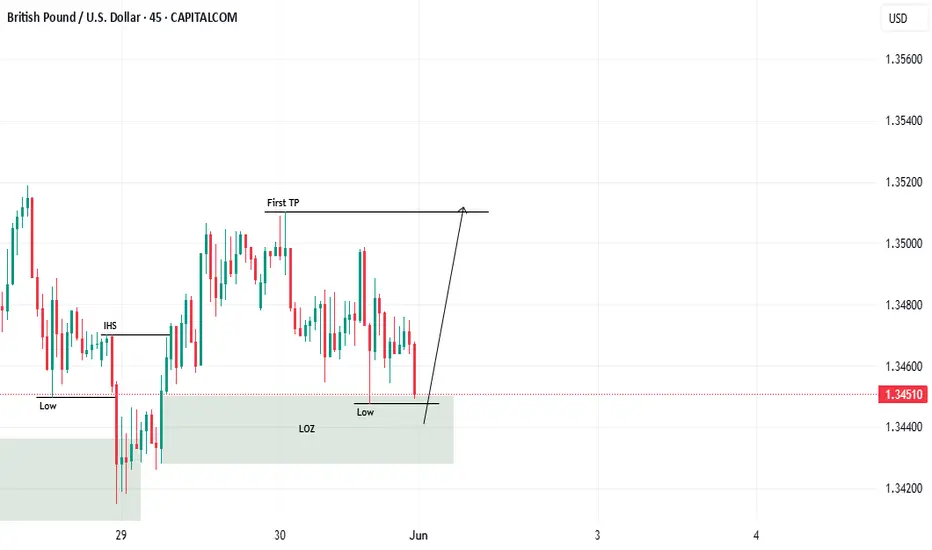
Scalp Buy!Hello Everyone. market react to an LOZ and will make a Proper Structure (I mean break the low again). then market will go up!(wink)
GBPUSD Is Bearish! Short!
Here is our detailed technical review for GBPUSD.
Time Frame: 7h
Current Trend: Bearish
Sentiment: Overbought (based on 7-period RSI)
Forecast: Bearish
The market is approaching a significant resistance area 1.353.
Due to the fact that we see a positive bearish reaction from the underlined area, I strongly believe that sellers will manage to push the price all the way down to 1.341 level.
P.S
Overbought describes a period of time where there has been a significant and consistent upward move in price over a period of time without much pullback.
Disclosure: I am part of Trade Nation's Influencer program and receive a monthly fee for using their TradingView charts in my analysis.
Like and subscribe and comment my ideas if you enjoy them!

GU-Mon-2/06/25 TDA-GU pushing up, possible breakout buy!Analysis done directly on the chart
Follow for more, possible live trades update!
Breakout trade:
It's always good to wait for candle closure above
or below certain levels (depending on if you are buying
or selling). Then have lower timeframe structure to
put good sl and be able to manage properly.
Always know beforehand where to put your sl and tp.
Not financial advice, DYOR.
Market Flow Strategy
Mister Y
