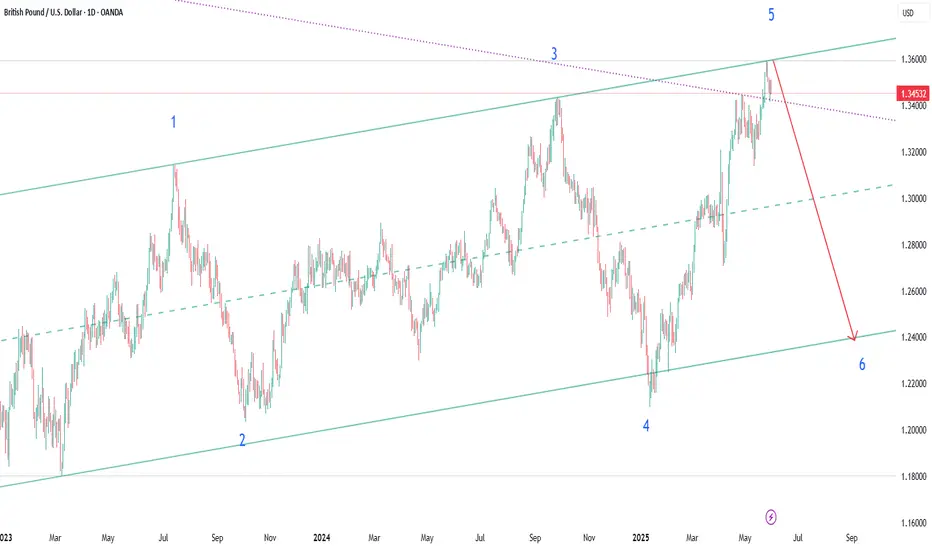
GBP/USD – Major Rejection Incoming? Smart Money Zone in Play!GBP/USD has tapped into a key weekly supply zone (1.3510 – 1.3550) where we previously saw heavy institutional selling. Price has shown signs of stalling after a strong bullish run.
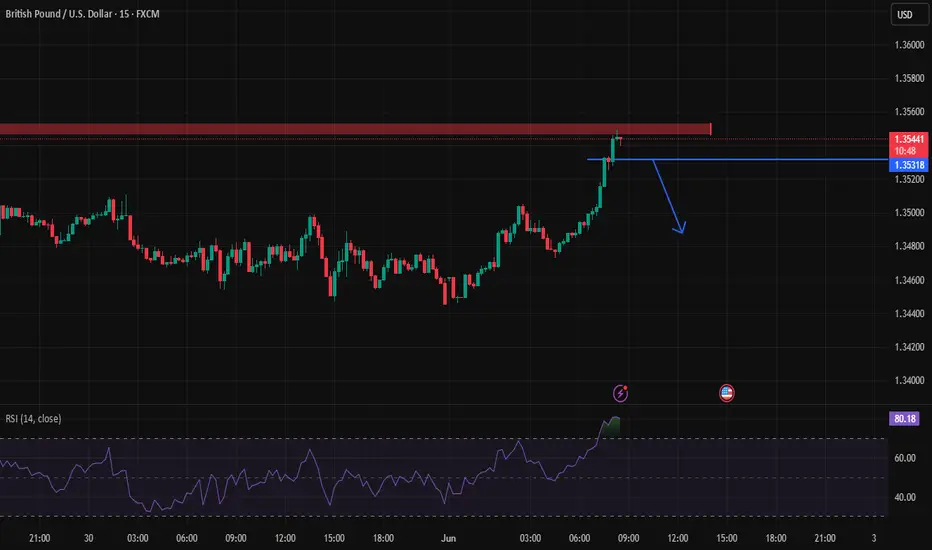
🔹 We're sitting at a high-volume node with diminishing bullish momentum.
🔹 Upcoming USD news events (3 red icons below) could bring the volatility needed for a sharp reaction.
---
🔥 Key Price Levels
🔵 Supply Zone: 1.3510 – 1.3550 → Currently reacting
🔵 First Support: 1.2845 → Previous demand, now a possible bounce zone
🟠 Major Demand Zone: 1.2332 – 1.2470 → Where the March rally started
Red arrows show possible path of a deeper correction if the bulls lose control.
---
🧠 Smart Money POV
This could be a classic distribution zone before a deeper retracement. Price swept liquidity above previous highs — a typical trap before a reversal. If this level holds, expect a potential bearish drop toward 1.2845 and beyond.
---
💡 Trade Setup (For Study/Backtesting)
> Scenario 1: Bearish Reversal Play
📍 Entry: 1.3530 – 1.3550
🎯 TP1: 1.2845
🎯 TP2: 1.2470
❌ SL: 1.3585+
> Scenario 2: Breakout Play
🔁 Wait for strong 4H close above 1.3560
🎯 Target: 1.3700+
❌ SL: Below 1.3510
---
🧨 Event Risk Alert
Heavy USD news ahead. Be prepared for fakeouts or aggressive moves during high-impact announcements.
---
💬 Do you think GBPUSD has topped out or is this just a pause before the next leg up?
🧠 Comment below & let’s discuss setups.
👍 Like & Follow for more Smart Money price action charts!
USDGBP trade ideas

The Day AheadKey Economic Data Releases
United States
ISM Manufacturing Index (May)
A leading indicator for the economy. A stronger-than-expected reading could strengthen the USD and raise Treasury yields.
Construction Spending (April)
Tracks activity in the construction sector, useful for GDP estimates.
United Kingdom
Net Consumer Credit & M4 Money Supply (April)
Provides insights into consumer borrowing and monetary conditions. Could impact expectations for Bank of England rate policy.
Japan
Q1 MoF Corporate Survey
Gives details on corporate investment and sentiment. Relevant for the yen and Bank of Japan policy expectations.
Italy
Manufacturing PMI (May)
A reading below 50 suggests contraction. Important for eurozone growth outlook and Italian asset risk premiums.
New Car Registrations
Measures consumer demand; useful for sentiment tracking.
Budget Balance
Signals fiscal stance; could influence bond spreads versus German bunds.
Canada
Manufacturing PMI (May)
A forward-looking business condition indicator. Could influence the Canadian dollar, especially if divergent from the US PMI.
Switzerland
Q1 GDP
Market will watch for economic resilience or slowdown. May influence Swiss franc and SNB expectations.
Central Bank Speakers
Federal Reserve
Jerome Powell (Chair)
Christopher Waller (Governor)
Lorie Logan (Dallas Fed President)
Austan Goolsbee (Chicago Fed President)
Market Focus:
Any remarks on inflation persistence, growth outlook, or timing of potential rate cuts could impact the USD, equity futures, and front-end yields. Waller and Logan are particularly market-sensitive.
Bank of England
Catherine Mann (MPC Member)
Market Focus:
A known hawk—her comments on inflation and rate cut timing could influence sterling and UK short-term rates.
Trading Implications
The US ISM manufacturing index is the most market-sensitive data point of the day.
Fed speakers could significantly affect interest rate expectations and USD.
UK and Japan data will influence BoE and BoJ rate path expectations, impacting GBP and JPY.
Risk assets may react to broad manufacturing PMI trends and any hawkish/dovish surprises from central bankers.
This communication is for informational purposes only and should not be viewed as any form of recommendation as to a particular course of action or as investment advice. It is not intended as an offer or solicitation for the purchase or sale of any financial instrument or as an official confirmation of any transaction. Opinions, estimates and assumptions expressed herein are made as of the date of this communication and are subject to change without notice. This communication has been prepared based upon information, including market prices, data and other information, believed to be reliable; however, Trade Nation does not warrant its completeness or accuracy. All market prices and market data contained in or attached to this communication are indicative and subject to change without notice.

SHORT IT !! - GBPUSD SHORT FORECAST Q2 W23 D2 Y25GBPUSD SHORT FORECAST Q2 W23 D2 Y25
🔥👀QUICK SCOPE TECHNICAL REVERSAL HOT PICK
Professional Risk Managers👋
Welcome back to another FRGNT chart update📈
Diving into some Forex setups using predominantly higher time frame order blocks alongside confirmation breaks of structure.
Let’s see what price action is telling us today!
💡Here are some trade confluences📝
✅Weekly order block
✅15' order block
✅4 hour order block
✅Tokyo ranges to be filled
🔑 Remember, to participate in trading comes always with a degree of risk, therefore as professional risk managers it remains vital that we stick to our risk management plan as well as our trading strategies.
📈The rest, we leave to the balance of probabilities.
💡Fail to plan. Plan to fail.
🏆It has always been that simple.
❤️Good luck with your trading journey, I shall see you at the very top.
🎯Trade consistent, FRGNT X

GBPUSD SHORTCurrently in a supply zone whihc has remained unmitigated since Aug 22.
Waiting on 1h break of structure to the downside from current position. We have had a double top on the 4H chart as shown on image.
Once price action has broken structure to the downside on the 1H chart, I will look to take a short.
Depending on length of hold I will look first to target the demand marked around the 1.33 zone but there is potential to ride this all the way down to 1.28607 depending on the market.
Will be trailing my stop so that we can take as much of this as is possible within risk parameters.
TRADE - SHORT :
Entry TBC
SL : 1.35936
TP : 1.28607 (managed)

GBPUSD - Trade Idea for Today ! Hurry Up !Details on chart. There some important levels here and we might see a downward move here.
CMCMARKETS:GBPUSD FX:GBPUSD OANDA:GBPUSD FX_IDC:GBPUSD

GBPUSD I Weekly CLS I Model 1 I TR Liquidity TPHey, Market Warriors, here is another outlook on this instrument
If you’ve been following me, you already know every setup you see is built around a CLS Footprint, a Key Level, Liquidity and a specific execution model.
If you haven't followed me yet, start now.
My trading system is completely mechanical — designed to remove emotions, opinions, and impulsive decisions. No messy diagonal lines. No random drawings. Just clarity, structure, and execution.
🧩 What is CLS?
CLS is real smart money — the combined power of major investment banks and central banks moving over 6.5 trillion dollars a day. Understanding their operations is key to markets.
✅ Understanding the behavior of CLS allows you to position yourself with the giants during the market manipulations — leading to buying lows and selling highs - cleaner entries, clearer exits, and consistent profits.
📍 Model 1
is right after the manipulation of the CLS candle when CIOD occurs, and we are targeting 50% of the CLS range. H4 CLS ranges supported by HTF go straight to the opposing range.
"Adapt what is useful, reject what is useless, and add what is specifically your own."
— David Perk aka Dave FX Hunter ⚔️
👍 Hit like if you find this analysis helpful, and don't hesitate to comment with your opinions, charts or any questions.

GBP/USD Forming Bearish Rising Wedge | Breakdown Expected Soon📈 GBP/USD – 1H Chart Analysis
Price formed a Rising Wedge Pattern, which typically signals a bearish reversal. After a period of consolidation, the pair started trending upwards inside the wedge, but momentum appears to be fading.
🔍 Current Price: 1.35350
📉 Pattern: Rising Wedge (Bearish)
If price breaks below the lower trendline, we could see a drop towards the following support levels:
🟡 Support Zones:
1️⃣ 1.30142 (1st support level)
2️⃣ 1.28735
3️⃣ 1.27081
⚠️ Breakdown confirmation with volume is key. A failed breakout to the upside could also trap buyers before the real move down.
🔔 Stay alert for price action near wedge boundaries!
📌 Not financial advice. For educational purposes only.

GBPUSD INTRADAY Consolidation breakout The GBP/USD currency pair maintains a bullish sentiment, supported by a rising trendline and sustained higher lows. The recent intraday price action suggests a corrective pullback within an overall uptrend, indicative of a consolidation phase rather than a reversal.
Key Support Level: 1.3400
This level aligns with a previous consolidation zone and is acting as a pivotal support. A pullback toward this level could offer a potential buying opportunity, especially if bullish momentum returns.
Upside Targets (on bullish continuation from 1.3400):
1.3515 – Initial resistance from prior swing high
1.3580 – Intermediate resistance level
1.3630 – Long-term target and potential top of the current bullish channel
Bearish Scenario (if 1.3400 fails):
A daily close below 1.3400 would invalidate the current bullish setup, signaling a potential shift in trend. In that case:
Immediate support at 1.3360
Deeper retracement could extend to 1.3310
Conclusion
The broader trend in GBP/USD remains bullish, with the current consolidation viewed as a potential pullback rather than a reversal. The 1.3400 level is critical — a bounce from here could resume the uptrend toward 1.3630 over time. However, a break and close below 1.3400 would weaken the bullish case and open the door to further downside. Traders should monitor price action closely around this key level for confirmation.
This communication is for informational purposes only and should not be viewed as any form of recommendation as to a particular course of action or as investment advice. It is not intended as an offer or solicitation for the purchase or sale of any financial instrument or as an official confirmation of any transaction. Opinions, estimates and assumptions expressed herein are made as of the date of this communication and are subject to change without notice. This communication has been prepared based upon information, including market prices, data and other information, believed to be reliable; however, Trade Nation does not warrant its completeness or accuracy. All market prices and market data contained in or attached to this communication are indicative and subject to change without notice.

uptrendConsidering the price behavior in the current resistance zone, possible scenarios have been identified. It is expected that after some fluctuation, the corrective trend will continue.
By stabilizing above the resistance zone, the upward trend will continue.

GBPUSD Holds Above 1.34 – Is 1.35 the Launch Pad?In last week’s GBPUSD outlook, I pointed to the 1.34 zone as a potential buy area and likely end of the correction.
The market reacted as expected, reversing from 1.34 and rallying to 1.35. Toward the end of the week, a brief correction followed — but price held above 1.34 and has now returned to 1.35, printing a higher low in the process.
📌 From both a technical and psychological standpoint, 1.35 remains a key level. A confirmed break above could lead to a retest of the recent high — or even push for a new high.
✅ My bias stays bullish as long as 1.34 support remains intact.
Disclosure: I am part of TradeNation's Influencer program and receive a monthly fee for using their TradingView charts in my analyses and educational articles.

Market next target 🔍 Original Analysis Summary:
Bearish Outlook: Price is expected to decline from the recent high.
Support Level: Identified near 1.34400.
Target Zone: Around 1.34200 based on breakdown expectations.
Reasoning: Possibly based on rejection near resistance and anticipation of bearish follow-through.
---
⚠️ Disruption (Bullish/Neutral Counter-Scenario):
1. Strong Bullish Candle at Resistance
The last candle is a bullish engulfing near recent highs, indicating buyer strength.
Rather than rejecting, price appears to break out of consolidation.
---
2. Volume Supporting Bullish Momentum
Increasing green volume bars show accumulating demand, not weakness.
Could imply a liquidity grab before a bullish continuation.
---
3. Failed Breakdown Attempts
Price has attempted to fall multiple times (wicks downward), but was bought up quickly.
That often signals trap setups where short sellers are being baited.
---
4. Macro Sentiment / USD Weakness Risk
With upcoming U.S. economic news (red circle), any sign of a weaker USD could invalidate the bearish scenario entirely.
GBP tends to benefit from any shift in U.S. interest rate expectations or economic softness.

Relative Equal Highs are the DOLThere is Sell side Liquidity below that the I think we'll take out before we head higher.

GBPUSD H1 | Bouncing Off the 78.6% FiboBased on the H1 chart analysis, the price is falling toward our buy entry level at 1.3438, a pullback support that aligns closely with the 78.6% Fibonacci retracement.
Our take profit is set at 1.3486, a pullback resistance.
The stop loss is placed at 1.3387, a swing low support.
High Risk Investment Warning
Trading Forex/CFDs on margin carries a high level of risk and may not be suitable for all investors. Leverage can work against you.
Stratos Markets Limited (tradu.com ):
CFDs are complex instruments and come with a high risk of losing money rapidly due to leverage. 63% of retail investor accounts lose money when trading CFDs with this provider. You should consider whether you understand how CFDs work and whether you can afford to take the high risk of losing your money.
Stratos Europe Ltd (tradu.com ):
CFDs are complex instruments and come with a high risk of losing money rapidly due to leverage. 63% of retail investor accounts lose money when trading CFDs with this provider. You should consider whether you understand how CFDs work and whether you can afford to take the high risk of losing your money.
Stratos Global LLC (tradu.com ):
Losses can exceed deposits.
Please be advised that the information presented on TradingView is provided to Tradu (‘Company’, ‘we’) by a third-party provider (‘TFA Global Pte Ltd’). Please be reminded that you are solely responsible for the trading decisions on your account. There is a very high degree of risk involved in trading. Any information and/or content is intended entirely for research, educational and informational purposes only and does not constitute investment or consultation advice or investment strategy. The information is not tailored to the investment needs of any specific person and therefore does not involve a consideration of any of the investment objectives, financial situation or needs of any viewer that may receive it. Kindly also note that past performance is not a reliable indicator of future results. Actual results may differ materially from those anticipated in forward-looking or past performance statements. We assume no liability as to the accuracy or completeness of any of the information and/or content provided herein and the Company cannot be held responsible for any omission, mistake nor for any loss or damage including without limitation to any loss of profit which may arise from reliance on any information supplied by TFA Global Pte Ltd.
The speaker(s) is neither an employee, agent nor representative of Tradu and is therefore acting independently. The opinions given are their own, constitute general market commentary, and do not constitute the opinion or advice of Tradu or any form of personal or investment advice. Tradu neither endorses nor guarantees offerings of third-party speakers, nor is Tradu responsible for the content, veracity or opinions of third-party speakers, presenters or participants.

GBP/USD Bullish Channel Holding–Pullback Before the Next Leg Up?This is a 4-hour chart of the British Pound vs US Dollar (GBP/USD) from FXCM, showing a strong bullish market structure within a rising parallel channel.
🔍 Key Technical Insights:
Uptrend Channel: Price has been consistently making higher highs and higher lows within a well-defined ascending channel.
Support Zones: Three horizontal levels are marked at 1.348, 1.333, and 1.326 — likely acting as short-term demand zones or reaction points.
Projection Path (Red Line): A pullback into the lower part of the channel (likely near 1.333–1.326 zone) is anticipated, followed by a bullish continuation toward the upper channel resistance.
🧭 Market Outlook:
Bias: Bullish while above channel support.
Buy Area: Ideal long setup may develop around the 1.333–1.326 support region.
Target Zone: Potential continuation toward 1.410+ if the structure holds.
This chart favors trend continuation after a correction, aligning with smart money accumulation and institutional flow behavior within a bullish channel.

GBP-USD Will Go UP! Buy!
Hello,Traders!
GBP-USD is trading in an
Uptrend and the pair already
Made a rebound from the
Horizontal support level
Around 1.3431 from where
So we are bullish biased
And we will be expecting
A further bullish move up
Buy!
Comment and subscribe to help us grow!
Check out other forecasts below too!
Disclosure: I am part of Trade Nation's Influencer program and receive a monthly fee for using their TradingView charts in my analysis.

GBP/USD – Where the real game beginsMost traders keep refreshing the chart, waiting for something obvious to happen. But here’s the thing...
The obvious move is never the most profitable one. The market rewards those who understand context, not just candlestick shapes.
Take a deeper look at this pair right now.
You’ll notice something subtle — but powerful.
📍 We’ve been consolidating right above a demand zone that’s been respected multiple times.
📉 Sellers tried to break it... failed.
📈 Buyers stepped in... quietly. No fireworks. Just clean defense.
This isn’t your average support line. This is where liquidity gets trapped, where retail gets impatient, and where smart money fills up before liftoff.
It’s the type of setup that doesn’t scream — it whispers. And if you’re listening, you know this isn’t random.
🔎 While most are distracted by noise, the structure is forming beneath the surface.
A slow coil of price, compression of volatility — and then... expansion.
And no, I won’t drop the entry, stop or TP here.
Because real traders don’t chase numbers — they read the narrative.
📚
#gbpusd #forexstrategy #institutionaltrading #smartmoneyflow #supplyanddemand #priceaction #marketpsychology #liquiditytrap #notforbeginners #telegramonly


Potential bearish drop?GBP/USD has reacted off the resistance level which is a pullback resistance that lines up with the 50% Fibonacci retracement and could drop from this level to our take profit.
Entry: 1.3346
Why we like it:
There is a pullback resistance level that aligns with the 50% Fibonacci retracement.
Stop loss: 1.3591
Why we like it:
There is a pullback resistance level.
Take profit: 1.3346
Why we like it:
There is a pullback support level that lines up with the 50% Fibonacci retracement.
Enjoying your TradingView experience? Review us!
Please be advised that the information presented on TradingView is provided to Vantage (‘Vantage Global Limited’, ‘we’) by a third-party provider (‘Everest Fortune Group’). Please be reminded that you are solely responsible for the trading decisions on your account. There is a very high degree of risk involved in trading. Any information and/or content is intended entirely for research, educational and informational purposes only and does not constitute investment or consultation advice or investment strategy. The information is not tailored to the investment needs of any specific person and therefore does not involve a consideration of any of the investment objectives, financial situation or needs of any viewer that may receive it. Kindly also note that past performance is not a reliable indicator of future results. Actual results may differ materially from those anticipated in forward-looking or past performance statements. We assume no liability as to the accuracy or completeness of any of the information and/or content provided herein and the Company cannot be held responsible for any omission, mistake nor for any loss or damage including without limitation to any loss of profit which may arise from reliance on any information supplied by Everest Fortune Group.

Falling towards 61.8% Fibonacci support?The Cable (GBP/USD) is falling towards the pivot and could bounce to the 1st resistance, which is a pullback resistance.
Pivot: 1.3314
1st Support: 1.3159
1st Resistance: 1.3566
Risk Warning:
Trading Forex and CFDs carries a high level of risk to your capital and you should only trade with money you can afford to lose. Trading Forex and CFDs may not be suitable for all investors, so please ensure that you fully understand the risks involved and seek independent advice if necessary.
Disclaimer:
The above opinions given constitute general market commentary, and do not constitute the opinion or advice of IC Markets or any form of personal or investment advice.
Any opinions, news, research, analyses, prices, other information, or links to third-party sites contained on this website are provided on an "as-is" basis, are intended only to be informative, is not an advice nor a recommendation, nor research, or a record of our trading prices, or an offer of, or solicitation for a transaction in any financial instrument and thus should not be treated as such. The information provided does not involve any specific investment objectives, financial situation and needs of any specific person who may receive it. Please be aware, that past performance is not a reliable indicator of future performance and/or results. Past Performance or Forward-looking scenarios based upon the reasonable beliefs of the third-party provider are not a guarantee of future performance. Actual results may differ materially from those anticipated in forward-looking or past performance statements. IC Markets makes no representation or warranty and assumes no liability as to the accuracy or completeness of the information provided, nor any loss arising from any investment based on a recommendation, forecast or any information supplied by any third-party.

GBPUSD up!!!this is quite a simple trade plan overall, price action seems bullish, trendline is intact which is another confluence in this situation the ideal trade setup would be when the price hit the trendline at that time look for buy setups on 1hr or shorter tfs

Strong sell area Reached our level
Same move as we predicted in our last idea
Now time arrived to change the trend

Possible movement of the pound/dollarIn my opinion, the cable move could be a deep correction in the ascending channel. Therefore, it can be expected to present buyers with a serious challenge along the way.