GBPUSD SHORT POSITION I think the price could go down from this range because I think this is a key point.
USDGBP trade ideas

GBP/USD💰Symbol: { GBP/USD }
🟩Price: { 1.34581 }
🟥Stop: { 1.34215 }
1️⃣profit: { 1.34835 }
2️⃣profit: { 1.35216 }
3️⃣profit: { 1.35719 }
📊Check your chart before entering.
🚨Check before use to make sure there is no important news.🚨

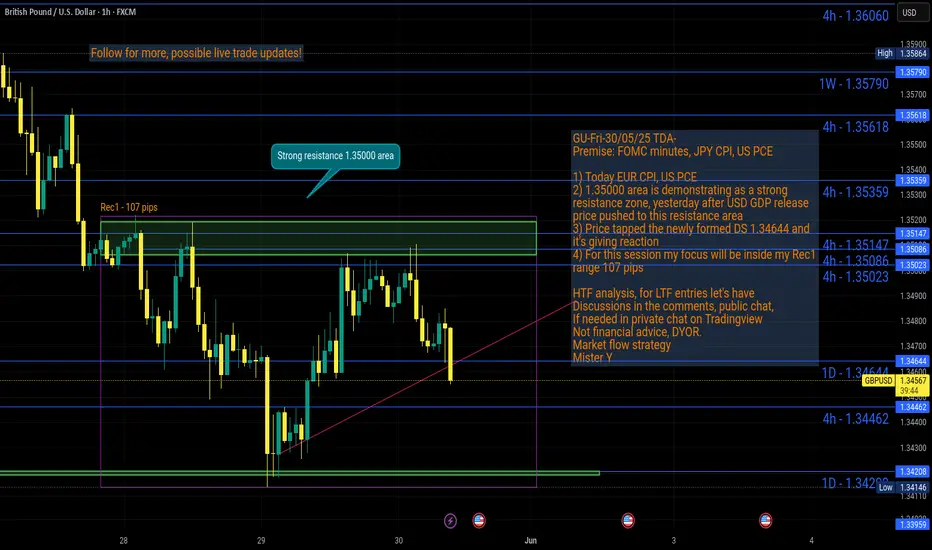
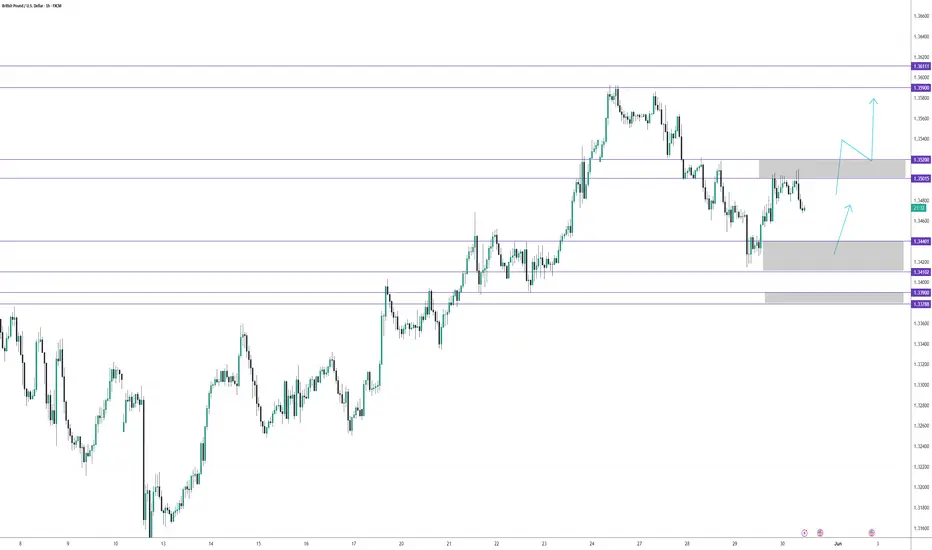
GU-Fri-30/05/25 TDA-Strong resistance 1.35000 zone! Analysis done directly on the chart
Follow for more, possible live trades update!
I trade zone to zone, from support to resistance,
and vice versa. Once I see price entering my
zone of interest, I see how candle reacts to the
level.
Not financial advice, DYOR.
Market Flow Strategy
Mister Y
Correction The correction is expected to end at the current support level and the start of an uptrend is expected.
If the price breaks through the 78.6% level, a continuation of the downtrend is likely.

Inducement has been swept Here is a buy trade on Gbpusd , and my inducement just got cleared out so it's a positive buy for me

Falling towards 61.8% Fibonacci support?The Cable (GBP/USD) is falling towards the pivot, which serves as pullback support and could bounce to the 1st resistance, which acts as pullback resistance.
Pivot: 1.3315
1st Support: 1.3159
1st Resistance: 1.3586
Risk Warning:
Trading Forex and CFDs carries a high level of risk to your capital and you should only trade with money you can afford to lose. Trading Forex and CFDs may not be suitable for all investors, so please ensure that you fully understand the risks involved and seek independent advice if necessary.
Disclaimer:
The above opinions given constitute general market commentary, and do not constitute the opinion or advice of IC Markets or any form of personal or investment advice.
Any opinions, news, research, analyses, prices, other information, or links to third-party sites contained on this website are provided on an "as-is" basis, are intended only to be informative, is not an advice nor a recommendation, nor research, or a record of our trading prices, or an offer of, or solicitation for a transaction in any financial instrument and thus should not be treated as such. The information provided does not involve any specific investment objectives, financial situation and needs of any specific person who may receive it. Please be aware, that past performance is not a reliable indicator of future performance and/or results. Past Performance or Forward-looking scenarios based upon the reasonable beliefs of the third-party provider are not a guarantee of future performance. Actual results may differ materially from those anticipated in forward-looking or past performance statements. IC Markets makes no representation or warranty and assumes no liability as to the accuracy or completeness of the information provided, nor any loss arising from any investment based on a recommendation, forecast or any information supplied by any third-party.

GBP/USD H1 Multiple Trade ScenariosScenario A: Bullish Pullback (Preferred)
Entry: Buy 1.341–1.344 on a clear bullish rejection candle
Stop-Loss: 1.338 (below the recent higher-low)
Take-Profit:
TP1: 1.352 (first resistance/lower-high)
TP2: 1.360 (recent swing-high)
Scenario B: Breakout Play
Trigger: H1 candle closes above 1.352
Entry: Long on a retest of 1.352 as new support
Stop-Loss: 1.350
Take-Profit: 1.361–1.365 (measured extension above the prior high)
Scenario C: Counter-Trend Short
Zone: 1.350–1.352 resistance area
Entry: Short on a bearish rejection candle up in that zone
Stop-Loss: 1.353
Take-Profit:
Target: 1.344 (minor support)
Extended: 1.341 (higher-low area)

GBPUSD M15 | Bearish Drop Based on the M15 chart, the price is approaching our sell entry level at 1.3486, a pullback resistance that aligns close to the 50% Fibo retracement.
Our take profit is set at 1.3448, a pullback support.
The stop loss is set at 1.3520, an overlap resistance.
High Risk Investment Warning
Trading Forex/CFDs on margin carries a high level of risk and may not be suitable for all investors. Leverage can work against you.
Stratos Markets Limited (tradu.com ):
CFDs are complex instruments and come with a high risk of losing money rapidly due to leverage. 63% of retail investor accounts lose money when trading CFDs with this provider. You should consider whether you understand how CFDs work and whether you can afford to take the high risk of losing your money.
Stratos Europe Ltd (tradu.com ):
CFDs are complex instruments and come with a high risk of losing money rapidly due to leverage. 63% of retail investor accounts lose money when trading CFDs with this provider. You should consider whether you understand how CFDs work and whether you can afford to take the high risk of losing your money.
Stratos Global LLC (tradu.com ):
Losses can exceed deposits.
Please be advised that the information presented on TradingView is provided to Tradu (‘Company’, ‘we’) by a third-party provider (‘TFA Global Pte Ltd’). Please be reminded that you are solely responsible for the trading decisions on your account. There is a very high degree of risk involved in trading. Any information and/or content is intended entirely for research, educational and informational purposes only and does not constitute investment or consultation advice or investment strategy. The information is not tailored to the investment needs of any specific person and therefore does not involve a consideration of any of the investment objectives, financial situation or needs of any viewer that may receive it. Kindly also note that past performance is not a reliable indicator of future results. Actual results may differ materially from those anticipated in forward-looking or past performance statements. We assume no liability as to the accuracy or completeness of any of the information and/or content provided herein and the Company cannot be held responsible for any omission, mistake nor for any loss or damage including without limitation to any loss of profit which may arise from reliance on any information supplied by TFA Global Pte Ltd.
The speaker(s) is neither an employee, agent nor representative of Tradu and is therefore acting independently. The opinions given are their own, constitute general market commentary, and do not constitute the opinion or advice of Tradu or any form of personal or investment advice. Tradu neither endorses nor guarantees offerings of third-party speakers, nor is Tradu responsible for the content, veracity or opinions of third-party speakers, presenters or participants.

OMH or peaked already... let me know your thoughts :)So we are at a potential reversal situation.
I'lll try to update my idea in the next days, but this is what I've got at the moment.
There's room for OMH, but if you're playing it safe, I'm shorting from now, and then if this changes, I may consider hedging for some small play win, but otherwise my target is down for the mid term movement.
Thoughts?

Relative Equal HighsThere is a tone of liquidity up there and we are shaping up for the 2nd leg up on the buy side of the curve.

GBPUSD - SO MANY BULLISH SIGNS ! confirmed TPs HIT GBPUSD- Market is moving in a Bullish Channel since long. Market has formed Bullish continuation pattern and that's how we can predict a projection of TPs which is also well within a channel. Market has also retraced and bounced back from the FIB LEVEL of 0.382 which is also a good support level followed by the 3 white soldiers pattern.
ENTRY POINT & STOPLOSS with TPs :
we plan entry on the break out of resistance level (market has instant entry point) which is break of HH and keeping our SL below the HL / FIB 0.382 level or the resistance level.

GBP-USD Swing Long! Buy!
Hello,Traders!
GBP-USD is trading in an
Uptrend and the pair made
A retest of the horizontal
Support of 1.3419 from where
We are already seeing a
Bullish rebound so we will be
Expecting a further
Bullish move up
Buy!
Comment and subscribe to help us grow!
Check out other forecasts below too!
Disclosure: I am part of Trade Nation's Influencer program and receive a monthly fee for using their TradingView charts in my analysis.

Bullish Retracement Price expands to the up-side creating a shift in market structure
DXY is bearish meaning a push to the up-side is possible
Breaker Block identified and used as entry
the Low of the Breaker Block for stops
Aiming for opposing liquidity

CHECK GBPUSD SIGNAL READ CAPTAIN(gbpusd )sell zone
( TRADE SATUP)
ENTRY POINT (1.35100) to (1.35000) 📊
FIRST TP (1.34700)
2ND TARGET (1.34300) 📊
LAST TARGET (1.33850) 📊
STOP LOOS (1.35500)❌

Market next move 🔻 Potential Disruptions to the Bullish Scenario:
1. False Breakout Risk at the Resistance Zone
The price is hovering near a horizontal resistance zone (red box).
Repeated wicks at this level suggest selling pressure.
If price breaks above slightly and then pulls back inside the range, it could be a bull trap, triggering a sharp drop (red arrow).
2. Weak Follow-Through on Volume
Recent bullish candles show no increase in volume.
This hints at lack of conviction among buyers, increasing the chance of a reversal rather than continuation.
3. Bearish Divergence Possibility
If we applied RSI or MACD here, there’s a high chance of bearish divergence forming (price making higher highs, while indicators show lower highs), signaling potential reversal pressure.
4. Upcoming U.S. News Events
U.S. economic announcements (indicated by icons) could strengthen the USD, causing GBP/USD to drop suddenly despite the bullish technical structure.
5. Bearish Candlestick Pattern Forming
If the current or next candle closes as a shooting star, evening star, or bearish engulfing, it would be a classic reversal pattern from resistance.
6. Liquidity Grab Above Highs
Market makers may push the price above resistance to trigger stop-losses and induce longs, then reverse—classic liquidity hunt scenario.

CHECK GBPUSD READ CAPTAIN GBPUSD Sell zone limit
TRADE
Entry ponit 1.35045
Take profit Target 1.34250
Stop loss 1.35222
Follow money Menagment

Sterling Holds Ahead of U.S. GDPGBP/USD trades near 1.3435 on Thursday, pressured by a stronger US Dollar after a court blocked Trump’s “Liberation Day” tariffs, ruling he lacked authority to impose them. Markets now await preliminary US Q1 GDP data. Fed minutes showed rising uncertainty, with policymakers favoring a cautious, steady rate path. In the UK, food inflation rose for a fourth month, prompting Barclays to delay its rate cut forecast to February 2026, which may support the Pound.
The first critical support for gold is seen at 1.3425 and the first resistance is located at 1.3600.

GBPUSD Analysis Today: Technical and Order Flow !In this video I will be sharing my GBPUSD analysis today, by providing my complete technical and order flow analysis, so you can watch it to possibly improve your forex trading skillset. The video is structured in 3 parts, first I will be performing my complete technical analysis, then I will be moving to the COT data analysis, so how the big payers in market are moving their orders, and to do this I will be using my customized proprietary software and then I will be putting together these two different types of analysis.

GBPUSD Next move read our Caption GBP/USD is currently trading around the 1.34700 mark. If the price moves up to retest the resistance at 1.35200, it may face selling pressure. Should this level hold as resistance, we could expect a bearish reversal leading to a decline toward the next key support at 1.34210 and also 1.33600 lets could see how the price plays out .
Wait for a clear rejection or bearish confirmation at 1.35200 before entering a short trade.
you can search more details in the chart give me like and comments for more analysis Thanks.

GBP/USD – Correction in Progress - Where to buy?A few days ago, I pointed out that GBP/USD broke above key resistance from above 1.34, and even cleared the psychological barrier at 1.35.
That breakout opened the door for a potential move toward 1.4000, and I suggested that traders should look for buying opportunities on pullbacks.
Well — we’re in that pullback now.
So, where do we buy?
📍 The most obvious area is the old resistance around 1.3430. But here’s the catch:
GBP/USD is notorious for fakeouts and spikes.
If price tests that level, it could easily dip under 1.34, take out stops, and only then reverse to the upside.
🛡️ Bottom line: If you’re buying the dip, set your stop-loss wisely
Disclosure: I am part of Trade Nation's Influencer program and receive a monthly fee for using their TradingView charts in my analyses and educational articles.

GBPUSD corrective pullback supported at 1.3400The GBP/USD currency pair maintains a bullish sentiment, supported by a rising trendline and sustained higher lows. The recent intraday price action suggests a corrective pullback within an overall uptrend, indicative of a consolidation phase rather than a reversal.
Key Support Level: 1.3400
This level aligns with a previous consolidation zone and is acting as a pivotal support. A pullback toward this level could offer a potential buying opportunity, especially if bullish momentum returns.
Upside Targets (on bullish continuation from 1.3400):
1.3515 – Initial resistance from prior swing high
1.3580 – Intermediate resistance level
1.3630 – Long-term target and potential top of the current bullish channel
Bearish Scenario (if 1.3400 fails):
A daily close below 1.3400 would invalidate the current bullish setup, signaling a potential shift in trend. In that case:
Immediate support at 1.3360
Deeper retracement could extend to 1.3310
Conclusion
The broader trend in GBP/USD remains bullish, with the current consolidation viewed as a potential pullback rather than a reversal. The 1.3400 level is critical — a bounce from here could resume the uptrend toward 1.3630 over time. However, a break and close below 1.3400 would weaken the bullish case and open the door to further downside. Traders should monitor price action closely around this key level for confirmation.
This communication is for informational purposes only and should not be viewed as any form of recommendation as to a particular course of action or as investment advice. It is not intended as an offer or solicitation for the purchase or sale of any financial instrument or as an official confirmation of any transaction. Opinions, estimates and assumptions expressed herein are made as of the date of this communication and are subject to change without notice. This communication has been prepared based upon information, including market prices, data and other information, believed to be reliable; however, Trade Nation does not warrant its completeness or accuracy. All market prices and market data contained in or attached to this communication are indicative and subject to change without notice.

The Day AheadKey Economic Data
US Q1 GDP (2nd estimate)
Critical gauge of US economic strength. A stronger print supports the USD and Treasury yields; a weaker print could increase rate cut expectations.
US Initial Jobless Claims
Weekly labor market barometer. Higher claims may signal softening employment, boosting rate cut speculation.
US April Pending Home Sales
Forward-looking housing data. Affects homebuilder stocks and rate-sensitive sectors.
Japan May Consumer Confidence Index
Influences JPY and Nikkei futures. A strong number supports risk sentiment in Asia.
Italy May Consumer & Manufacturing Confidence, March Industrial Sales
Could affect EUR and European equity indexes, especially if significantly diverging from consensus.
Canada Q1 Current Account Balance
Impacts CAD. A stronger balance may support CAD crosses; relevant for BoC watchers.
Central Bank Activity
Fed Speakers: Barkin, Goolsbee, Daly
Market-sensitive remarks possible, especially around inflation, labor market, and rate path.
Key for interpreting near-term FOMC expectations.
Earnings Reports
Major reports: Costco, Royal Bank of Canada, Dell, Marvell, Zscaler, Gap
These span retail, finance, tech, and cybersecurity.
Potentially high-impact for:
Retail sentiment (Costco, Gap)
Tech momentum (Dell, Marvell, Zscaler)
Financial sector positioning (Royal Bank of Canada)
Bond Market
US 7-Year Treasury Note Auction
Important for yield curve positioning.
Weak demand may steepen the curve; strong demand could support duration plays.
Trading Takeaways
Macro setup: GDP + claims = key risk barometer for USD and yields.
Volatility catalyst: Earnings after-hours may drive post-market Nasdaq and futures volatility.
Bond traders: Watch auction tail and bid metrics closely; implications for near-term Treasury direction.
This communication is for informational purposes only and should not be viewed as any form of recommendation as to a particular course of action or as investment advice. It is not intended as an offer or solicitation for the purchase or sale of any financial instrument or as an official confirmation of any transaction. Opinions, estimates and assumptions expressed herein are made as of the date of this communication and are subject to change without notice. This communication has been prepared based upon information, including market prices, data and other information, believed to be reliable; however, Trade Nation does not warrant its completeness or accuracy. All market prices and market data contained in or attached to this communication are indicative and subject to change without notice.
