GBPUSD buy opportunity It is time to buy GBPUSD with 1% risk. it is coming from a strong support area and nice rejection as well.
USDGBP trade ideas

GBPUSD: Bullish Continuation Ahead.The GBPUSD has established a typical bullish trend following pattern.
Following a significant upward movement, the price entered a correction phase within a bullish flag.
Breaking above the resistance line serves as a strong indicator of continued upward momentum.
I anticipate that the pair could reach the 1.3800 level.

Bearish drop for the Cable?The price is rising towards the pivot and could drop to the 1st support which is a pullback support.
Pivot: 1.3632
1st Support: 1.3503
1st Resistance: 1.3693
Risk Warning:
Trading Forex and CFDs carries a high level of risk to your capital and you should only trade with money you can afford to lose. Trading Forex and CFDs may not be suitable for all investors, so please ensure that you fully understand the risks involved and seek independent advice if necessary.
Disclaimer:
The above opinions given constitute general market commentary, and do not constitute the opinion or advice of IC Markets or any form of personal or investment advice.
Any opinions, news, research, analyses, prices, other information, or links to third-party sites contained on this website are provided on an "as-is" basis, are intended only to be informative, is not an advice nor a recommendation, nor research, or a record of our trading prices, or an offer of, or solicitation for a transaction in any financial instrument and thus should not be treated as such. The information provided does not involve any specific investment objectives, financial situation and needs of any specific person who may receive it. Please be aware, that past performance is not a reliable indicator of future performance and/or results. Past Performance or Forward-looking scenarios based upon the reasonable beliefs of the third-party provider are not a guarantee of future performance. Actual results may differ materially from those anticipated in forward-looking or past performance statements. IC Markets makes no representation or warranty and assumes no liability as to the accuracy or completeness of the information provided, nor any loss arising from any investment based on a recommendation, forecast or any information supplied by any third-party.

Cable H4 | Pullback at 61.8% Fibonacci retracementCable (GBP/USD) is falling towards a pullback support and could potentially bounce off this level to climb higher.
Buy entry is at 1.3533 which is a pullback support that aligns with the 61.8% Fibonacci retracement.
Stop loss is at 1.3490 which is a level that lies underneath a pullback support.
Take profit is at 1.3612 which is a swing-high resistance that aligns closely with the 38.2% Fibonacci retracement.
High Risk Investment Warning
Trading Forex/CFDs on margin carries a high level of risk and may not be suitable for all investors. Leverage can work against you.
Stratos Markets Limited (tradu.com ):
CFDs are complex instruments and come with a high risk of losing money rapidly due to leverage. 63% of retail investor accounts lose money when trading CFDs with this provider. You should consider whether you understand how CFDs work and whether you can afford to take the high risk of losing your money.
Stratos Europe Ltd (tradu.com ):
CFDs are complex instruments and come with a high risk of losing money rapidly due to leverage. 63% of retail investor accounts lose money when trading CFDs with this provider. You should consider whether you understand how CFDs work and whether you can afford to take the high risk of losing your money.
Stratos Global LLC (tradu.com ):
Losses can exceed deposits.
Please be advised that the information presented on TradingView is provided to Tradu (‘Company’, ‘we’) by a third-party provider (‘TFA Global Pte Ltd’). Please be reminded that you are solely responsible for the trading decisions on your account. There is a very high degree of risk involved in trading. Any information and/or content is intended entirely for research, educational and informational purposes only and does not constitute investment or consultation advice or investment strategy. The information is not tailored to the investment needs of any specific person and therefore does not involve a consideration of any of the investment objectives, financial situation or needs of any viewer that may receive it. Kindly also note that past performance is not a reliable indicator of future results. Actual results may differ materially from those anticipated in forward-looking or past performance statements. We assume no liability as to the accuracy or completeness of any of the information and/or content provided herein and the Company cannot be held responsible for any omission, mistake nor for any loss or damage including without limitation to any loss of profit which may arise from reliance on any information supplied by TFA Global Pte Ltd.
The speaker(s) is neither an employee, agent nor representative of Tradu and is therefore acting independently. The opinions given are their own, constitute general market commentary, and do not constitute the opinion or advice of Tradu or any form of personal or investment advice. Tradu neither endorses nor guarantees offerings of third-party speakers, nor is Tradu responsible for the content, veracity or opinions of third-party speakers, presenters or participants.

A Good Trade & An Even Better Trading LessonA good trading idea on the GBPUSD, looking at a potential bearish trend continuation trade using a breakout & pullback technique. But an even better trading lesson on the importance of having rules for how to analyze the market so that you can avoid confusion and/or conflicting signals.
If you have any questions or comments please leave them below.
Akil

GBPUSD I Daily CLS I Model 1 KL FVG + SMTYo Market Warriors ⚔️
Fresh outlook drop — if you’ve been riding with me, you already know:
🎯My system is 100% mechanical. No emotions. No trend lines. No subjective guessing. Just precision, structure, and sniper entries.
🧠 What’s CLS?
It’s the real smart money. The invisible hand behind $7T/day — banks, algos, central players.
📍Model 1:
HTF bias based on the daily and weekly candles closes,
Wait for CLS candle to be created and manipulated. Switch to correct LTF and spot CIOD. Enter and target 50% of the CLS candle.
For high probability include Dealing Ranges, Weekly Profiles and CLS Timing.
Trading is like a sport. If you consistently practice you can learn it.
“Adapt what is useful. Reject whats useless and add whats is specifically yours.”
David Perk aka Dave FX Hunter
💬 Don't hesitate to ask any questions or share your opinions

GBP/USD Outlook: Can Buyers Step Back In?Hi everyone,
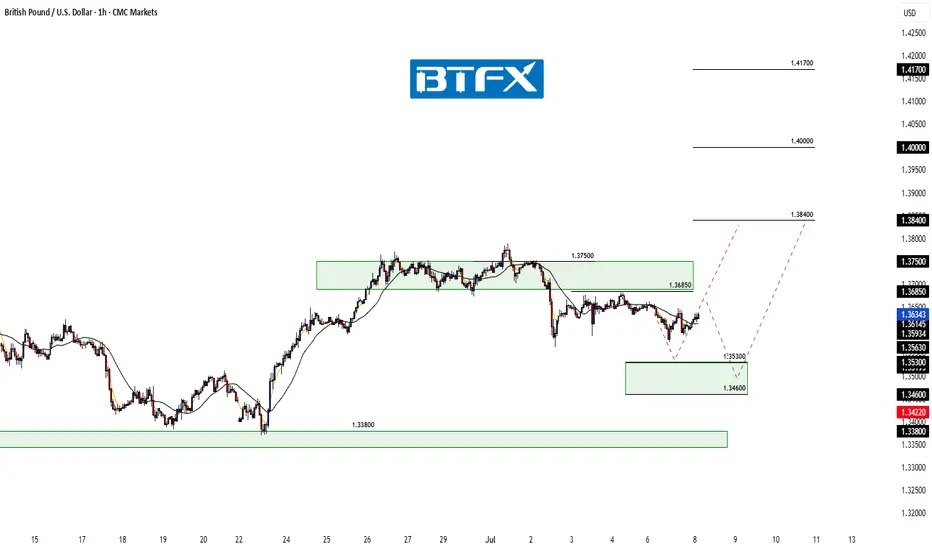
GBP/USD continues to consolidate below the 1.36200 level, with multiple failed attempts to break higher confirming this area as firm resistance for now. Following the rejection, price moved lower into the 1.35300–1.34600 demand zone, where we’re watching closely for signs of renewed buying interest.
This area has previously acted as a support base, and a reaction here could set the stage for another push higher. However, if buyers fail to step in, there is scope for a deeper retracement before the next attempt to reclaim resistance. We’ll be monitoring the price action closely to see which scenario plays out.
A drop into this area was highlighted as the more probable short‑term path, and we’re now looking for GBP/USD to find support in this region; and more importantly, to hold above the 1.33800 level to form the base for another push higher.
As previously noted, a decisive break above 1.37500 would renew our expectation for further upside, with the next key target around 1.38400. We'll be monitoring price action closely to see how it unfolds.
We’ll continue to provide updates on the projected path for GBP/USD as price approaches this target.
The longer-term outlook remains bullish, and we expect the rally to continue extending further from the 1.20991 January low towards 1.40000 and 1.417000.
We’ll be keeping you updated throughout the week with how we’re managing our active ideas. Thanks again for all the likes/boosts, comments and follows — we appreciate the support!
All the best for the week ahead. Trade safe.
BluetonaFX

SELL GBPUSD for bullish divergence trend reversal STOP LOSS: 1.3SELL GBPUSD for bullish divergence trend reversal STOP LOSS: 1.3622
Regular Bearish Divergence
In case of Regular Bearish Divergence:
* The Indicator shows Lower Highs
* Actual Market Price shows Higher Highs
We can see a strong divergence on the MACD already and There is a strong trend reversal on the daily time frame chart.....
The daily time frame is showing strength of trend reversal from this level resistance so we are looking for the trend reversal and correction push from here .....
TAKE PROFIT: take profit will be when the trend comes to an end, feel from to send me a direct DM if you have any question about take profit or anything
Remember to risk only what you are comfortable with........trading with the trend, patient and good risk management is the key to success here...

GBP/USD : First Long, Then SHORT! (READ THE CAPTION)By analyzing the GBP/USD chart on the 4-hour timeframe, we can see that the price is currently trading around 1.3625. I expect a new Fair Value Gap (FVG), formed by the recent sharp drop, to be filled soon.
The first target for this potential move is 1.3650, with the next bullish zone between 1.3670 and 1.3730.
Supply and demand zones are marked on the chart — keep a close eye on how the price reacts to these key levels!
Please support me with your likes and comments to motivate me to share more analysis with you and share your opinion about the possible trend of this chart with me !
Best Regards , Arman Shaban

GBPUSD Short idea! Yes, we're bullish on the Daily timeframe. This is a continuation of the 4H bearish pullback. For me, we're not far enough into the discount leg of the daily swing. I'd like to see some of those hefty imbalances get filled first.
Risky, given that we've only wicked that recent 4H swing low, so waiting for 15m confirmation within that 1H extreme OB. Targeting the 4H swing low for a 2.5RR.
We could switch up, and rally up now, but the DXY is showing some more potential upside strength in the short term. So, this aligns well with my notion of more GBP downside, ahead of the next rally up!

short idea!hi all. after hitting to a WA and reversing, market needs an LOZ to go lower more. be careful and use your conformation before entering. be happy(wink)

we wait patiently while eating graduallycheck my previous post to see a comprehensive explanation of why i took this trade in the first place

DeGRAM | GBPUSD forming the falling wedge📊 Technical Analysis
● Price is testing the rising-channel floor (≈1.3500) while carving a bullish falling-wedge; momentum divergence and prior green arrows hint buyers defend this rail.
● A break of 1.3590 (wedge roof / minor trendline) would confirm reversal, opening 1.3680 mid-band, with 1.3770 channel cap next. Risk is limited to a clean H4 close beneath 1.3450.
💡 Fundamental Analysis
● Softer US CPI trimmed two-year Treasury yields, eroding the dollar bid, while UK May GDP surprised to the upside and labour-market tightness keeps BoE “higher for longer” talk alive—narrowing the rate-gap that had weighed on sterling.
✨ Summary
Long 1.3500-1.3560; breakout above 1.3590 targets 1.3680 → 1.3770. Invalidate on H4 close under 1.3450.
-------------------
Share your opinion in the comments and support the idea with a like. Thanks for your support!

GBPUSD - 2 potential selling opportunitiesLooking at GBPUSD
We have 2 potential selling POI's.
The first one being a point in which we will need to sit on our hands for a little bit to see what price does at there is no inducement in the push down in the impulse leg. With that being the case we will need to see some sort of inducement built before we enter that POI
IF we clear the first POI I think I will take a more aggressive entry on the secondary POI that sits a little bit higher. This is due to us having already put in some sort of liquidity in and around that POI before pushing lower.
Will wait and see what happens.
Tomorrow could be a very good trading day

sell gbpusdAs noted there we are in a downtrend as price is breaking lows and forming lower lows but looking at weekly we are currently bullish having a retracement meaning this is a counter trend following the retracement no high has been broken to continue the trend and i see ssl liquidity swept on ltf waiting for trans and reteracement to my liquidity area to take sells but if no tr no trade
GBPUSD - at ultimate region? Pound long??#GBPUSD... market reached at his ultimate region that is around 1.3450 to 1.3480
Keep close and don't hold shorts until holds.
Good luck
Trade wisely

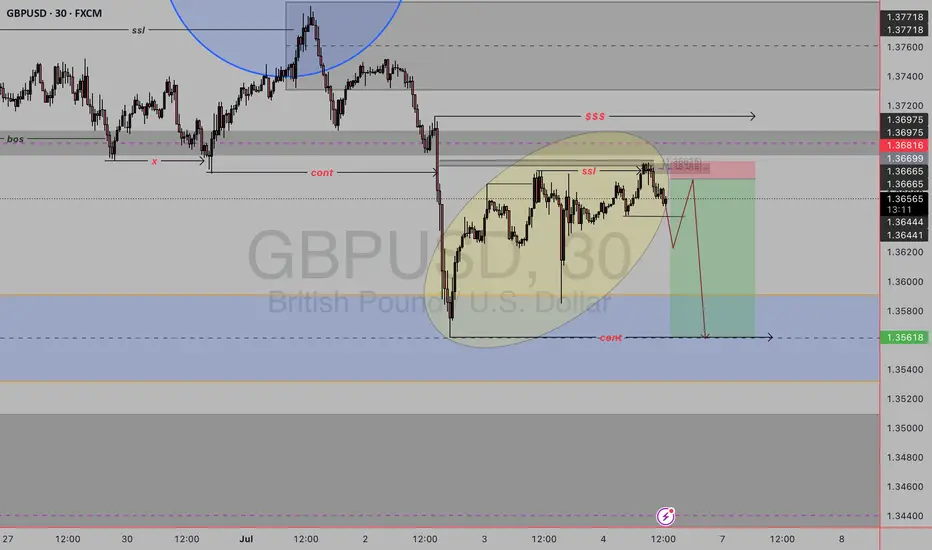
GBPUSDThe market structure on GBPUSD shows a clear liquidity sweep above recent highs, followed by a market structure shift (MSS) to the downside, signaling a potential reversal. After the liquidity grab, price failed to sustain above the swept highs and started to form lower highs.
The RSI indicator also confirms a bearish divergence, strengthening the bearish bias. Currently, price is consolidating below the MSS level, which could act as a supply zone on any retest.
A strong bearish continuation is expected, targeting the SSL (Sell-side Liquidity) level marked below, which aligns with a potential demand zone from late June. The bearish projection suggests a move toward the 1.3350–1.3400 area.
This setup favors short opportunities on lower timeframe pullbacks, maintaining a bearish outlook as long as the price remains below the MSS.

GBPUSDGBPUSD also needs one more push up once the correction is completed. Correction needs more time, perhaps this week drop and next week more upside.
Disclosure: We are part of Trade Nation's Influencer program and receive a monthly fee for using their TradingView charts in our analysis.

GBPUSD Expected Growth! BUY!
My dear friends,
GBPUSD looks like it will make a good move, and here are the details:
The market is trading on 1.3557 pivot level.
Bias - Bullish
Technical Indicators: Supper Trend generates a clear long signal while Pivot Point HL is currently determining the overall Bullish trend of the market.
Goal - 1.3657
Recommended Stop Loss - 1.3503
About Used Indicators:
Pivot points are a great way to identify areas of support and resistance, but they work best when combined with other kinds of technical analysis
Disclosure: I am part of Trade Nation's Influencer program and receive a monthly fee for using their TradingView charts in my analysis.
———————————
WISH YOU ALL LUCK

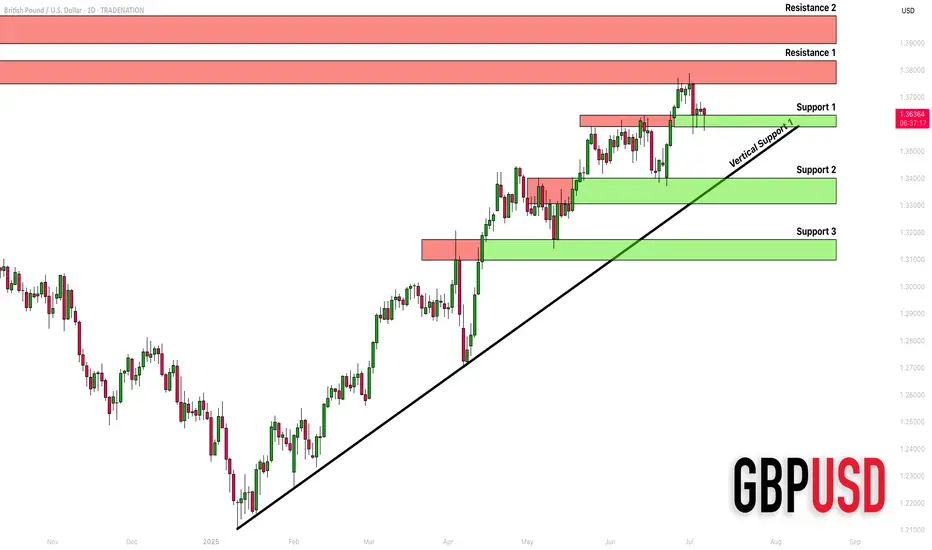
GBPUSD: Detailed Support & Resistance Analysis 🇬🇧🇺🇸
Here is my structure analysis for GBPUSD.
Horizontal Structures
Support 1: 1.3588 - 1.3633 area
Support 2: 1.3305 - 1.3400 area
Support 3: 1.3097 - 1.3175 area
Resistance 1: 1.3748 - 1.3835 area
Resistance 2: 1.3900 - 1.3400 area
Vertical Structures
Vertical Support 1: rising trend line
Consider these structures for pullback/breakout trading.
❤️Please, support my work with like, thank you!❤️
I am part of Trade Nation's Influencer program and receive a monthly fee for using their TradingView charts in my analysis.
GBPUSD set for a move lower?Table is set! The GBPUSD is in a rising wedge, with the test (today) of the 61.8% Fibonacci level once again and now ascending wedge support and horizontal support as well. A break of the 1.3530 would put the 1.3440 breakout point (high from Sept 2024) and a possible breakdown back below the 1.3370 level. Bulls should be cautious with this technical setup.

GBP/USD: Short‑Term Pullback Likely Before Fresh Upside AttemptHi everyone,
GBP/USD continues to consolidate below the 1.36850 level. We expect a retest of this level today; should price fail to break above, we anticipate a move lower to find buying interest between the 1.35300 and 1.34600 zones. A drop into this area appears to be the more probable short‑term path and could set the stage for another push higher.
As previously noted, a decisive break above 1.37500 would renew our expectation for further upside, with the next key target around 1.38400. We'll be monitoring price action closely to see how it unfolds.
We’ll continue to provide updates on the projected path for GBP/USD as price approaches this target.
The longer-term outlook remains bullish, and we expect the rally to continue extending further from the 1.20991 January low towards 1.40000 and 1.417000.
We’ll be keeping you updated throughout the week with how we’re managing our active ideas. Thanks again for all the likes/boosts, comments and follows — we appreciate the support!
All the best for the week ahead. Trade safe.
BluetonaFX
GBP/USD Made A Double Top Pattern , Short After Breakout ? Here is my opinion on GBP/USD 4H Chart , we have a reversal pattern ( Double Top ) but until now we have not a closure below neckline ,so i`m waiting for 4H Closure below it to confirm the pattern and hen we can sell it , if we have not a closure below then this idea will not be valid .
