ARE SHORTS STILL ON? YES. GBPUSD SHORT FORECAST Q2 W21 D22 Y25GBPUSD SHORT FORECAST Q2 W21 D22 Y25
ARE SHORTS STILL ON? YES. GBPUSD SHORT FORECAST Q2 W21 D22 Y25
BEST PRICE TO SHORT GBPUSD...BUT BE CAREFUL, AWAIT BREAKS OF STRUCTURE TO CONFIRM BEARISH INTENT
Professional Risk Managers👋
Welcome back to another FRGNT chart update📈
Diving into some Forex setups using predominantly higher time frame order blocks alongside confirmation breaks of structure.
Let’s see what price action is telling us today!
💡Here are some trade confluences📝
✅Weekly order block rejection
✅Daily order block rejection
✅Intraday 15' order blocks
✅Tokyo ranges to be filled
🔑 Remember, to participate in trading comes always with a degree of risk, therefore as professional risk managers it remains vital that we stick to our risk management plan as well as our trading strategies.
📈The rest, we leave to the balance of probabilities.
💡Fail to plan. Plan to fail.
🏆It has always been that simple.
❤️Good luck with your trading journey, I shall see you at the very top.
🎯Trade consistent, FRGNT X
USDGBP trade ideas


Market next target
Disruption: Bearish Counter-Analysis
1. Rising Wedge Pattern:
The price action resembles a rising wedge, not a bullish channel.
Rising wedges are typically bearish reversal patterns, especially after strong prior bullish moves.
2. Decreasing Volume:
Volume is tapering off as price climbs, which often signals weakening buying pressure.
Lack of strong volume near resistance suggests potential fake-out risk.
3. Bearish Divergence Risk:
Not visible here, but on RSI or MACD, rising price with slowing momentum often triggers bearish divergence.
This could suggest an imminent drop.
4. False Breakout Trap:
The highlighted resistance zone could trap late buyers.
A fake breakout followed by a strong red candle could trigger stop-loss hunts, dragging price sharply lower.
5. Macro Event Warning:
The U.S. flag at the bottom suggests high-impact news is due.
If USD strengthens, GBP/USD may reject the resistance and drop fast, invalidating the long setup.

GBP/USD SELL IDEA (R:R=7)Selling GBP/USD now. Just formed a wonderful butterfly formation on the 4 hour chart. Also, it took out the DAILY D extension yesterday.
Stop Loss: 1.34850
Please move SL to break even when trade is 100+ pips in profit.
Target: 1.30880
Happy Trading! :)

GBPUSD H4 | Bullish Bounce Off Based on the H4 chart analysis, the price is falling toward our buy entry level at 1.3400, a pullback support that aligns with the 38.2% Fibonacci retracement.
Our take profit is set at 1.3568, aligning with the 161.8% Fibonacci extension.
The stop loss is placed at 1.3287, a pullback support.
High Risk Investment Warning
Trading Forex/CFDs on margin carries a high level of risk and may not be suitable for all investors. Leverage can work against you.
Stratos Markets Limited (tradu.com):
CFDs are complex instruments and come with a high risk of losing money rapidly due to leverage. 63% of retail investor accounts lose money when trading CFDs with this provider. You should consider whether you understand how CFDs work and whether you can afford to take the high risk of losing your money.
Stratos Europe Ltd (tradu.com):
CFDs are complex instruments and come with a high risk of losing money rapidly due to leverage. 63% of retail investor accounts lose money when trading CFDs with this provider. You should consider whether you understand how CFDs work and whether you can afford to take the high risk of losing your money.
Stratos Global LLC (tradu.com):
Losses can exceed deposits.
Please be advised that the information presented on TradingView is provided to Tradu (‘Company’, ‘we’) by a third-party provider (‘TFA Global Pte Ltd’). Please be reminded that you are solely responsible for the trading decisions on your account. There is a very high degree of risk involved in trading. Any information and/or content is intended entirely for research, educational and informational purposes only and does not constitute investment or consultation advice or investment strategy. The information is not tailored to the investment needs of any specific person and therefore does not involve a consideration of any of the investment objectives, financial situation or needs of any viewer that may receive it. Kindly also note that past performance is not a reliable indicator of future results. Actual results may differ materially from those anticipated in forward-looking or past performance statements. We assume no liability as to the accuracy or completeness of any of the information and/or content provided herein and the Company cannot be held responsible for any omission, mistake nor for any loss or damage including without limitation to any loss of profit which may arise from reliance on any information supplied by TFA Global Pte Ltd.
The speaker(s) is neither an employee, agent nor representative of Tradu and is therefore acting independently. The opinions given are their own, constitute general market commentary, and do not constitute the opinion or advice of Tradu or any form of personal or investment advice. Tradu neither endorses nor guarantees offerings of third-party speakers, nor is Tradu responsible for the content, veracity or opinions of third-party speakers, presenters or participants.

Chart AnalysisGBP/USD Institutional Bias & Scalping Zones (London-NY Transition)
This chart outlines my active directional bias and high-probability sniper entry zones on GBP/USD.
🔍 Bias: Bullish
H1/H4 structure is bullish with a clean BOS above 1.3440
Price is respecting higher lows and breaking previous internal structure
Momentum is supported by RSI above 60 on both H1 and M15
📍 Key Levels
Buy-side liquidity rests above 1.3465–1.3485 zone
OB and FVG reaction zones marked on M5/M15 for sniper entries
Current price is consolidating just under a sweep zone — expecting expansion toward external liquidity
🎯 Trade Plan
Buy Entry: After sweep + bullish BOS on M1/M5
SL: Below 1.3420
TP1: 1.3475
TP2: 1.3490 (external high)
R:R: 2.5 to 3.5 depending on entry refinement
I will monitor price action during the London and NY opens, adjusting entries based on liquidity grabs and volume shifts. This setup avoids hedging and focuses on clean directional conviction supported by institutional patterns.

GBPUSD Bearish Setup📌 Current Market Structure
Liquidity Sweep + Rejection in Premium Zone:
Price tapped into the major supply zone (red box) sitting above the last high.
Liquidity above previous highs was swept, and now price is rejecting → a classic buy-side liquidity grab setup.
Bearish Rising Wedge Structure Broken:
Price broke the inner rising wedge (red trendlines) to the downside and is now retesting the supply zone.
Breakdown aligns with a potential reversal entry or at least a bearish pullback.
Higher Timeframe Supply Zone:
The red zone coincides with the 1.34782 resistance, which price failed to break cleanly above.
This zone holds institutional footprints → possible smart money distribution.
🧠 Trade Idea (Bearish Bias Confirmed)
✅ Entry: Already activated inside the red supply zone.
📍 Stop Loss: Just above the red box (around 1.3480).
🎯 Target Zones:
TP1: 1.33281 → minor demand zone and previous consolidation.
TP2: 1.32870 → previous BOS retest zone.
TP3: 1.32543 → deep demand zone and trendline intersection.
TP4: 1.31759–1.31554 → external liquidity resting below structure (long-term target).
🔻 Risk-to-Reward: Excellent potential up to 1:5+ RR if TP4 hits.
🔄 Reversal Signals Confirmation
Watch for:
Bearish engulfing candles with rising volume inside the red zone (VSA style).
Displacement candle or M5–M15 BOS confirming internal structure shift.
⚠️ Invalidation Zone
If price closes a 1H candle above 1.3480, setup is invalidated.
Watch out for possible manipulation during the vertical blue lines (likely high-impact news).
🔮 Forecast:
Expecting a mid- to long-term retracement or reversal back to the 1.31700s – 1.32800s region, based on the current rejection from premium supply and completion of a liquidity sweep.

GBPUSD: Will DXY Bounce Back? |GBPUSD Swing Sell|The GBPUSD pair is currently rallying towards a potential selling zone, where sellers could push the price down. However, the main concern is the current state of the DXY, which clearly indicates another sell-off and could lead to another lower low. Please remember to use risk management while trading forex pairs.
There are three take-profit targets that can be set according to your trading plan. This analysis doesn’t guarantee that the price will move as described.
Good luck and trade safely!
Thank you for your unwavering support! 😊
If you’d like to contribute, here are a few ways you can help us:
- Like our ideas
- Comment on our ideas
- Share our ideas
Team Setupsfx_
❤️🚀

GBPUSD I Technical and Fundamental Forecast Welcome back! Let me know your thoughts in the comments!
** GBPUSD Analysis - Listen to video!
We recommend that you keep this pair on your watchlist and enter when the entry criteria of your strategy is met.
Please support this idea with a LIKE and COMMENT if you find it useful and Click "Follow" on our profile if you'd like these trade ideas delivered straight to your email in the future.
Thanks for your continued support!Welcome back! Let me know your thoughts in the comments!

Is GBP/USD's 1.3470 level a top or a new starting point?The GBP/USD pair retreated after hitting a three-year high of 1.3470, trading at 1.3405 during the European session, with daily gains narrowing to 0.1%. Although the hotter-than-expected UK April inflation data sparked concerns about a policy pivot by the Bank of England (BoE), the US dollar remained under pressure due to a sovereign rating downgrade, providing support for the British pound. The market is currently reassessing the divergence in policy paths between the UK and the US. With bullish and bearish factors intertwined, the pound may maintain a high-range consolidation in the short term. In the near term, the 1.33-1.35 range is likely to be the focal point of multi-party and short-party contention. Traders need to closely monitor the UK retail sales data and US PMI data to be released on Friday, as evidence of economic resilience from either side could break the current equilibrium.
In the market, there are no absolutes, and neither upward nor downward trends are set in stone. Therefore, the ability to judge the balance between market gains and losses is your key to success. Let money become our loyal servant.

Pound steady as UK inflation surgesThe British pound posted gains earlier but has failed to consolidate. In the European session, GBP/USD is trading at 1.3395, up 0.03% on the day. The pound has gained 1.1% this week and earlier today rose as high as 1.3468, its highest level since Feb. 2022.
UK inflation jumped to 3.5% y/y in April, up sharply from 2.6% in March and above the market estimate of 3.3%. This was the highest annual inflation rate since Jan. 2024 and was driven by higher prices for transport, housing and energy. Monthly, inflation soared to 1.2%, up from 0.3% and above the market estimate of 1.1%.
The news wasn't much better from core CPI, which rose to 3.8% from 3.4% and was higher than the market estimate of 3.6%. This was the highest reading since April 2024. Monthly, the core rate jumped to 1.4%, up from 0.5% and above the market estimate of 1.2%.
The rise in inflation can be partially attributed to the increase in the energy price cap and the Easter holidays, but is a disappointment for the government and for the Bank of England, as inflation had been trending lower.
The BoE will be concerned by the rise in core inflation, which will complicate plans to further reduce rates. The BoE trimmed the cash rate by a quarter-point earlier this month by 0.25%, but rates are still higher than other major central banks, with the exception of the Federal Reserve.
The Federal Reserve is taking a wait-and-see attitude before it lowers rates again, especially with the uncertainty swirling around US tariff policy. Atlanta Fed President Raphael Bostic said this week that even reduced tariffs would be "definitely economically significant" and said he favored one rate cut this year.

GBPUSD My Opinion! SELL!
My dear followers,
I analysed this chart on GBPUSD and concluded the following:
The market is trading on 1.3427 pivot level.
Bias - Bearish
Technical Indicators: Both Super Trend & Pivot HL indicate a highly probable Bearish continuation.
Target - 1.3356
Safe Stop Loss - 1.3467
About Used Indicators:
A super-trend indicator is plotted on either above or below the closing price to signal a buy or sell. The indicator changes color, based on whether or not you should be buying. If the super-trend indicator moves below the closing price, the indicator turns green, and it signals an entry point or points to buy.
Disclosure: I am part of Trade Nation's Influencer program and receive a monthly fee for using their TradingView charts in my analysis.
———————————
WISH YOU ALL LUCK

GBPUSD: Bearish Order FlowSpread out across multiple days, GBPUSD has been ranging now. Maybe it's time GBPUSD reached the peak of this distribution with this Shark Pattern. Let's see how it plays out.

GBPUSDlets fasten seatbelt another rally coming for buy side i trade beacuse market alredy the buy side

Market next move
Bearish Disruption to GBP/USD Analysis:
1. Support Weakness:
The price action within the red box shows multiple bearish candles, suggesting the zone is under pressure.
A break and close below this box could invalidate the bullish thesis.
2. Exhaustion Signals:
After a sharp rally, the market often consolidates or corrects. The current stall near 1.3400–1.3420 could indicate buying exhaustion.
The latest candle shows a strong bearish push into the support, hinting at potential for deeper decline.
3. Decreasing Volume:
Recent green candles had falling volume, which shows lack of conviction by buyers.
Meanwhile, red (bearish) candles show rising volume, signaling increased selling pressure.
4. Failed Breakout Setup:
If this bounce fails and price closes below 1.3380, this will form a false breakout or bull trap, triggering stop hunts and aggressive shorting.
5. Macroeconomic Headwinds:
GBP is sensitive to UK data and BoE policy. Any hawkish Fed or weak UK numbers may lead to a USD rebound, pushing GBP/USD lower.

GBPUSD – Short Bias in PlayGBPUSD – Short Bias in Play
🔻 Entered short at market open
🎯 Aiming for both levels marked (≈1.34053 & 1.33701)
⏳ Plan to hold days if needed
Price popped into resistance at 1.34424 and has already rolled over. My targets is 1.34054.
📝 Not financial advice—trade responsibly!
💡 All setups are replayable on TradingView for confirmation.
#GBPUSD #Forex #SwingTrade #TradingView #MarketAnalysis


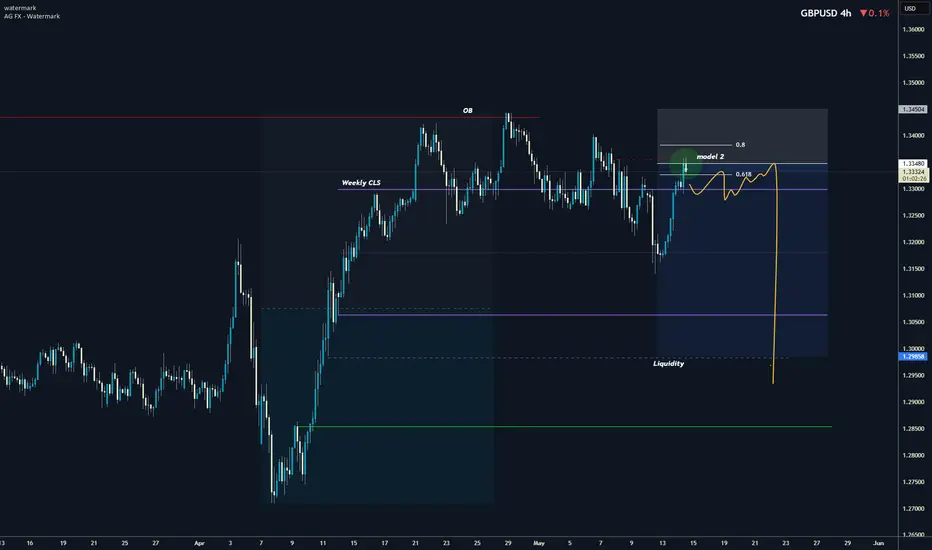
GBPUSD I Weekly CLS I Model 2 Target opposing rangeHey, Market Warriors, here is another outlook on this instrument
If you’ve been following me, you already know every setup you see is built around a CLS range, a Key Level, Liquidity and a specific execution model.
If you haven't followed me yet, start now.
My trading system is completely mechanical — designed to remove emotions, opinions, and impulsive decisions. No messy diagonal lines. No random drawings. Just clarity, structure, and execution.
🧩 What is CLS?
CLS is real smart money — the combined power of major investment banks and central banks moving over 6.5 trillion dollars a day. Understanding their operations is key to markets.
snapshot
✅ Understanding the behaviour of CLS allows you to position yourself with the giants during the market manipulations — leading to buying lows and selling highs - cleaner entries, clearer exits, and consistent profits.
snapshot
🛡️ Models 1 and 2:
From my posts, you can learn two core execution models.
They are the backbone of how I trade and how my students are trained.
📍Model 1
is right after the manipulation of the CLS candle when CIOD occurs, and we are targeting 50% of the CLS range. H4 CLS ranges supported by HTF go straight to the opposing range.
snapshot
📍Model 2
occurs in the specific market sequence when CLS smart money needs to re-accumulate more positions, and we are looking to find a key level around 61.8 fib retracement and target the opposing side of the range.
snapshot
👍 Hit like if you find this analysis helpful, and don't hesitate to comment with your opinions, charts or any questions.
⚔️ Listen Carefully:
Analysis is not trading. Right now, this platform is full of gurus" trying to sell you dreams based on analysis with arrows while they don't even have the skill to trade themselves.
If you’re ever thinking about buying a Trading Course or Signals from anyone. Always demand a verified track record. It takes less than five minutes to connect 3rd third-party verification tool and link to the widget to his signature.
"Adapt what is useful, reject what is useless, and add what is specifically your own."
— David Perk aka Dave FX Hunter ⚔️
GBPUSDBuy. Market Execution. trade 1:2. riesgo 0.50%
I went into buy because the market is respecting the buyers' zone.

GBPUSD Asalamualaikum
GBPUSD Buy:
1. Took a buy entry on the breakout.
2. Price broke above the key level with strong momentum.
3. Market can form a higher low from this level.
4. This makes it a potentially perfect entry point.
5. Looking for bullish continuation if structure holds.

Market Structure Shift Meaning and Use in ICT TradingMarket Structure Shift Meaning and Use in ICT Trading
In ICT (Inner Circle Trader) trading, understanding Market Structure Shifts (MSS) is crucial for accurately interpreting market trends and making informed trading decisions. This article delves into the significance of MSS, its distinct indicators, and how it integrates with other trading elements like Breaks of Structure and Changes of Character.
Understanding Breaks of Structure and Change of Character
Comprehending the dynamics of Breaks of Structure (BOS) and Change of Character (CHoCH) can be crucial for analysing market trends. A Break of Structure occurs when price levels move beyond established support or resistance areas, indicating a potential continuation or acceleration of the current trend. For example, in an uptrend, a BOS is identified when prices break above a previous resistance level, suggesting further upward movement.
Conversely, a Change of Character signifies a possible shift in the market's direction. This occurs when the price action breaks against the prevailing trend, challenging the recent high or low points that served as market barriers. A CHoCH often raises a red flag about the sustainability of the current trend. For instance, in a sustained uptrend, a CHoCH would be marked by a significant downward breach that violates a previous low point, hinting at a weakening of bullish momentum.
Both BOS and CHoCH are pivotal in the ICT (Inner Circle Trader) methodology, where they are used to gauge market sentiment and potential shifts in trend dynamics. Traders monitor these patterns to adjust their strategies, whether to capitalise on the continuation signalled by a BOS or prepare for a trend reversal suggested by a CHoCH.
What Is a Market Structure Shift?
MSS, meaning a Market Structure Shift, is an indicator of a significant change in the prevailing trend, marked by a series of patterns that suggest a reversal is imminent. An ICT MSS is more than a simple Change of Character (CHoCH); it includes additional signals that strengthen the case for a directional change.
The process begins with a shift in market structure that fails to sustain the ongoing trend. For example, during an uptrend, the market might fail to make a new higher high, instead forming a lower high. This initial deviation raises a caution flag about the trend’s strength.
The confirmation of an MSS in trading occurs when there is a decisive break of a significant swing point, accompanied by a strong impulse move that deeply penetrates through this point, known as a displacement. This displacement is critical—it’s not merely a slight breach but a robust move that clearly indicates a shift.
In essence, an MSS signals that the current market momentum has not only paused but is likely reversing. For traders, this is a pivotal moment: the lower highs in an uptrend or the higher lows in a downtrend prior to the break suggest that a new opposite trend is starting to take shape.
How to Use a Market Structure Shift in Trading
An MSS ultimately serves as a directional tool. It helps traders understand when a potential trend reversal is underway, enabling them to align their strategies with the new market direction.
To effectively use an MSS in trading, traders often follow these steps:
- Observing Current Market Structure: They start by analysing the existing trend direction and key price levels. Understand whether the market is in an uptrend, downtrend, or sideways movement by identifying patterns of higher highs and higher lows or lower highs and lower lows.
- Watching for a Break in Key Levels: The core of an MSS is the break of an important high or low, combined with a sharp price movement that breaches a significant swing point (displacement).
- Confirming with News Releases: MSS often coincides with major economic announcements or news releases that can affect market sentiment significantly. For example, if there's a report indicating unexpectedly high US inflation rates, and this correlates with a sharp downward movement in EURUSD, it provides additional confirmation of the MSS. A stronger dollar against the euro, in this case, would signal a clear shift in market direction towards favouring the dollar.
By recognising these elements, traders can more confidently anticipate and adapt to changes in market direction. A well-identified MSS not only indicates a pause in the current trend but also the establishment of a new trend.
Using Market Structure Shifts With Other ICT Components
Using Market Structure Shifts with other Inner Circle Trader methodology components like break of structure, order blocks, and fair value gaps may enhance a trader's ability to interpret and react to market dynamics.
Integrating MSS with ICT Market Structure
An MSS identifies a potential reversal in the market’s direction. When an MSS occurs, it often leads to the formation of a new high-low range in the direction of the new trend. For example, if a bearish MSS results in a new lower high and lower low, traders can watch for a BOS of this range. A retracement back inside of the new range can signal a decent area to search for an entry to ride the trend that’s just beginning.
Utilising Order Blocks and Fair Value Gaps
However, there are scenarios where the price doesn’t establish a new high-low range but instead returns to the area where the original displacement occurred. This displacement often leaves behind a fair value gap and an order block.
- Fair Value Gap: This is a price range that the market skips over quickly during a displacement, leaving it untested by typical market trading. It often acts like a vacuum, drawing the price back to fill in the gap at a later stage.
- Order Block: An order block is typically a consolidation area that precedes a strong price move and is considered a footprint left by institutional traders. It represents levels where significant buying or selling occurred, potentially acting as support or resistance in future price movements.
If the price returns to fill a fair value gap and enters the order block, this scenario can provide a potent setup for a reversal. Traders might look for confirmatory signals at these levels to enter trades that anticipate the market returning to its previous course or extending the reversal initiated by the MSS.
The Bottom Line
The insights provided on MSS and its application within the ICT trading framework can be instrumental for any trader seeking to navigate the complexities of the market effectively. To put these strategies into practice and potentially improve your trading outcomes, practice a lot and learn more about ICT trading.
FAQs
What Is a Market Structure Shift?
A Market Structure Shift (MSS) indicates a potential reversal in market trends, marked initially by a lower high in an uptrend or a higher low in a downtrend, followed by a displacement—a significant and rapid price movement that decisively breaks through a key market level.
How to Identify Market Structure Shift?
Identifying an MSS involves observing for early signs of trend weakening (lower highs or higher lows) and waiting for a subsequent displacement that confirms the shift. This displacement should significantly penetrate a key swing point, clearly indicating a new direction in market momentum.
What Is the ICT Method of Trading?
The ICT (Inner Circle Trader) method of trading is a comprehensive approach that utilises various trading concepts such as market structure, order blocks, and fair value gaps, focusing on how institutional traders influence the market. It emphasises understanding and leveraging these components to align trading strategies with probable market movements.
What Is the Difference Between MSS and BOS in ICT?
In ICT, a Market Structure Shift (MSS) refers to a potential trend reversal, confirmed by a lower high/higher low followed by a displacement. A Break of Structure (BOS), however, simply indicates the continuation or acceleration of the current trend without necessarily suggesting a reversal, marked by the breach of a key high or low point within the ongoing trend direction.
This article represents the opinion of the Companies operating under the FXOpen brand only. It is not to be construed as an offer, solicitation, or recommendation with respect to products and services provided by the Companies operating under the FXOpen brand, nor is it to be considered financial advice.

GBPUSD Longs - Public TradePrice is obviously Bearish on the DXY, expecting a continuation to the upper part of the range on Euro and the Sterling, let's see what unfolds.

GBPUSD SHORTAfter an upward movement price found resistance on major resistance point and currently correcting to the downside. i suggest short position
entry: 1.3401
sl: 1.34696
tp: 1.3318
#technicalanalysis #gbpusd #forex
