USDGBP trade ideas

GBP/USD Is This the Last Dip Before 1.37?🔹 1. Price Action & Technical Structure (Weekly & Daily Charts)
Price has broken above the ascending channel highlighted on the weekly chart.
The 1.3545 area is currently acting as dynamic resistance — a weekly close above it is crucial to confirm a breakout.
Below, we find a bullish order block (demand zone) around 1.3340 – 1.3280, aligning with the 0.5 Fibonacci level.
RSI is neutral, showing no bearish divergence at the moment.
🔹 2. COT Report (Commitment of Traders)
USD Index:
Non-commercial traders: +823 new longs, +363 new shorts → Neutral to bullish positioning.
Commercials remain net short, indicating short-term USD strength potential.
EUR FX (inverse proxy for USD):
Significant reduction in speculative long positions → Less bullish pressure on the Euro, favoring USD strength.
🔹 3. Sentiment
67% of retail traders are short GBP/USD vs. 33% long.
This is a bullish contrarian signal, suggesting potential continuation toward the 1.36–1.37 zone.
🔹 4. Seasonality
Historically, June tends to be bearish for GBP/USD over the past 5–10 years.
However, the first 10 days of the month often start with bullish momentum before correcting in the second half.
🔹 5. Economic Calendar
Today: Construction PMI (GBP), ECB Press Conference (EUR), Unemployment Claims (USD).
Tomorrow: High potential volatility across all USD pairs.
Watch out — upcoming macro data may strongly impact breakout confirmation.
🔹 6. Operational Outlook
Primary Bias: Neutral/Bullish with potential for a technical pullback.
📍 Key Levels:
Resistance: 1.3545 – 1.3593 (Supply zone + 0.0 fib)
Support: 1.3340 – 1.3280 (OB + 0.5/0.618 fib)
🧠 Scenario 1 – Bullish Continuation:
Retest of 1.3340 → long targeting 1.3590 / 1.3680
Confirmation on daily close above 1.3550
🔻 Scenario 2 – Bearish Retracement:
Rejection below 1.3550 + USD macro strength → drop toward 1.3280
If that breaks → extended move to 1.3170 / 1.3150

TopDown Market structure Analysisoverall bullish we may see some retracement before continuin Bullish higher, I see a new HH formed by breakin the previous HH on the weekly timeframe, the 4h timeframe is showin some correction move hence the trendline broken. waitn on monday moves for entry

GbpusdI think we are about to be in a ranging market because when the market failed to continue to give us HL and HH serially but resolve to equal high then and equal low then we are in range market.this are the first thing we must recognize as a trader because we are meant to trade the new leg to form in the market

Doji Retest?Lets See How The Doji Area React When The Price Arrived
Im Still Looking Forward For The Price To Go Up Unless It Broke Some Significant Area
Will Keep An Eye At The Doji Zone

GBP/USD - Weekend analysis, a short opportunity
We begin the analysis on the 30 minute chart, we can see that a 5 point trendline has been broken on Friday, the end of the week. Price never recovered above the trendline by day end and is currently trending down as we can see from the new trendline connecting the closing prices of a few recent candles.
When we zoom in on the chart we can also see that the break of the trendline occurred on high volume, a key signal that we should respect this break and expect a potential significant move to follow.
We can also see on the RSI that price is below 50 which means downside momentum is still present. This is a good opportunity to get in on a short trade and place a stop loss above the trendline that was broken, aiming for a take profit that grants a 1:1.5 RR.

BULLISH The price is aiming for structural liquidity. It tapped on a support level and gave a clear confirmation on the trend reversal (buys).

GBP_USD SWING BREAKOUT|SHORT|
✅GBP_USD was trading in an
Uptrend along the rising support
But now this support is broken
And the breakout is confirmed
So we are bearish biased
And we will be expecting a
Further bearish move down
SHORT🔥
✅Like and subscribe to never miss a new idea!✅
Disclosure: I am part of Trade Nation's Influencer program and receive a monthly fee for using their TradingView charts in my analysis.

GBP/USD Breakdown After Fake Resistance Break | Bearish Targets 📉 GBP/USD Breakdown After Fake Breakout Trap
Price action formed a fake breakout above the recent resistance near 1.35920, trapping late buyers. Shortly after, a clean breakdown below the ascending trendline confirmed a shift in structure. This move suggests smart money manipulation followed by trend continuation.
✅ Current Setup:
Fake Breakout above resistance
Trendline Breakdown + Retest
Short Bias Active
🎯 Bearish Targets:
Target 1: 1.33368
Target 2: 1.32571
🔎 Waiting for price to stay below trendline with lower highs forming on LTFs (lower timeframes) for extra confirmation.
🧠 Note: This analysis is for educational purposes only. Always use proper risk management and follow your own strategy before entering any trade.
#GBPUSD #Forex #SmartMoney #PriceAction #Breakdown #FXAnalysis #TechnicalAnalysis #TradingView

GBP/USD – Bullish Setup Off Key Moving AveragesPair: GBP/USD
Bias: 🔼 Bullish
Entry Level: Current market price (see chart)
Stop Loss: Below recent swing low (see chart for exact level)
Target: Risk-reward of 1:2 or higher, based on structure
---
GBP/USD is showing strong bullish momentum, currently bouncing off the 200-period moving average on the 4H/1H timeframe. This level has acted as dynamic resistance and now appears to be providing support for the next leg up.
In confluence with this, price action is also approaching the 200-period moving average, which I'm using as both a resistance confirmation and an ideal entry zone.
This setup suggests a potential continuation of the prevailing uptrend, supported by bullish market structure and moving average dynamics.
📊 Trade Plan:
Entry: At current price or on a slight pullback to the 200 MA
Stop Loss: Just below the previous swing low to protect against a deeper correction
Take Profit: Using a risk-reward ratio of 1:2 or higher, targeting previous highs or fib extensions
📌 Notes:
Always manage your risk per your trading rules
Confirm with your own strategy or indicators before entering
Watch for key news events (e.g., BOE or Fed announcements)

GBP-USD Local Long! Buy!
Hello,Traders!
GBP-USD made a bearish
Breakout of the rising support
So we are bearish biased mid-term
But locally the pair will soon
Hit a horizontal support
So we will be expecting a
Rebound and a local move up
Buy!
Comment and subscribe to help us grow!
Check out other forecasts below too!
Disclosure: I am part of Trade Nation's Influencer program and receive a monthly fee for using their TradingView charts in my analysis.

GBPUSD - ShortLooking at a key supply area on the higher timeframe of GBPUSD
We now have a structural shift to the downside on the 1H TF that has left an unmitigated OB with a level of inducement.
Pending order will be set on this pair @ 1.35676
We will see how the market plays out around this area
Peace

Cable touches fresh three-year highs above $1.36Cable’s long uptrend, lasting since the start of the year, has continued in June so far with the price reaching a new high on 5 June. Relative political stability in Britain can be contrasted with the USA’s chaotic implementation of new tariffs and friction in the governing Republican party over the tax and spending bill.
The uptrend is quite mature and the price currently overbought while, as for many other major pairs, volume and ATR have declined significantly and Bollinger Bands contracted since April. The obvious long-term target is the area of the 100% monthly Fibonacci retracement, 2021’s high, but even if the uptrend continues that far it’s likely to take a long time for the price to reach this area.
The 50 SMA from Bands is slightly below $1.34, so this seems like a possibly significant support in the short to medium term as both a static and dynamic area. The Fed and BoE will meet on consecutive days on 18 and 19 June, so volatility around then is likely to increase sharply and, depending on the bankers’ comments, it might become clearer whether to expect continuation or consolidation.
This is my personal opinion, not the opinion of Exness. This is not a recommendation to trade.

GBPUSD: Will Keep Growing! Here is Why:
The recent price action on the GBPUSD pair was keeping me on the fence, however, my bias is slowly but surely changing into the bullish one and I think we will see the price go up.
Disclosure: I am part of Trade Nation's Influencer program and receive a monthly fee for using their TradingView charts in my analysis.
❤️ Please, support our work with like & comment! ❤️

GBPUSD: Liquidity Grab & Bearish SentimentThe 📉GBPUSD pair fall below a significant support cluster on the 4-hour chart.
Following this breakout, the previous support has now become a solid resistance level, which is currently being retested.
I observed a confirmed liquidity grab along with a bearish imbalance candle.
There is a strong likelihood that the price will decline to at least 1.3502.

GBPUSD Approaches Key Resistance: Watch for Bearish ReversalGBPUSD pair is trading within a clearly defined ascending channel on the 1-hour chart, showing a short-term bullish structure. However, this bullish move appears corrective within a broader consolidation range capped near the 1.3590 resistance zone.
🔍 Technical Breakdown:
Current Price: 1.35535
Immediate Resistance: 1.35885–1.35929 (previous highs and psychological level)
Support Levels:
Trendline support near 1.3530
Horizontal support: 1.34282, 1.34176
Structure:
Price has formed a bullish flag breakout and is now approaching key resistance.
A new higher high is anticipated toward 1.3590, but this level has repeatedly rejected price in the past.
The projected path indicates a potential liquidity grab above 1.3590 followed by a sell-off toward 1.3420–1.3410 area, aligning with a trendline break scenario.
Bearish Scenario:
A strong rejection from the 1.3590 zone, especially if accompanied by bearish divergence or a strong candle close, could trigger a shift back down to the 1.3417–1.3428 support zone.
This would confirm a short-term top and potential retracement toward lower liquidity zones.
📊 Fundamental Backdrop:
USD-side:
Recent U.S. labor market strength (e.g. ADP report and low jobless claims) supports a hawkish bias, favoring USD upside.
However, Fed policymakers remain cautious due to trade tensions and tariff uncertainty. This has injected short-term volatility into USD pairs.
GBP-side:
UK economic data has been mixed, with GDP growth forecasts under scrutiny.
BoE policymakers are dovish, emphasizing weak productivity and wage pressures, making the pound vulnerable to downside catalysts.
📌 Conclusion:
Watch for a potential bull trap near 1.3590, followed by a bearish reversal toward 1.3420–1.3410 if momentum weakens and sellers step in. This would complete the expected technical leg down and align with broader risk sentiment if dollar strength returns.

GBP/USD.2H chart pattern.here's a breakdown of the GBP/USD 2-hour chart setup and the target points indicated:
🔍 Technical Analysis Summary
Pair: GBP/USD
Chart timeframe: 2h
Indicators used: Ichimoku Cloud, Trendline (Support), Risk-to-Reward box
Setup: Bearish break of trendline support
Direction bias: Short (Sell)
Chart pattern: Break of ascending trendline with a rejection from previous highs
Entry zone: Around 1.3540–1.3560
Stop loss: Above 1.3662
Take profit zones:
1. First Target (TP1): 1.33270
2. Second Target (TP2): 1.32110
🎯 Target Points
Target Price Description
TP1 1.33270 First support area
TP2 1.32110 Major support zone
These target points are based on previous support levels and the height of the pattern projected down from the breakout point.
Let me know if you'd like this analysis transferred to another time frame or want updated targets based on more recent price action.


sell GUThe up trend is broken as you can see and we are going down with a good momentom and also in 15m time frame our most recent support is broken and there is nothing else to push the price higher

gbpusdthis setup valid if there is good nfp for usd other wise previous trade is running for buy side

Fundamental Market Analysis for June 6, 2025 GBPUSDThe GBP/USD pair is trading near 1.3570 with little movement ahead of the US (US) labor market data.
The US Dollar Index (DXY), which measures the value of the US Dollar against six major currencies, is trading above around 98.80 at the time of writing. The upcoming US non-farm payrolls data for May is expected to add 130,000 jobs, down from April's 177,000. The unemployment rate is also expected to remain unchanged at 4.2%.
Weekly initial jobless claims rose to 247,000, above the 235,000 expected, U.S. Labor Department data showed. ADP US private sector employment data released on Thursday showed a 37,000 increase in May versus a 60,000 increase (revised from 62,000) recorded in April, well below market expectations of 115,000.
GBP/USD is gaining support as the Pound Sterling (GBP) finds support amid rising risk sentiment in the United Kingdom (UK) markets following US President Donald Trump's executive order signed on Tuesday. British exporters still face the previous 25 percent tariff rate as Trump granted the UK temporary relief from the US' stiff 50 percent tariffs on steel and aluminum.
Trading recommendation: SELL 1.3500, SL 1.3600, TP 1.3300

check the trendWith the support trend line break, the continuation of the downward trend will be likely. Then, considering the price behavior in the specified support area, there is a possibility of a trend change and the start of an upward trend.

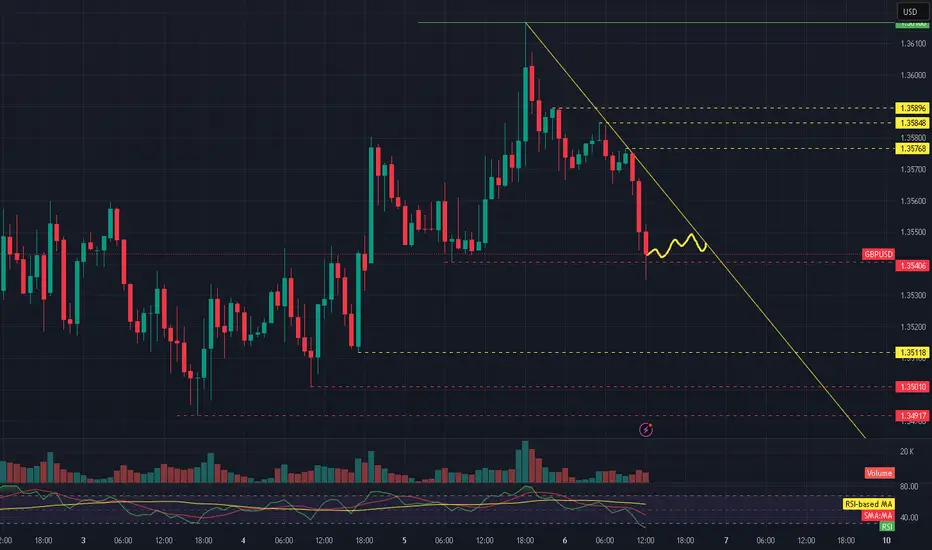
GBPUSD - hoyrly chartTrading idea:
Short once support 1.35406 is broken!
Support and resistance:
🔴 Resistance Levels:
1.35768 — the nearest key resistance; a recent swing high before the current decline.
1.35848 – 1.35896 — resistance zone where previous pullbacks and consolidations occurred; could act as a ceiling if retested.
1.36100 — the upper boundary of the range, a potential target if the price breaks out higher.
🟡 Support Levels:
1.35406 — current price level near local support; the price is attempting to build a base here.
1.35118 — an important support level that previously triggered bullish reversals.
1.35010 — an additional support area near recent lows.
1.34917 — strong support, aligned with a previous bottom that marked the beginning of an upward impulse.
🔍 Additional Notes:
The price is consolidating near the lower edge of the short-term range, under pressure from the descending trendline.
RSI is approaching neutral territory — a potential for a reversal exists, but no clear signal yet.
Volume remains moderate, suggesting limited activity from major players — increasing the probability of a sideways move in the near term.