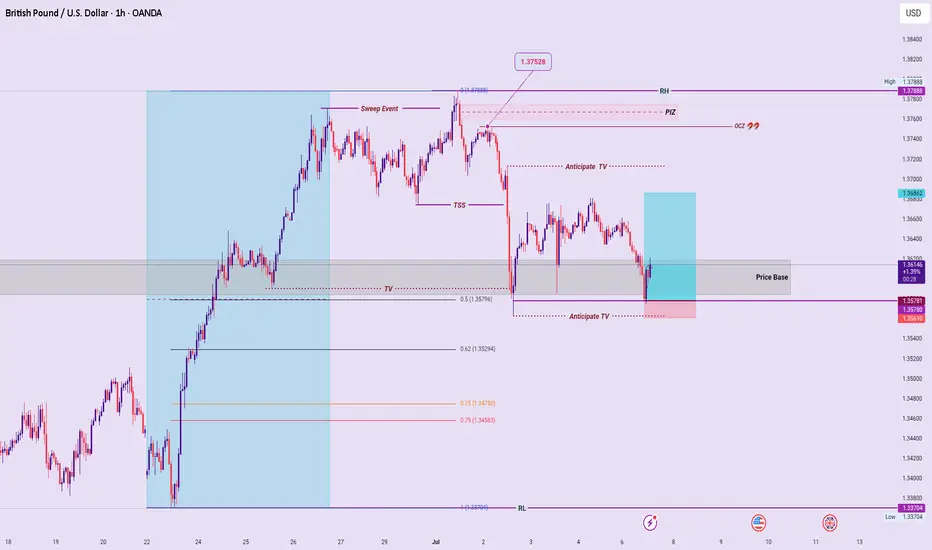
Follow up on GBPUSD Took a snipe entry at the Price Base aligning with a 5min PIZ. Trade protected already.
USDGBP trade ideas
GBP/USD30 Mins Frame
🧠 Technical Overview:
Price is currently testing a strong resistance zone after a gradual upward movement, with signs of a potential bearish reversal.
A rising wedge pattern is forming — typically a bearish reversal pattern, especially if broken to the downside.
🧩 Key Technical Elements:
1. Supply Zone:
Defined between 1.3675 and 1.3717 — a previously strong resistance area.
Price is currently facing rejection within this zone, showing weakening bullish momentum.
2. Entry Point:
Sell at 1.36560, triggered by rejection from the resistance zone and a potential breakdown below the ascending support (blue line).
3. Stop Loss:
1.37177, placed above the supply zone — a logical level that invalidates the bearish setup if reached.
4. Targets:
First Target: 1.35602 – a clear previous support level and logical profit-taking zone.
Second Target: 1.34207 – a stronger, more significant support zone, likely to be tested if bearish momentum continues.
📉 Expected Price Action:
The chart shows a weak rising wedge pattern, indicating potential buyer exhaustion.
A break below the ascending trendline (blue) may trigger strong downside movement.
The expected move is illustrated with the red arrow on the chart, indicating a bearish trajectory.
🔥 Risk-to-Reward Ratio (R:R):
First Target:
Potential Reward: ~95 pips
Risk (SL): ~61 pips
→ R:R ≈ 1.56:1
Second Target:
Potential Reward: ~235 pips
→ R:R ≈ 3.85:1
✅ Very favorable, especially toward the second target.
✅ Conclusion:
The short setup is technically valid and supported by price structure and resistance confirmation.
The supply zone has proven strong, and price is struggling to break above it.
A solid trade opportunity for short- to medium-term traders with clearly defined risk and reward.

GBPUSD LONG FORECAST Q3 D11 W28 Y25GBPUSD LONG FORECAST Q3 D11 W28 Y25
It’s Fun Coupon Friday! 💸🔥
Professional Risk Managers👋
Welcome back to another FRGNT chart update📈
Diving into some Forex setups using predominantly higher time frame order blocks alongside confirmation breaks of structure.
Let’s see what price action is telling us today!
💡Here are some trade confluences📝
✅Daily order block
✅1H Order block
✅Intraday breaks of structure
✅4H Order block
🔑 Remember, to participate in trading comes always with a degree of risk, therefore as professional risk managers it remains vital that we stick to our risk management plan as well as our trading strategies.
📈The rest, we leave to the balance of probabilities.
💡Fail to plan. Plan to fail.
🏆It has always been that simple.
❤️Good luck with your trading journey, I shall see you at the very top.
🎯Trade consistent, FRGNT X

Sell idea!Hello all. market react to the br node and make a low, then after hitting to an LOZ was going higher. now after breaking the IHS market will collapse. R:R 11 is enough. be happy(wink)

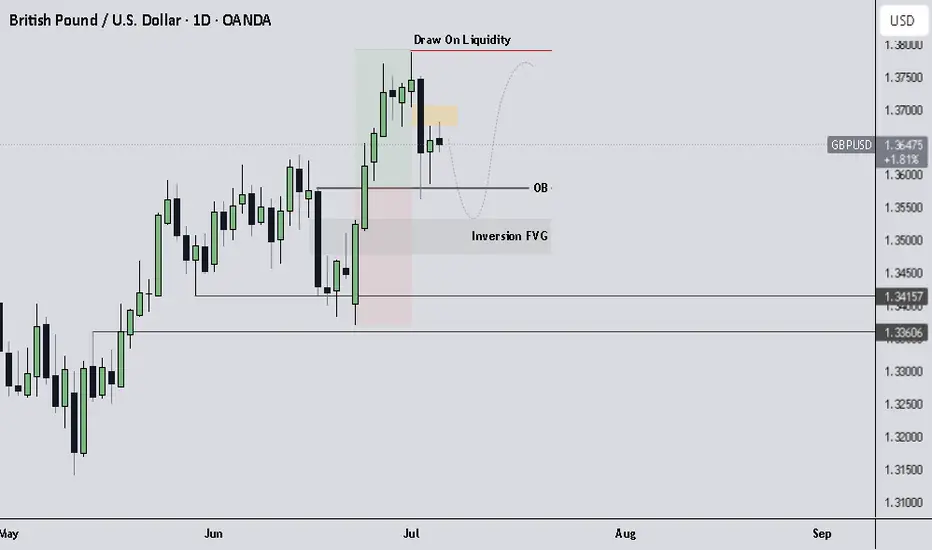
GBPUSD Outlook.Multi-Timeframe Context
Weekly Timeframe
Price is currently sitting on a weekly bullish Order Block (OB).
This higher timeframe demand zone provides the foundation for my bullish bias.
As long as price holds above this OB, I expect continuation to the upside.
🔹 Daily Timeframe
Dropping down to the Daily, we are currently hovering near the 50% level of the Daily dealing range.
Between 01/07/2025 and 03/07/2025, a clear Sell-side Imbalance Buy-side Inefficiency (SIBI) was formed.
This SIBI may act as a short-term bearish pressure, likely to cause a retracement.
📉 Short-Term Expectation
Expecting price to retrace lower, possibly into the midpoint of the Daily bullish OB, which aligns neatly with the Inversion Fair Value Gap (IFVG).
This would create a premium-to-discount transition, ideal for reaccumulation before a continuation move higher.
🔁 Support Array
Weekly OB = long-term bullish demand.
Daily OB midpoint + IFVG confluence = key re-entry or continuation area.
Watching for bullish confirmation once price rebalances through SIBI and taps deeper into discount.
🎯 Target Remains
Draw on Liquidity above 1.37800.
Ultimate target: 1.4000 psychological + structural level.
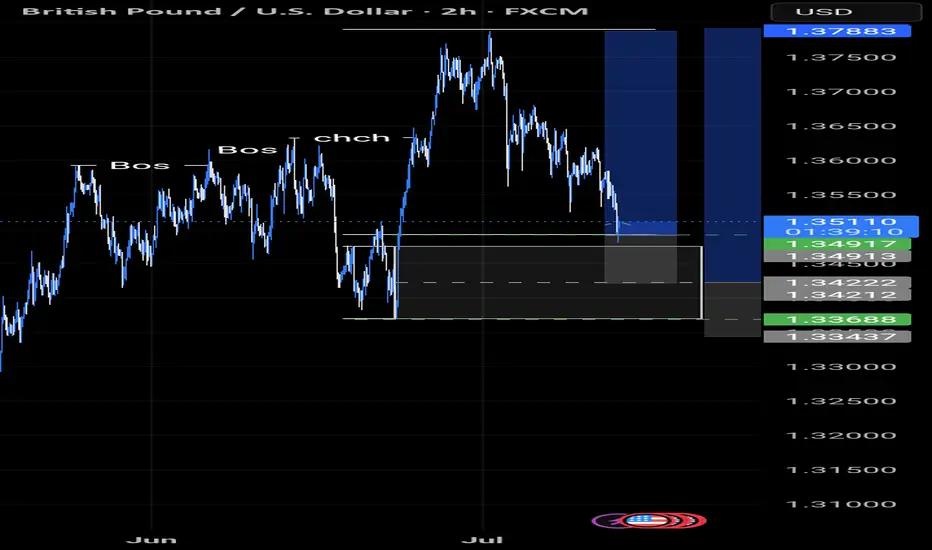
Market Trap Alert! GBP/USD Bearish Robbery Plan🔥💸 "The Cable Heist" – GBP/USD Robbery Plan Using Thief Trading Style 💸🔥
— Unfiltered Forex Forecast with Risky Intentions —
🌍 Hey Money-Makers, Market Hustlers & Chart Bandits! 🤑✈️
Hola! Bonjour! Marhaba! Hallo! Ciao! Welcome to the Forex streets where the smart rob the charts, not banks.
Ready for the GBP/USD Heist? Let’s break it down with our infamous Thief Trading Style – raw, unapologetic, and built for profits.
💼 Operation Name: “The Cable Forex Bank Robbery”
🎯 Pair: GBP/USD – aka “The Cable”
⚔️ Style: Scalp / Day Trade / Swing Heist
📊 Bias: Short (Bearish Setup)
🛠 STRATEGY SETUP: "Follow the Shadows"
🔍 Analysis Basis:
Smart-Money Traps at Key Levels
Oversold ≠ Reversal (Read between the candles)
Liquidity Hunting Zones
Retail Stop Clusters Exposed
Thief-style DCA Entries (Staggered Entry Levels)
Multi-timeframe Confirmation
COT, Sentiment & News-Driven Volatility
🎯 ENTRY ZONE:
Enter short (sell) using 15M or 30M chart.
Sell Limits near recent highs (pullback zone).
DCA (Layered Entry) recommended – Thief loves catching price slipping.
Let the liquidity work for us.
🛑 STOP LOSS (SL):
Base SL around 1.36200 on 2H Chart – above swing high.
Adjust SL per position size and total entries.
Manage risk, but remember: thieves don’t panic, they plan!
🎯 TARGET ZONE:
TP near 1.33800 or adjust using price action.
Escape before target if market mood flips – no need to be greedy.
Trail SLs if market momentum dies down.
👀 Scalpers' Special Note:
Only SHORT — don’t mess with long side unless you’re a liquidity donor.
Quick ins & outs. If you're loaded with capital, jump in big – else follow the swing team.
Use trailing SLs for safety — protect the loot.
📢 FUNDAMENTALS TO WATCH:
News Impacting GBP/USD
COT Reports
Sentiment Indicators
Macro Trends / Yield Spreads
US Dollar Strength Index (DXY)
UK Economic Reports (CPI, GDP, Rate Decisions)
⚠️ RISK MANAGEMENT TIPS:
🚨 Avoid new entries during news releases
🚨 Use trailing stops during volatility spikes
🚨 Secure running trades before major announcements
🚀 Boost the Robbery – Support the Strategy
💖 Smash that BOOST BUTTON if you're vibing with this setup. Help the Thief crew grow stronger!
Let’s keep milking the market 💸 – one “heist” at a time. Stay dangerous, stay smart.
🔓 NOTE: This isn't investment advice. Just a wild trading idea from a chart outlaw.
Always DYOR – Do Your Own Robbery (Research).
Market conditions shift fast. Stay alert, adapt, and respect your capital.
#ForexThiefStyle #CableHeist #GBPUSDShort #SmartMoneyMoves #LiquidityHunters #ChartOutlaws #TradingRebels #DayTradeLife #ScalpersParadise #ForexGang #FXHeistPlans

Ready to Ride the Wave? Let’s Go Long — Together.Market momentum is shifting — and opportunity awaits. This is more than a bullish move; it’s your moment to elevate your trading game. Whether you're just starting or refining your edge, clarity and confidence are key.
If you’re tired of second-guessing setups and want guidance that brings structure and consistency to your trades, now’s the time to level up. I help traders align with the market, build smart systems, and take charge of results — no fluff, just precision.
🚀 Tap into growth with mentorship that works. Let’s go long — on your potential.
#tradingview #forexmentor #buysetup #tradingeducation #marketmomentum #consistencyiskey

U.K. GDP Report: What It Means for GBPUSD CMCMARKETS:GBPUSD
Today, the U.K. Office for National Statistics (ONS) 📊 will release its monthly Gross Domestic Product (GDP) report 🗓️ at 6:00 a.m. UTC ⏰, likely impacting the British Pound (GBP) and GBP pairs globally 🌍.
🧐 What is GDP, and why does it matter?
GDP (Gross Domestic Product) 💡 measures the total value of all goods and services produced within a country’s economy over a specific period. It is a key indicator of economic health 🏥, influencing central bank decisions, investor sentiment, and currency valuations.
A higher-than-expected GDP 🆙 suggests a strong economy, which can support the currency 💪, while a lower-than-expected GDP 🆘 indicates weakness, often pressuring the currency lower 🔻.
📈 Market Expectations:
The market forecasts UK GDP growth to rise by 0.1% for May 🗓️, but we anticipate the increase may be smaller than expected 📉, implying a potential bearish surprise for GBPUSD.
⚡️ Trade Setup:
🔻 SELL Stop: 1.35330
❌ Stop Loss: 1.35714
✅ Take Profit: 1.34946
Risk-reward ratio: 1:1 ⚖️
🚨 Why Sell Here?
🔸 A weaker-than-expected GDP could lead to a pullback in GBPUSD below 1.3500 🚦.
🔸 Technical levels align with potential downside opportunities.
🔸 Volatility expected during and after the data release — manage risk carefully! ⚠️
📌 Stay tuned for live updates and analysis following the data release!
💬 Support this post if it helps your trading decisions! 🔔

gbp usd bearish ideaas it bounced of the high of the channel its a possible scenario it come back to our target

check the trendIt is expected that a trend change will form within the current support range and we will witness the start of an upward trend.
If the price breaks through the support range, a continuation of the downward trend will be likely.
GBPUSDSo we have the liquidity from both sides we have to look on LTF what market is doing especially on That Zone i have marked we are transitioning into the New York time zone we can expects a 30 pip reversal or more as also London time is about to get over
But if it breaks above that zone and grabs liquidity we will look for SMS (shift in market structure on lower TF) otherwise its bearish

GBPUSD SetupWould take a sell once price gets to my POI, make sure you make your own Research's before entering.

GBPUSD : New-Week Technical Bias (Market Open)
Multi-Timeframe Structural Outlook:
Higher Timeframes (M,W,D): In Ascend Sequence sweeping major liquidity levels
4H Structural & Liquidity Picture:
Trend Signature Shift (TSS):
A clean TSS followed the Sweep Event, shifting internal structure bearish and signaling short-term vulnerability.
Trap Vectors & Liquidity Mechanics:
Price engineered multiple Trap Vectors (TV), both pre- and post-rejection. Further anticipated TV zones exist just above and below current price level at 1.37138 and 1.35630 respectively aligning with Fibonacci retracement confluence.
Key Support Zone:
Price Base between 1.35796 – 1.36200 remains pivotal. Sustained hold here suggests possible short-term recovery; decisive break below exposes deeper liquidity pools toward the lower fib levels and potentially the Range Low (RL) at 1.33704.
Decision Zones:
Upside Consideration:
Recovery above 1.36200 with structural confirmation may reclaim bullish intent, though a retest/ break of the RH at 1.37888 remains the higher timeframe liquidity magnet.
Downside Consideration:
Breakdown below the Price Base accelerates sell-side targets toward the anticipated TV zones and deeper fib levels, with full invalidation exposing the RL.
Summary:
Bearish short-term lean favored following the TSS, but Price Base support remains a critical decision point. Break below confirms deeper sell-side exploration; sustained defense reopens bullish continuation/corrective potential.

GBPUSD TECHNICAL & ORDER FLOW ANALYSISOur analysis is based on a multi-timeframe top-down approach and fundamental analysis.
Based on our assessment, the price is expected to return to the monthly level.
DISCLAIMER: This analysis may change at any time without notice and is solely intended to assist traders in making independent investment decisions. Please note that this is a prediction, and I have no obligation to act on it, nor should you.
Please support our analysis with a boost or comment!

GBPUSD Long Re-entry, 07 JulyAsia Fill & Volume-Based Setup
This is a momentum-driven long based on Asia Fill and a strong bullish shift on LTF, with clear DXY correlation. HTF doesn't offer major confluence, but intraday price action supports the idea.
📍 Entry: Waiting for a retest of the 5m OB left behind after a strong bullish move
📈 Confluence: 1m BOS + 15m Extreme OB + high buyer volume
🔁 Risk: Price may not return to 5m OB – if missed, it's a no-trade
🎯 Target: Asia high (but first 1:3 RR), quick BE if we catch the move
Clean setup with structure and volume in our favor – execution depends on retest.

GBPUSD TRADE IDEA UPDATE We seem to in for a continuation move to the upside.
We've been waiting for a pullback throughout this week and we've been tapped into the trade.
Let's see how the market does it's thing
GBPUSD InsightHello to all our subscribers!
Please feel free to share your personal thoughts in the comments. Don’t forget to hit the boost button and subscribe!
Key Points
- U.S. President Trump revealed letters sent via Truth Social to the leaders of seven countries, including the Philippines and Algeria. Notably, he warned of a 50% tariff on imports from Brazil.
- The June FOMC minutes confirmed that key Fed members are divided on the outlook for rate cuts within the year.
- The U.S. 10-year Treasury yield reversed course and fell for the first time in six sessions, following strong demand in the latest bond auction.
Major Economic Events This Week
+ July 10: Germany – June Consumer Price Index (CPI)
+ July 11: United Kingdom – May Gross Domestic Product (GDP)
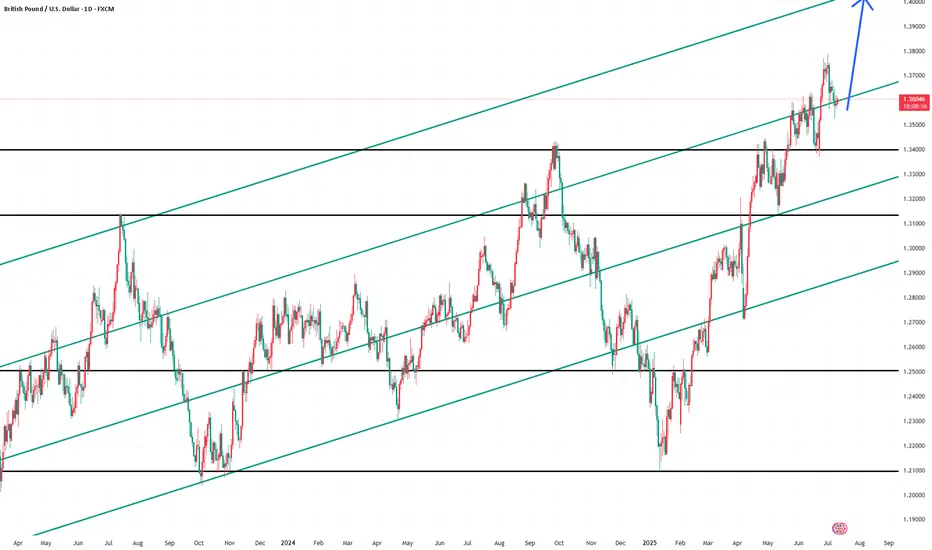
GBPUSD Chart Analysis
While the pair recently faced resistance near the 1.38000 level and experienced a pullback, it appears to be regaining momentum, supported by the trendline near 1.36000.
If this support holds and the price moves as expected, a rally toward the 1.40000 level could be anticipated.
However, if the current support fails, the pair could retreat toward the 1.34000 level. Therefore, it is important to closely monitor the price action in the current zone.
GBPUSD"My current expectation is that the price will continue to move within the descending channel on the 1-hour timeframe. I'm waiting for the price to retest the upper boundary of the channel. If a valid bearish confirmation signal (such as a reversal candlestick pattern) forms at that level, I plan to enter a short position."

Gbpusd short scalp I will consider a short only if pull back happens prior to target 1 being a traded to.
I like the downward monetum this morning.
4 losses 1 win for the simulated scalps. If this one is triggered it is the 6th scalp out of 100

DeGRAM | GBPUSD got out from the triangle📊 Technical Analysis
● Price pierced the blue-labelled trend-line and is threatening to exit a month-long contracting triangle; successive higher lows since 3 Jul show demand absorbing every dip.
● A confirmed H1 close above 1.3650 completes the pattern, unlocking the 1.3700-1.3720 supply zone (June range cap) with measured-move scope toward the broader channel midpoint at 1.3770.
💡 Fundamental Analysis
● Post-election political clarity and an uptick in UK 2-yr gilt yields narrow the policy-gap, while Friday’s softer US NFP trims Fed-rate expectations—both favouring sterling over the dollar.
✨ Summary
Buy 1.3620-1.3650; break >1.3650 targets 1.3700 → 1.3770. Long bias void on an H1 close below 1.3590.
-------------------
Share your opinion in the comments and support the idea with a like. Thanks for your support!

GBPUSD: Bullish Continuation & Long Signal
GBPUSD
- Classic bullish pattern
- Our team expects retracement
SUGGESTED TRADE:
Swing Trade
Buy GBPUSD
Entry - 1.3503
Stop - 1.3453
Take - 1.3608
Our Risk - 1%
Start protection of your profits from lower levels
Disclosure: I am part of Trade Nation's Influencer program and receive a monthly fee for using their TradingView charts in my analysis.
❤️ Please, support our work with like & comment! ❤️

GBPUSDPrice reached a major weekly resistance and started selling with the daily giving a strong bearish engulfing last week. H4 formed a double top and started creating lower highs. H1 has formed a third bearish wedge. Waiting for clear breakout to look for shorts. Watch out for fundamentals this week.

GBPUSD Bank of England (BoE) Bank Rate
Current Rate: 4.25% ,the 10 year bond yield GB10Y =4.632%
The BoE reduced its base rate from 4.50% to 4.25% in May 2025 and has maintained it at 4.25% since then (including the June 19, 2025 meeting).
The Monetary Policy Committee (MPC) has signaled a likely gradual easing path with expectations of a 25 basis point cut possibly at the August 7, 2025 meeting, potentially bringing the rate down to around 4.00%.
The BoE’s decision reflects easing inflation pressures as inflation stands at 3.4% but remains cautious due to ongoing economic uncertainties and inflation still above target.
Federal Reserve (Fed) Funds Rate
Current Rate: Approximately 4.50%-4.25% (mid-2025 consensus)
The united state 10 year government bond yield US10Y=4.407%
The Fed has held rates steady at around 4.50% -4.25%, with markets expecting a cautious approach to rate cuts amid inflation concerns and economic data.
The Fed’s policy remains more restrictive compared to the BoE, though some easing is anticipated later in 2025 depending on inflation and growth.
Context
bond yield differential
GB10Y-US10Y=4.632%-4.407%= 0.225% advantage for carry traders in favour GBP.
Interest rate differential
GBP IRT-USD IRT= 4.25%-4.5%=-0.25% ,The Fed rate is about 0.25 percentage points higher than the BoE rate, giving a slight interest rate advantage to the USD over GBP at the short-term policy rate level.
Carry Trade Impact
The carry trade involves borrowing in a currency with a lower interest rate and investing in a currency with a higher rate to earn the spread.
Despite the Fed’s slightly higher policy rate, the BoE’s historically higher rates earlier in 2025 and expectations of a slower pace of Fed cuts have supported GBP carry trades.
The interest rate differential is relatively narrow, so carry trade flows are moderate but still contribute to demand for GBP assets.
The bond yield differential slightly favors GBP at 4.632% gb10y as against USD 4.407% , attracting fixed-income capital to uk treasury giving gbp short term advantage.
#GBPUSD
