Possibility of uptrend Wave B is expected to complete within the support area and the specified timeframe, and then we will see the start of the uptrend. A break above the 78.6% level will invalidate the above scenario.
USDGBP trade ideas

Fundamental Market Analysis for July 7, 2025 GBPUSDEvents to pay atttenyion to today:
09:00 EET. GBP - Change in retail sales
GBPUSD:
The GBP/USD pair is starting the new week on a subdued note, fluctuating within a narrow range around the 1.3600 mark during the Asian session amid mixed fundamental signals.
The British pound (GBP) received some support last week after Prime Minister Keir Starmer said that Chancellor Rachel Reeves would remain in her post for the foreseeable future. However, the growing likelihood of a rate cut by the Bank of England (BoE) as early as August is having a negative impact on the GBP/USD pair. In fact, BoE Governor Andrew Bailey said that interest rates are moving downwards, while Monetary Policy Committee (MPC) member Alan Taylor called for faster rate cuts amid the risk of a hard landing for the British economy.
However, the decline in the GBP/USD pair is still being held back by the underlying bearish sentiment towards the US dollar (USD). Investors remain concerned that US President Donald Trump's sweeping bill to cut taxes and increase spending will lead to an explosion in the federal deficit and exacerbate the US's long-term debt problems. This, along with growing expectations that the Federal Reserve (Fed) will resume its cycle of rate cuts in the near future, is keeping the US dollar close to its February 2021 low.
Investors will therefore be closely studying the FOMC meeting minutes, which will be published on Wednesday, for clues about the Fed's rate cut path, which will stimulate demand for the US dollar and give a significant boost to the GBP/USD pair.
Trading recommendation: SELL 1.3620, SL 1.3640, TP 1.3520

Intraday Drop into Support Zone — Can GBP/USD Bounce?Hi everyone,
GBP/USD continues to consolidate below the 1.36850 level. Price failed to break above and moved lower into the 1.35300–1.34600 zone, providing us with a clean intraday trade setup.
A drop into this area was highlighted as the more probable short‑term path, and we’re now looking for GBP/USD to find support in this region; and more importantly, to hold above the 1.33800 level to form the base for another push higher.
As previously noted, a decisive break above 1.37500 would renew our expectation for further upside, with the next key target around 1.38400. We'll be monitoring price action closely to see how it unfolds.
We’ll continue to provide updates on the projected path for GBP/USD as price approaches this target.
The longer-term outlook remains bullish, and we expect the rally to continue extending further from the 1.20991 January low towards 1.40000 and 1.417000.
We’ll be keeping you updated throughout the week with how we’re managing our active ideas. Thanks again for all the likes/boosts, comments and follows — we appreciate the support!
All the best for the week ahead. Trade safe.
BluetonaFX

GBPUSD BUY and SELL LIQUIDITY SETUP GBPUSD : A sweep of this liquidity below will open our Buy entry at $1.35702 with SL at $1.35496 and TP at $1.36576.
Watching for a Sell after Buy trade hits TP.
#GBPUSD

GBP/USD weekly outlookMy weekly outlook & key levels for GBP/USD. I will look for a confirmation of my strategy once reach one of this levels.

Bullish bounce?The Cable (GBP/USD) has bounced off the pivot and oculd rise to the 1st resistance which is a an overlap resistance.
Pivot: 1.3531
1st Support: 1.3423
1st Resistance: 1.3675
Risk Warning:
Trading Forex and CFDs carries a high level of risk to your capital and you should only trade with money you can afford to lose. Trading Forex and CFDs may not be suitable for all investors, so please ensure that you fully understand the risks involved and seek independent advice if necessary.
Disclaimer:
The above opinions given constitute general market commentary, and do not constitute the opinion or advice of IC Markets or any form of personal or investment advice.
Any opinions, news, research, analyses, prices, other information, or links to third-party sites contained on this website are provided on an "as-is" basis, are intended only to be informative, is not an advice nor a recommendation, nor research, or a record of our trading prices, or an offer of, or solicitation for a transaction in any financial instrument and thus should not be treated as such. The information provided does not involve any specific investment objectives, financial situation and needs of any specific person who may receive it. Please be aware, that past performance is not a reliable indicator of future performance and/or results. Past Performance or Forward-looking scenarios based upon the reasonable beliefs of the third-party provider are not a guarantee of future performance. Actual results may differ materially from those anticipated in forward-looking or past performance statements. IC Markets makes no representation or warranty and assumes no liability as to the accuracy or completeness of the information provided, nor any loss arising from any investment based on a recommendation, forecast or any information supplied by any third-party.

Bearish reversal off pullback resistance?GBP/USD is rising towards the resistance level which is a pullback resistance that is slightly above the 50% Fibonacci retracement and could drop from this level to our take profit.
Entry: 1.3683
Why we like it:
There is a pullback resistance level that is slightly above the 50% Fibonacci retracement.
Stop loss: 1.3746
Why we like it:
There is a pullback resistance level.
Take profit: 1.3590
Why we like it:
There is a pullback support level.
Enjoying your TradingView experience? Review us!
Please be advised that the information presented on TradingView is provided to Vantage (‘Vantage Global Limited’, ‘we’) by a third-party provider (‘Everest Fortune Group’). Please be reminded that you are solely responsible for the trading decisions on your account. There is a very high degree of risk involved in trading. Any information and/or content is intended entirely for research, educational and informational purposes only and does not constitute investment or consultation advice or investment strategy. The information is not tailored to the investment needs of any specific person and therefore does not involve a consideration of any of the investment objectives, financial situation or needs of any viewer that may receive it. Kindly also note that past performance is not a reliable indicator of future results. Actual results may differ materially from those anticipated in forward-looking or past performance statements. We assume no liability as to the accuracy or completeness of any of the information and/or content provided herein and the Company cannot be held responsible for any omission, mistake nor for any loss or damage including without limitation to any loss of profit which may arise from reliance on any information supplied by Everest Fortune Group.

The scenario ahead..Hello friends...
The marked areas are important ranges for this currency pair.
You can look for confirmation for trading in these areas, and if you are a new trader, the market trend is bullish. Try to make buy trades, rather than sell trades.
If you like these analyses, support our team page, and we will also be happy if you tell us your opinion.

GBP/USD💰Symbol: { GBP/USD }
🟩Price: { 1.36990 }
🟥Stop: { 1.37826 }
1️⃣profit: { 1.36536 }
2️⃣profit: { 1.35912 }
3️⃣profit: { 1.35116 }
4️⃣profit: { 1.34483 }
5️⃣profit: { 1.33859 }
📊Check your chart before entering.
🚨Check before use to make sure there is no important news.🚨

GBPUSD - OUTLOOK This is my technical perspective on GBPUSD.
Fundamentally expecting the Dollar to strengthen in the coming weeks
"May fortune attend thee, and thy trade prosper." .......L2Earned
GU-Tue-08/07/25 TDA-GU stagnant ahead of tomorrow's FOMC minutesAnalysis done directly on the chart
Follow for more, possible live trades update!
I often share my live trades in Tradingview public chat in London session, stay tuned!
Green flags, Red flags when you follow someone in trading:
Red flags:
-Always and only share winning trades
-No track records
-A lot of marketing campaign, offering paid courses and more but
with no proof of real trading skills
(I'm not against paid course etc... Just to keep in mind)
-Just sharing buy or sell but without explaining the confluences,
the setups, the reasons, the lot size, how risk manage the trade...
-Simply don't even know where to put sl and tp in advance
Green flags:
-Do live streaming in real time
-Keeping transparent about trade setups, ideas,
about wins and losses
-Share live track record of an account
These are just some signs (could be more green and red flag signs),
and should not be used as effective methods.
If you have more of green flags or red flags ideas, comment down below!
Premise:
A simple idea plan (like Tradingview public posts) won't describe everything.
No one can predict how market will move, it's always good to react to how it moves.
It gives an idea of how price might move, but no one come from FUTURE.
So I always encourage people to openly and actively discuss in real time.
For example discussing on Tradingview public chat (and more).
I don't give signals blindly, people should learn
and understand the skill.
Following blindly signals you won't know how to
manage the trade, where precisely put sl and tp,
lot size and replicate the move over time.
That's why you need active real time discussions.
Trading is not get rich quick scheme!
Active in London session!
Not financial advice, DYOR.
Market Flow Strategy
Mister Y

DOLLAR DIPS AHEAD OF JOB REPORT, GBP/USD TECHNICAL OUTLOOK.Global markets rose on Wednesday, with the dollar hovering near a three-year low of 96, as investors considered the increasing likelihood of US interest rate reduction and the push for trade agreements ahead of President Donald Trump's July 9 tariff deadline.
Meanwhile on the radar, the U.S. official Job report would be on the wire later this week and as always, market participants would keenly pay attention to the reading which would give critical gauge of the labor market strength vis a vis the health of the economy. In view of the upcoming report, a strong report could reinforce confidence in the economy while a mixed print may reignite concerns over the slowing growth.
GBP/USD TECHNICAL OUTLOOK
GBP/USD tested 1.3788 on Tuesday, its highest level since 1st of November 2021(approximately 44 months). However, the bears struggled to push prices before the close of the day.
Looking at the daily chart, the broader market structure remains bullish with price bouncing off the trendline multiple times hence acting as a dynamic support.
The pair is currently retracing, with potential target towards 50 level of the Fib. at 1.3588 which would likely act as a minor support, whereas a break below the 50 level would likely usher sellers to the next potential target around 78.6 level of 1.3469. Meanwhile, a break below 1.3380 would mean absolute BOS and then would signal that bearish momentum has prevailed hence sellers would potentially target 1.3176.
On the flip side, if bulls regain control near the trendline or within the Fibonacci zones, the key upside target remains the previous high at 1.3788, followed by a push toward the psychological 1.3800 barrier according to analysts. Breakouts in either direction remain possible in the coming weeks, especially amid heightened volatility and key macroeconomic drivers.

GBP/USD - Channel BreakoutThe GBP/USD pair on the M30 timeframe presents a Potential Buying Opportunity due to a recent Formation of a Breakout Pattern. This suggests a shift in momentum towards the upside and a higher likelihood of further advances in the coming hours.
Possible Long Trade:
Entry: Consider Entering A Long Position around Trendline Of The Pattern.
Entry: 1.36498
Stop Loss: 1.36245
Take Profit: 1.37596

GBPUSD - 15m - 95% PredictionGBPUSD - 15m
Bumping to 5 minutes order block and then dumping to create new lower low.

SHORT and SHORT in GBPUSDHello Fellow traders,
I am sharing my short position in GBP/USD today.
I have decided to go short on GBP/USD, following the announcement of steep U.S. tariffs. Fundamentally, this aligns with my outlook: the USD is acting as a safe haven, while the GBP remains more risk-sensitive amidst global uncertainty.
From a technical standpoint—though I keep things simple—my analysis supports the bearish sentiment, and I have entered a short position accordingly.
Good luck, everyone, and trade safe!

GBPUSD Chart Analysis & Scenarios✅ Bullish Breakout (if breaks 1.3666):
Target: 1.3680–1.3700
Confirmation: Price closes above resistance with strong volume
❌ Bearish Rejection (if rejected at 1.3637–1.3666):
Target: 1.3610, possibly 1.3588
Watch for: Bearish candlestick pattern at resistance + drop in volume
✅ Summary:
GBP/USD is recovering strongly but faces heavy resistance at 1.3637–1.3666.
Breakout above could open room toward 1.3700.
Rejection likely if momentum weakens near resistance, targeting previous lows.

Momentum’s Here. Don’t Miss Out.Opportunity favors the prepared. The market’s shifting, and this setup is your signal to rise. If you're aiming for growth, consistency, and a clear path forward — you're in the right place.
No more solo trades with shaky confidence. It’s time to align with a professional approach that focuses on results, not guesswork. I help traders navigate, structure, and succeed — and I’m here for those ready to take the next step.
🚀 Growth isn’t accidental. Let’s build it together.
#buysetup #forexmentor #tradingmindset #tradingconfidence #tradingeducation #consistentprofits

GBPUSD📌 GBPUSD – Scenario-Based Plan
The first level I’ve marked is a short-term zone.
If we get a strong buy signal there with good R/R, I’ll enter and trail aggressively.
The second level is a stronger demand zone and a better area for potential long setups.
❗️Remember: These are just scenarios — not predictions.
We stay ready for whatever the market delivers.

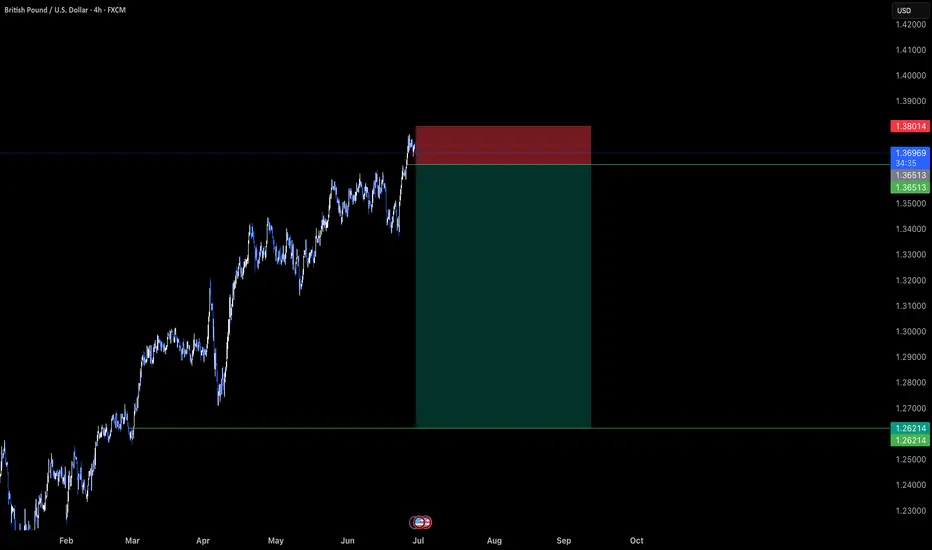
GBPUSD Forecast – Clean Supply Rejection, Eyes on Next Liquidit📉 GBPUSD Forecast – Clean Supply Rejection, Eyes on Next Liquidity Level (1.35130)
Price rejected perfectly from our 1.36349–1.36481 supply zone, showing clear bearish intent. Now all eyes are on the next major liquidity pool.
🟥 Supply Zone: 1.36349–1.36481
📍 Target: 1.35130 – Marked liquidity level
🔍 This is the power of zone + structure confluence — no indicators, just precision levels.
💡 Mark → Wait → Execute
That’s the FXFOREVER approach.
#FXFOREVER #GBPUSD #ForexForecast #SmartMoneyZones #SupplyAndDemand #PriceAction #ForexTrading


GBPUSD Is Going Up! Buy!
Take a look at our analysis for GBPUSD.
Time Frame: 9h
Current Trend: Bullish
Sentiment: Oversold (based on 7-period RSI)
Forecast: Bullish
The market is testing a major horizontal structure 1.360.
Taking into consideration the structure & trend analysis, I believe that the market will reach 1.370 level soon.
P.S
We determine oversold/overbought condition with RSI indicator.
When it drops below 30 - the market is considered to be oversold.
When it bounces above 70 - the market is considered to be overbought.
Disclosure: I am part of Trade Nation's Influencer program and receive a monthly fee for using their TradingView charts in my analysis.
Like and subscribe and comment my ideas if you enjoy them!

GBPUSD swing sell GBPUSD brexit was never a good idea, it looks bullish, many will have that bias and if you look carefully tapped into 4h supply multiple times, and its due for a correction

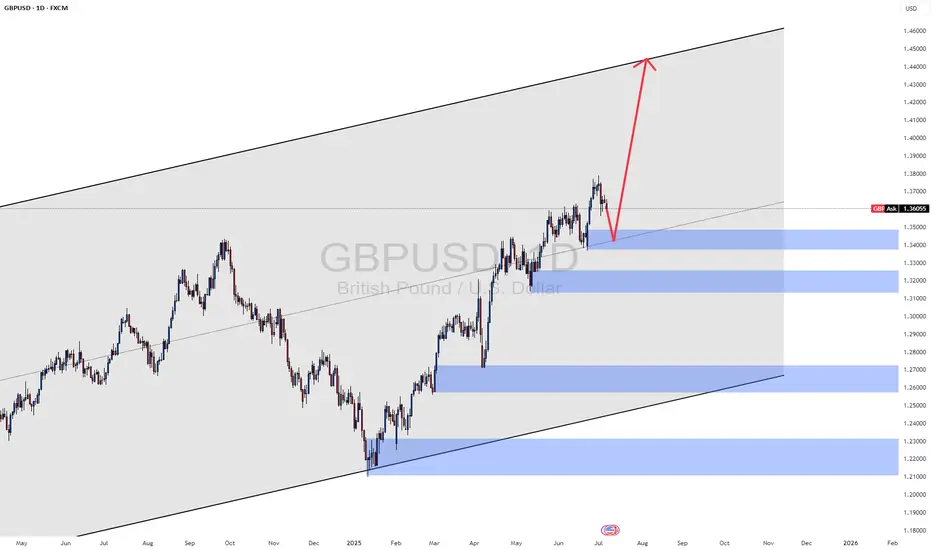
GBP/USD Pair Analysis📈 GBP/USD Pair Analysis – Monday, July 7, 2025
1️⃣ The pair is moving within an ascending price channel, indicating a continued positive trend in the medium term.
2️⃣ Strong demand areas have been identified on the larger time frames, which are expected to support the price in the event of a decline to these areas.
3️⃣ The MACD indicator is oversold, increasing the possibility of a rebound and upward movement from the current or nearby areas.
📌 Summary and Recommendations:
🔹 General Trend: Upward
🔸 The price is currently making a temporary downward correction.
✅ We expect the pair to rise again towards the upper limit of the price channel, provided it holds above the specified demand areas.