USDGBP trade ideas

Short to Long Waiting for the market to reach the poi and wait for reaction to short to the bullish poi
GBPUSD – Pound Stumbles on Political Risk and NFP FearGBPUSD – Pound Stumbles on Political Risk and NFP Fear: Reversal or Breakdown?
🧭 MACRO SNAPSHOT – All Eyes on UK Politics and US Jobs
The British Pound came under renewed pressure on Wednesday, losing nearly 0.8% intraday, driven largely by escalating political uncertainty in the UK. Concerns over early elections, party leadership instability, and fiscal doubts have weighed on GBP sentiment.
Meanwhile, the US Dollar remains supported ahead of the June Non-Farm Payrolls (NFP) release. With recent labor data showing signs of weakness (ADP: -33K), today’s NFP is expected to shape short-term Fed expectations. A weak report may cap USD gains and provide a rebound opportunity for GBP – but risk is two-sided.
📊 TECHNICAL STRUCTURE – H4 Chart Insights:
Trend Channel: GBPUSD is still trading within an ascending channel, but recent rejection at 1.3769 raises caution.
EMA Signals: Price has broken below EMA 13 and 34, showing momentum loss. EMA 89 is the next possible support near 1.3570.
Fibonacci Zones:
0.382: 1.3543
0.5: 1.3466
0.618: 1.3390
Key Levels to Watch:
Resistance: 1.3681 – 1.3769
Support: 1.3570 – 1.3450 (golden pocket)
The price is likely to test the midline or lower bound of the channel before resuming a move higher, assuming macro tailwinds don’t intensify GBP selling.
🎯 TRADE PLAN:
🔵 Buy Setup (Reversal from Demand Zone):
Entry: 1.3450 – 1.3460
SL: 1.3390
TP: 1.3570 → 1.3680 → 1.3760
Bias: Counter-trend rebound from golden pocket & ascending trendline
🔴 Sell Setup (Short-term pullback):
Entry: 1.3680 – 1.3700
SL: 1.3765
TP: 1.3570 → 1.3450
Bias: Fade weak bullish momentum near prior high resistance
📌 Risk Context:
Today’s US NFP report is high-impact – expect volatility spikes and spread widening. UK political headlines could cause gaps or sharp reversals. Traders are advised to reduce size or wait for clear rejection/confirmation candles before entry.

GBPUSD swing shortKeeping yesterday long open after taking profit setting limits for short swing on GPBUSD with fraction of profits of yesterday, price did close above weekly high so caution advised

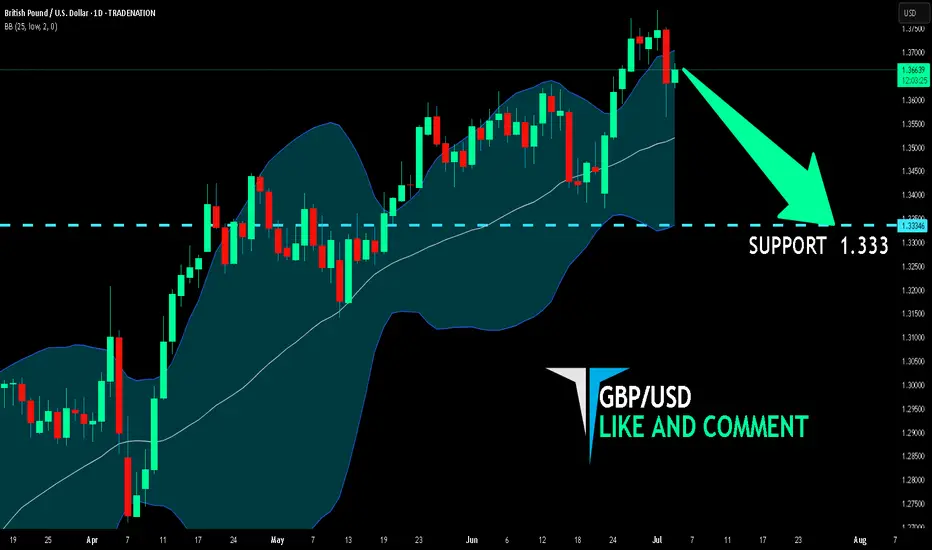
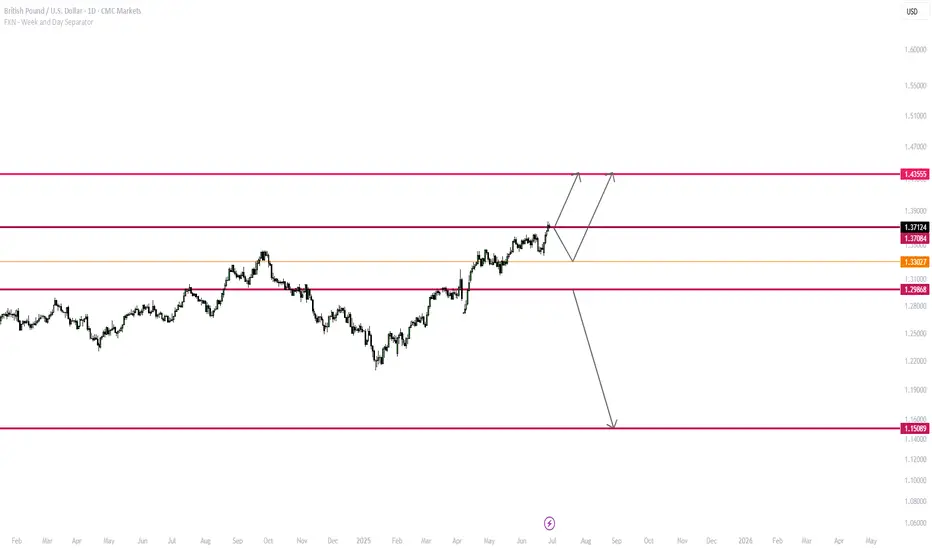
GBP/USD BEARISH BIAS RIGHT NOW| SHORT
Hello, Friends!
GBP/USD pair is in the downtrend because previous week’s candle is red, while the price is obviously rising on the 1D timeframe. And after the retest of the resistance line above I believe we will see a move down towards the target below at 1.333 because the pair is overbought due to its proximity to the upper BB band and a bearish correction is likely.
Disclosure: I am part of Trade Nation's Influencer program and receive a monthly fee for using their TradingView charts in my analysis.
✅LIKE AND COMMENT MY IDEAS✅
GBPUSD TRADE IDEA We're looking out for a trade on GBPUSD.
We await a pullback to the downside for a continuation in the original upward movement of the market
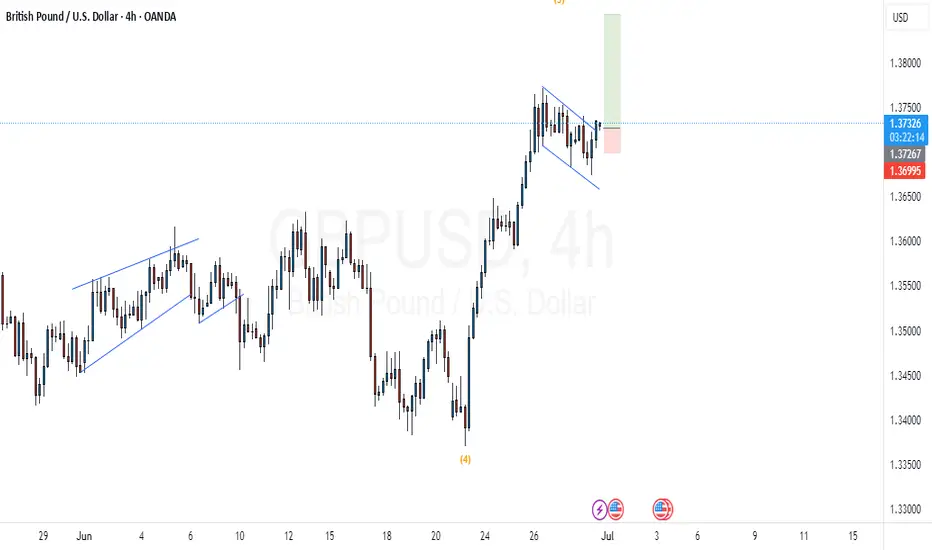
GBPUSD 30m – Elliott Wave + AO ConfirmationPrice is currently testing the 1.36277 zone. I’m closely monitoring for a break of structure below this level. If it breaks, I’ll be watching for a pullback setup to short, ideally aligning with BBMA/EMA confluence.
The wave structure looks clean:
• ✅ Wave (1), (2), (3), and (4) are completed.
• ✅ AO histogram also confirms momentum waves (1) to (4), with the current move likely to complete Wave (5) to the downside.
• 🔻 Wave (4) retraced into the previous imbalance zone and respected resistance, giving further confluence for bearish continuation.
Looking to target below 1.3500 for Wave (5) completion.
Key Levels to Watch:
• 🔑 Break below 1.36277 = Bearish confirmation
• 🎯 Potential TP Zone: 1.3450 – 1.3425
• 🚫 Invalidation if price closes above 1.3700 with momentum
Let’s see how price reacts at this key level 👀
#GBPUSD #ElliottWave #AO #PriceAction #BreakOfStructure #TradingView

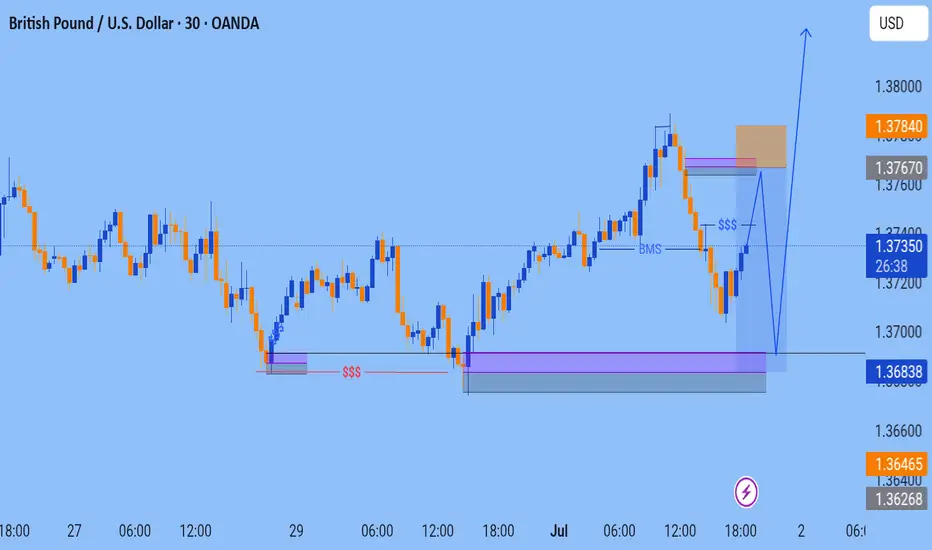
Sell to Buy ModelTho the sell hit sl but still went according to plan. Still Bullish and holding this buy for NFP happening tomorrow

skraaaaaa!!!check my previous post and you will see the before of this trade and a comprehensive explanation of my bias and analysis knowledge truly is power want learn SMC concept reach out to me and get a comprehensive understanding today
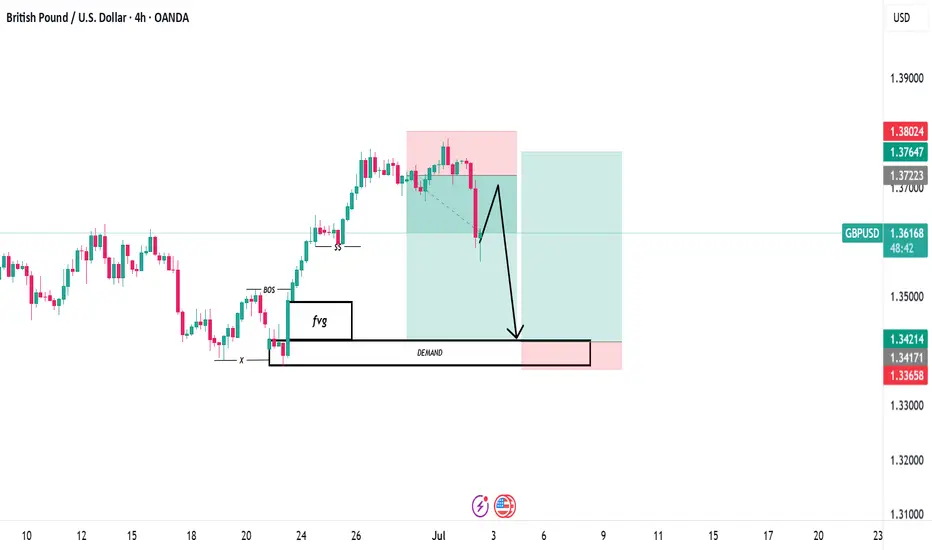
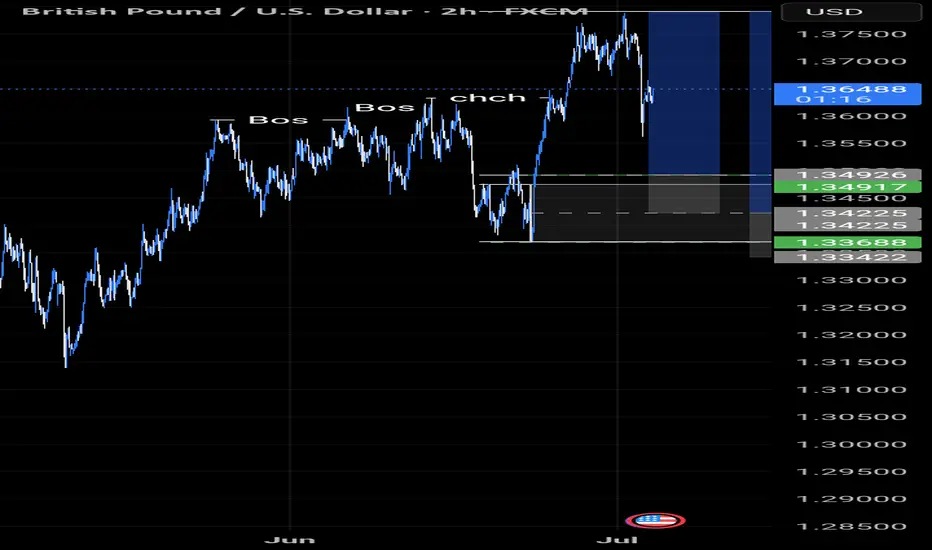
Updated GBP/USD Trade Idea: New Setup If Price Reaches Key LevelAfter successfully executing the previous trade, I’m now monitoring GBP/USD for a fresh opportunity. If the price reaches this point, it aligns with a high-probability zone where market structure suggests a potential reaction. This area has historically acted as a decision point, and I’ll be watching closely for confirmation before entering the next position.
This updated idea reflects a disciplined, price-action-based approach—focused on timing, structure, and market behavior. Whether you're a day trader or swing trader, this setup offers a clean risk-to-reward profile and fits well within an intraday strategy.
📈 Stay tuned for real-time updates, trade management insights, and detailed breakdowns. 💬 Follow for more GBP/USD strategies and actionable forex content.

GBP/USD Short Setup – Rising Wedge BreakdownGBP/USD Short Setup – Rising Wedge Breakdown
Timeframe: 2H
The pair has formed a rising wedge pattern, typically a bearish reversal signal. Price has now broken below the lower trendline, suggesting a potential downside move.
Setup Details:
Entry: ~$1.3717 (post-breakout)
Stop Loss: ~$1.3826 (above recent highs)
Target Zone: $1.3477 to $1.3407
Technical Analysis:
Rising wedge pattern breakdown confirmed
Supertrend indicator has flipped bearish
Momentum divergence visible on lower timeframes (not shown)
Fundamental Context:
GBP remains under pressure due to weak UK economic data and ongoing BoE rate cut expectations
USD strength backed by persistent inflation concerns and hawkish Fed tone
Bias: Bearish (Short-Term Swing Trade)
Look for potential retests of broken support for confirmation. Manage risk accordingly as volatility may increase ahead of upcoming macro events

GBPUSD At A Point of Indecision No clear direction going into the week ahead... Will sit tight, watch Monday and Tuesday before taking action... bullish continuation or not...
Kindly, lets see.
GBPUSD will have minor downtrend and continue go highAt lower timeframe, GBPUSD already gave rejection.
Wait until retracement is over and breakout at lower timeframe. Then, we can see GBPUSD go higher as possible

Wednesday Model70% of the time Wednesday is a classic sell
With this Model we take the true Monday high and low(00:00 EST)
Look for a rejection of a Swing high/low from the weekly/monthly TF
4hr CRT and a Market Structure Shift on the 1hr
Entry on the Order Block on the 1hr
Target? the Monday low


GBP/USD Bearish Reversal Pattern Detected GBP/USD Bearish Reversal Pattern Detected 🔻🦈
The chart illustrates a potential bearish Gartley pattern formation near the 1.3736 resistance zone, which has historically triggered price rejections (red arrows).
🔍 Key Observations:
📌 Price action completed a bearish harmonic pattern, suggesting a reversal setup.
💡 Multiple rejections at the upper resistance zone (1.3730–1.3780) highlight strong selling pressure.
📉 Break of trendline support confirms shift in structure.
🟠 Historical support zones (orange circles) now align with the projected target level: 1.3512.
🔽 A clean breakdown below 1.3650 could accelerate bearish momentum toward the target.
🎯 Target: 1.35124
🛑 Resistance: 1.3730–1.3780
✅ Support: 1.3510–1.3550 zone

GBP/USD Tactical Shift: Long Closed, Short Bias ActivatedAfter successfully capturing the upside move on GBP/USD, price has now reached a key resistance zone where bullish momentum appears to be fading. The recent price action shows signs of exhaustion, with lower highs forming near the top and a noticeable slowdown in buying pressure.
This shift in structure suggests a potential reversal opportunity. I'm now positioning for a short setup, anticipating a corrective move as sellers begin to step in. The risk is clearly defined above the recent highs, with downside targets aligned with previous reaction zones and intraday support levels.
This transition from long to short reflects a dynamic response to evolving market conditions—focused, disciplined, and opportunity-driven.

GBPUSD buyer in controlDaily candle closed with strong bullish.
Expecting a healthy retracement before another bullish movement
Good Luck

Bullish IdeaMarket forming what seems to be a bullish flag pattern, which results into an upward move. So we expect a good bullish pattern. Break out the structure and we
ready for the show now
GBP/USDPrice action trading is a methodology in financial markets where traders make decisions based on the actual price movements of an asset over time, rather than relying heavily on technical indicators or fundamental analysis. It involves observing and interpreting patterns and trends in price charts to predict future price movements.

GBPUSD politics and the upcoming NFPFX_IDC:GBPUSD trading was influenced by politics in UK. The pair recovered half of the losses, but the downside risk still remains. NFP could be a trigger. Let's dig in.
MARKETSCOM:GBPUSD
Let us know what you think in the comments below.
Thank you.
77.3% of retail investor accounts lose money when trading CFDs with this provider. You should consider whether you understand how CFDs work and whether you can afford to take the high risk of losing your money. Past performance is not necessarily indicative of future results. The value of investments may fall as well as rise and the investor may not get back the amount initially invested. This content is not intended for nor applicable to residents of the UK. Cryptocurrency CFDs and spread bets are restricted in the UK for all retail clients.

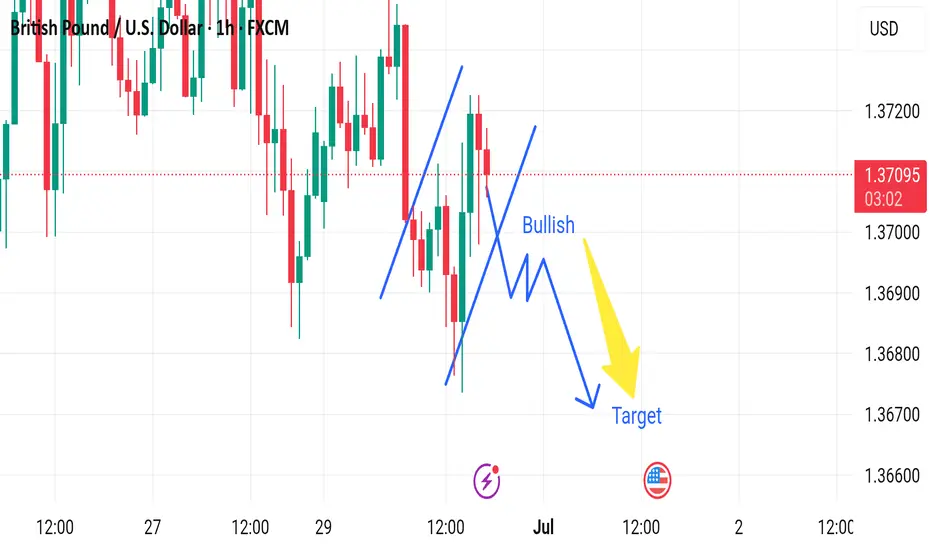
Market next target 🔀 Disruption Analysis – Bullish Alternative Scenario
While the current chart outlines a bearish scenario after a short-term bullish correction, leading to a drop toward the target near 1.36600, here’s how a bullish disruption could unfold instead:
---
🟢 Bullish Disruption Possibility:
1. False Breakdown / Bear Trap:
The market may dip slightly below recent lows to trigger sell stops and liquidity grab, then reverse upward.
If price finds strong buying interest around 1.3690–1.3700, it could spark a bullish reversal.
2. Strong Rejection Candles:
Watch for bullish engulfing or pin bar formations on lower timeframes (15m or 30m) near the dip area.
These would signal loss of bearish momentum.
3. Break of Lower High Structure:
A break above 1.3720 would shift short-term market structure to bullish.
It could lead to a move toward 1.3750–1.3780.
4. Macro Fundamentals:
Hawkish BOE comments or weak U.S. data could reverse USD strength, lifting GBP/USD.
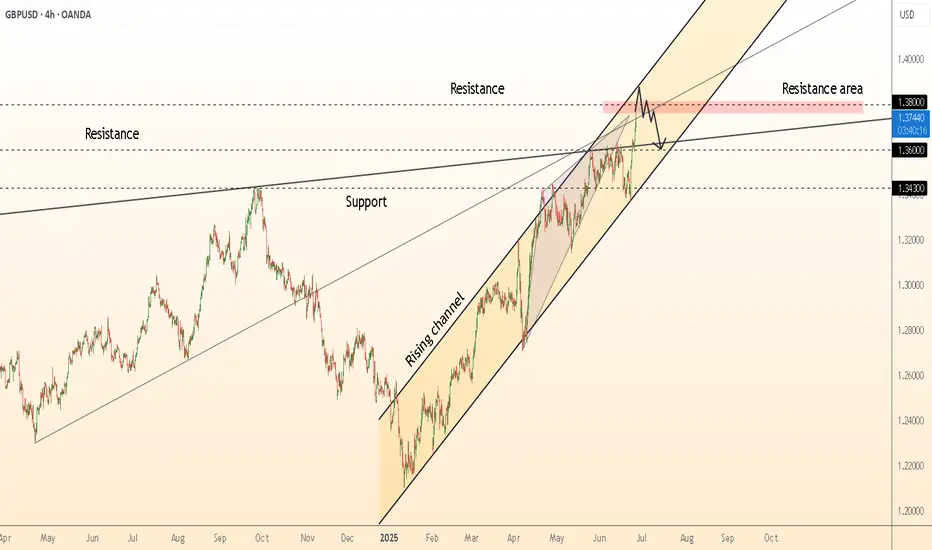
DeGRAM | GBPUSD preparing for a correction📊 Technical Analysis
● Cable is pressing the rising-channel ceiling together with the March swing-high supply at 1.378-1.380; successive long-upper-wicks plus fading 4 h RSI signal bull exhaustion at this dual resistance.
● A tiny evening-star has formed inside the pink resistance band and price is slipping back under the broken inner trend-line; first objective is the former breakout shelf / median line near 1.360, with the lower rail and April pivot at 1.343 next in view.
💡 Fundamental Analysis
● UK election blackout, soft retail-sales surprise and firmer month-end USD funding bids narrow the short-rate gap again, sapping fresh sterling demand.
✨ Summary
Short 1.374-1.380; sustain below 1.360 opens 1.343. Bear view void on a 4 h close above 1.380.
-------------------
Share your opinion in the comments and support the idea with a like. Thanks for your support!