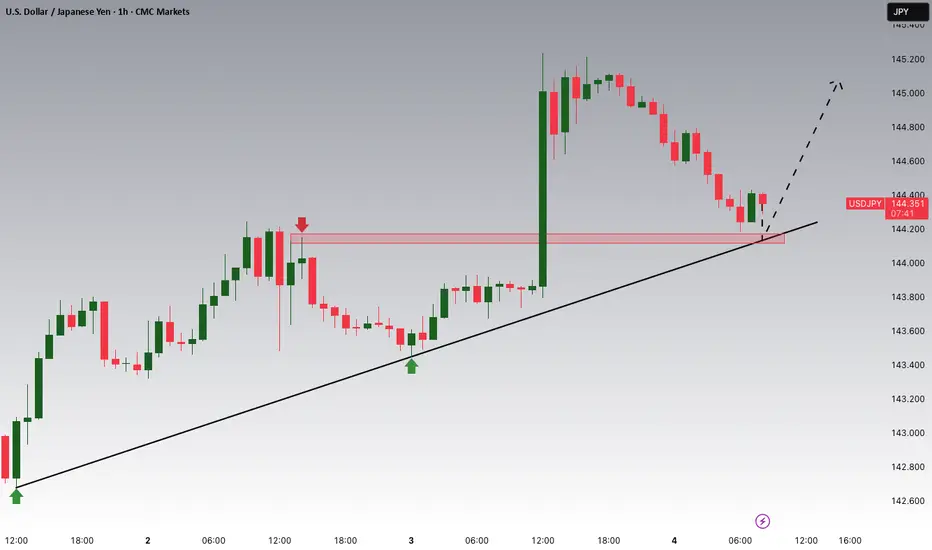
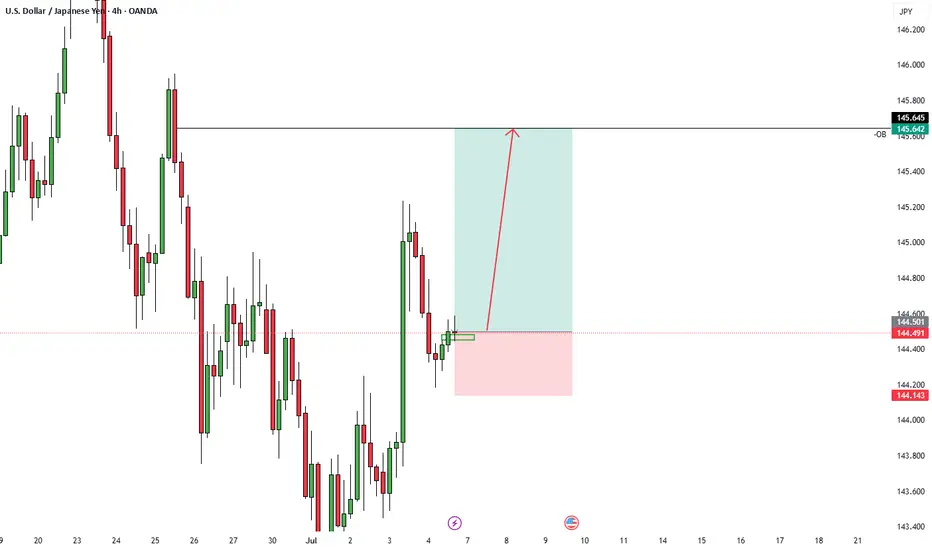
USDJPY Potential UpsidesHey Traders, in today's trading session we are monitoring USDJPY for a buying opportunity around 144.100 zone, USDJPY is trading in an uptrend and currently is in a correction phase in which it is approaching the trend at 144.100 support and resistance area.
Trade safe, Joe.
USDJPY trade ideas
USDJPY Price Accumulated|Time For Bullish Distribution|Setupsfx|The price has accumulated nicely and is now distributing. We have three targets in mind, but set your own based on your analysis. Our approach is purely technical, but also includes a basic fundamental approach. This analysis concludes over 1500 pips and is a swing move. Please use this analysis as educational purposes only, as it does not guarantee that price will move exactly as predicted.
If you like our idea, please consider liking and commenting on it.
Good luck and trade safely!
Team Setupsfx_

USDJPY – Key Support Bounce with Macro TailwindsUSDJPY is bouncing off a key trendline and 61.8% Fib zone (143.25–143.60) with confluence across multiple JPY crosses (EURJPY, AUDJPY, CADJPY). This area has historically triggered strong upside momentum, and the current setup aligns with both technical structure and macro drivers.
📊 Fundamentals Supporting the Move:
✅ US Yields Stable: US10Y is holding above 4.20%, keeping USDJPY supported. If yields push back toward 4.30%, expect USDJPY to retest 145.30 and potentially 147.80.
✅ BoJ Dovish: Japan shows no shift in policy. Despite weak Tankan data, BoJ remains patient, and no meaningful rate hike or YCC change is expected soon.
✅ USD Macro Resilience: Core PCE held firm at 2.6%. Focus now shifts to ISM Services PMI (Wed) and NFP (Fri). Markets are still pricing a soft landing – supporting risk-on and a stronger USD.
✅ JPY as a Fading Safe Haven: Even with geopolitical headlines (Trump tariff tensions, Taiwan, Middle East), JPY demand remains weak. Traders are favoring USD and Gold over JPY as risk hedges.
⚠️ Risks to Watch:
Dovish US Data Surprise: Weak NFP or ISM could drag yields down and trigger USDJPY reversal.
Verbal or Actual BoJ Intervention: If we approach 148.50–150, Japan may step in again.
Geopolitical Escalation: Any sharp risk-off could trigger safe haven demand for JPY, though this has underperformed recently.
🔎 Correlation Dynamics:
📈 USDJPY is leading JPY crosses like EURJPY and AUDJPY. The recent bounce started simultaneously across the JPY complex, with USDJPY slightly ahead.
📉 If US yields drop or risk sentiment shifts, USDJPY may lag gold or bonds but eventually catch up.
🧠 Trading Plan:
📍 Entry Zone: 143.30–143.60 (trendline + Fib confluence)
🎯 Target 1: 145.30 (38.2% Fib)
🎯 Target 2: 147.80 (channel resistance)
🛑 Invalidation: Daily close below 141.50 with US yields breaking down
📅 Upcoming Events to Watch:
Wed July 3: ISM Services PMI (key for USD reaction)
Fri July 5: US Non-Farm Payrolls + Average Hourly Earnings
JPY Risk: Verbal intervention possible near 148+
🧭 Summary:
USDJPY is positioned for a bullish continuation, backed by:
Rising yields
Resilient US macro
Weak JPY fundamentals
Technical structure respecting trendline support
Short-term traders can target the 145–147.80 range ahead of NFP, with a tight eye on yield and risk sentiment.
📌 If this analysis helps, drop a like and follow for more real-time macro-technical breakdowns. Stay nimble ahead of NFP! 🧠📈

BULLISH H4 MOMENTUM ACTIVATED...?📊 Pattern & Structure:
The chart shows a downward channel (falling wedge) pattern that has recently been broken to the upside, indicating a bullish breakout.
The breakout is clean, with a sharp upward move, confirming the reversal from the bearish trend.
🔍 Key Levels Identified:
Support Zone:
142.284 – 141.790 (marked with an orange box)
This zone acted as a strong demand/support area.
Price bounced strongly after reaching this zone.
Immediate Resistance Levels:
145.799 – Near-term resistance.
147.000 – 147.629 – Key resistance zone (highlighted with a red horizontal line).
148.725 – Final bullish target/resistance on the chart.
📈 Bullish Scenario (highlighted with arrows and wave projection):
Price has broken out of the falling wedge, retested, and is pushing higher.
Target zone: 147.000–148.725.
The chart suggests a bullish projection, with further gains expected if the price sustains above 145.47.

USDJPY 30Min Engaged ( Bullish Entry Detected )➕ Objective: Precision Volume Execution
Time Frame: 30-Minute Warfare
Entry Protocol: Only after volume-verified breakout
🩸 Bullish Break : 145.100
➗ Hanzo Protocol: Volume-Tiered Entry Authority
➕ Zone Activated: Dynamic market pressure detected.
The level isn’t just price — it’s a memory of where they moved size.
Volume is rising beneath the surface — not noise, but preparation.
🔥 Tactical Note:
We wait for the energy signature — when volume betrays intention.
The trap gets set. The weak follow. We execute.
USD/JPY Range- weekly chart setupUSD/JPY abhi ek strong range-bound structure mein trade kar raha hai jisme clearly defined support aur resistance zones dikhai de rahe hain. Chart par price 144.50 ke aas paas consolidate kar raha hai, jahan se dono directions mein breakout ka potential bana hua hai.
📉 Resistance Zone: 145.80 – 146.20
📈 Support Zone: 142.30 – 142.70
🔍 Current Price: 144.50 (As of July 6, 2025)
🧠 Trading Scenarios:
🔽 Bearish Scenario:
Agar price 145.80 zone se reject hota hai, to short-term selling pressure dekhne ko mil sakta hai, jisme target 1: 143.50 aur target 2: 142.50 ka ho sakta hai.
🔼 Bullish Scenario:
Agar price support zone (142.50) se strong bounce karta hai, to range ke upper bound (145.80) tak ka upside move expected hai. Breakout ke baad extended target 147.00+ tak ho sakta hai.
📊 Timeframe: 4H
📍 Setup Type: Range Trade | Mean Reversion | Breakout Watch
💬 Idea by: Liquidity_Gold_FX
🔔 Follow for more FX setups and updates.

USD/JPY - H1- Wedge Breakout (07.07.2025)The USD/JPY pair on the H1 timeframe presents a Potential Buying Opportunity due to a recent Formation of a Wedge Breakout Pattern. This suggests a shift in momentum towards the upside and a higher likelihood of further advances in the coming hours.
Possible Long Trade:
Entry: Consider Entering A Long Position around Trendline Of The Pattern.
Target Levels:
1st Resistance – 148.00
🎁 Please hit the like button and
🎁 Leave a comment to support for My Post !
Your likes and comments are incredibly motivating and will encourage me to share more analysis with you.
Best Regards, KABHI_TA_TRADING
Thank you.
Disclosure: I am part of Trade Nation's Influencer program and receive a monthly fee for using their TradingView charts in my analysis.

Lingrid | USDJPY Pullback From the Key Resistance ZoneThe price perfectly fulfilled my previous idea . FX:USDJPY is moving inside an upward channel after reclaiming support near 145.25 and breaking out from its previous range. The pair printed a higher low and is now approaching resistance around 146.78, testing the upper boundary of the ascending channel. If it fails to break through the red resistance trendline, a retracement toward the 145.25–145.00 support is likely.
📈 Key Levels
Buy zone: 146.78 - 147.00
Sell trigger: rejection from 146.78 and lower high below resistance
Target: 145.25
Buy trigger: bullish breakout above 147.00 with momentum confirmation
💡 Risks
Price rejection near 146.78 may cause a sharp pullback
A surge above 147.00 breaks trendline structure
Market reaction to macro data could distort short-term pattern
If this idea resonates with you or you have your own opinion, traders, hit the comments. I’m excited to read your thoughts!

USDJPY h4 strongly downBearish Expectation Disruption / Bullish Counterpoint
Resistance (147.5) Rejection and drop Breakout and continuation toward 148.5+
Breakout FVG Fakeout and reversal True breakout — bullish trend continues
Bullish Zone (~144) Clean break below Accumulation zone, strong buying interest may emerge
Target (~143) Next leg down May not be reached if price stabilizes above 145
Support (~142.5) Final drop destination Could become irrelevant if trend flips decisively bullish Original Assumption: Market is behaving in isolation from fundamentals.
Disruption: If U.S. data (e.g., strong NFP, CPI, or Fed commentary) supports rate hikes, USD/JPY may remain bid and breakout to 148+ instead of reversing.
Watch For: Strong dollar narrative or dovish BOJ language.

End of Week analysis (USDJPY)Sorry for the late video but we are looking good for another continuation day. we have some strong bullish momentum now to tap into that untapped daily wick. from there we will see some strong resistance.
Happy trading everyone hope everyone had a great week.

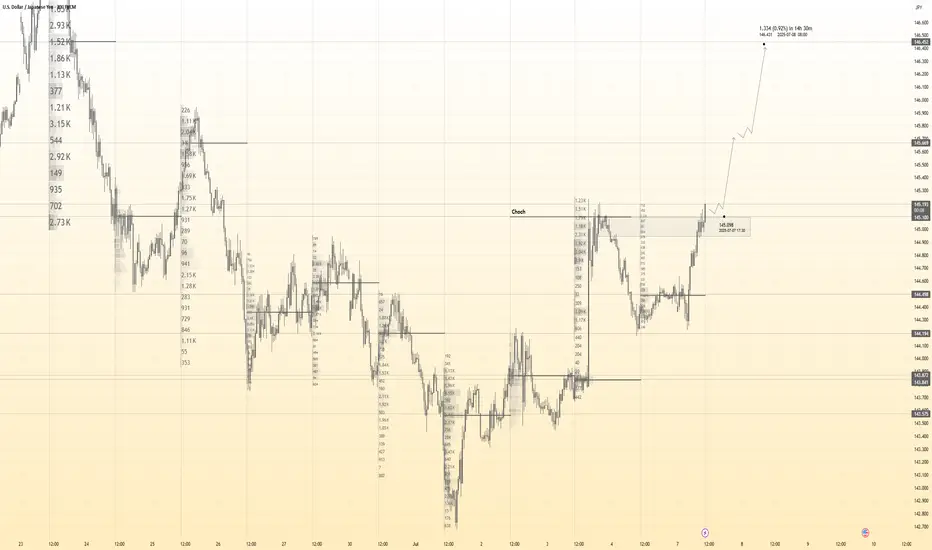
#USDJPY: Price is currently accumulating ! Wait For DistributionAt present, the USDJPY currency pair appears to be in an accumulation phase, as evidenced by the absence of significant price movement throughout the current week. Several factors contribute to this trend.
Firstly, several significant economic events are scheduled for this week, particularly tomorrow and Friday. These developments hold substantial implications for the future trajectory of the USDJPY pair. Consequently, there exists a possibility that the price may experience a decline prior to initiating a bullish trend.
Secondly, there are two primary areas where the price could reverse its course. The extent to which the USD reacts to the economic data will serve as an indicator of the potential reversal zones.
It is imperative that you conduct your own analysis before making any financial decisions. This chart should be utilised solely for educational purposes and does not guarantee any specific outcome.
Regarding the stop loss, as this is a swing trade, it is advisable to employ a larger stop loss if the price reaches entry zones. The take profit level can be determined based on your entry type and analysis.
We wish you the best of luck in your trading endeavours and emphasise the importance of trading safely.
Kindly share this analysis with others through likes, comments, and social media platforms. If you have any questions or require further assistance, please do not hesitate to comment below. We are here to provide support.
Team Setupsfx_
❤️🚀
MarketBreakdown | USDJPY, USDCAD, BITCOIN, SILVER
Here are the updates & outlook for multiple instruments in my watch list.
1️⃣ #USDJPY daily time frame 🇺🇸🇯🇵
The market nicely respected a rising trend line
and bounced from that, forming a high momentum bullish candle.
I think that the pair will continue rising and reach 145.8 level soon.
2️⃣ #USDCAD daily time frame 🇺🇸🇨🇦
The price is currently approaching an important confluence
zone based on a falling trend line and a horizontal support.
I will expect a pullback from that.
3️⃣ #BITCOIN #BTCUSD daily time frame
The price successfully violated a resistance line of a bullish
flag pattern and closed above that.
It is a critical bullish signal. I believe that the price will test
a current high then and will violate that with a high probability.
4️⃣ #SILVER #XAGUSD daily time frame 🪙
The market broke a resistance line of a bullish flag.
Uptrend is going to continue, and the price is going to reach 37,14 level soon.
Do you agree with my market breakdown?
❤️Please, support my work with like, thank you!❤️
I am part of Trade Nation's Influencer program and receive a monthly fee for using their TradingView charts in my analysis.

USDJPY: Pullback From SupportI believe that 📈USDJPY could bounce up from the highlighted intraday support.
I see 2 bullish breakout confirmations:
bullish breakouts of a neckline of a cup and handle pattern and a resistance line of a falling wedge pattern.
Goal - 144.67

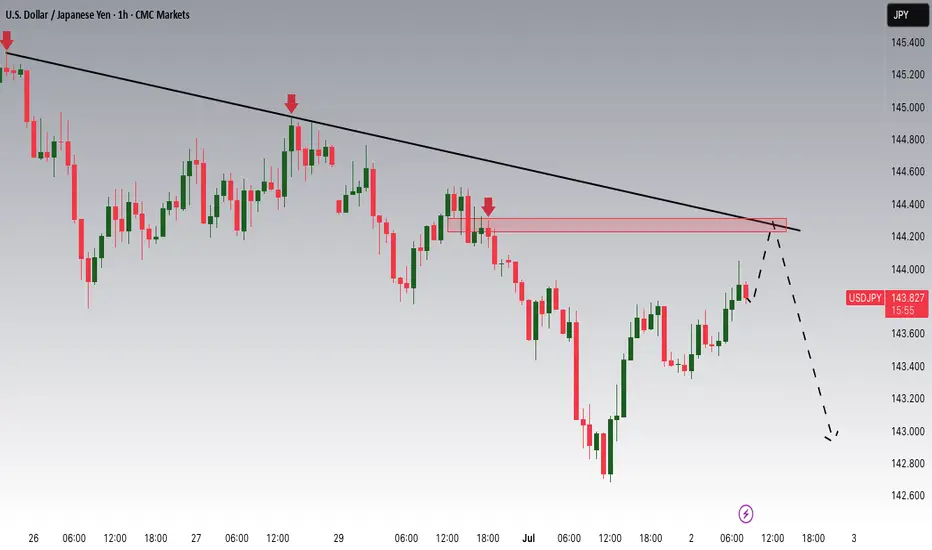
USDJPY Potential DownsidesHey Traders, in today's trading session we are monitoring USDJPY for a selling opportunity around 144.200 zone, USDJPY is trading in a downtrend and currently is in a correction phase in which it is approaching the trend at 144.200 support and resistance area.
Trade safe, Joe.
USDJPY 1:3 4HR Trade Idea - ICTBeautiful 1:3 Trade idea on USDJPY - I am bearish on DXY and also bearish on JXY but the pair itself is shifting bullish so I am more inclined into a long (this is due to JXY dropping more rapidly than DXY shifting it bullish).
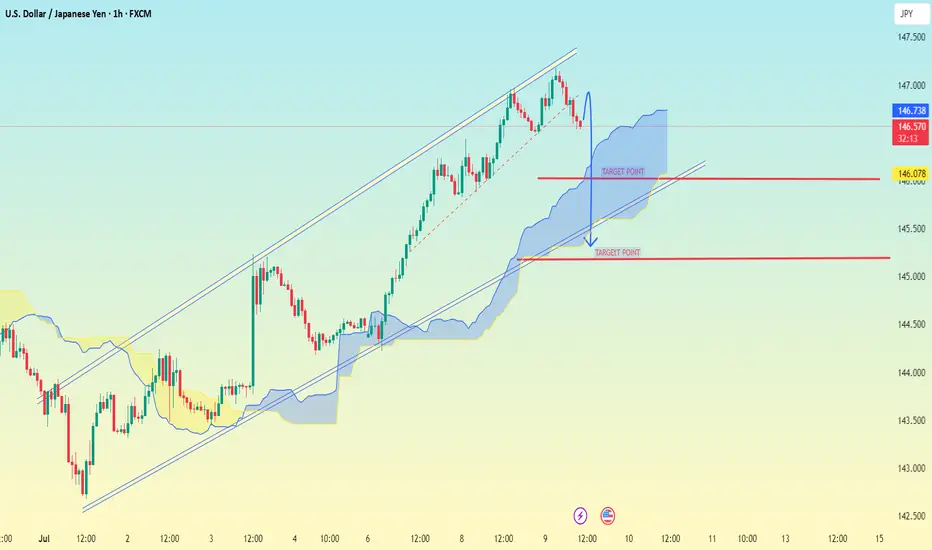
USD/JPY 1H chart PATTERNUSD/JPY 1H chart, the pair has broken below an ascending channel, which is typically a bearish signal. The price is currently inside the Ichimoku cloud, indicating uncertainty, but a breakdown seems likely.
📉 Bearish Target Points:
1. First Target:
✅ 146.078 — Near the bottom edge of the Ichimoku cloud and a horizontal support level.
2. Second Target:
✅ 145.300 — Clear support zone below the cloud, also aligns with previous consolidation area.
---
🔎 Additional Notes:
A breakdown below the Ichimoku cloud will confirm stronger bearish momentum.
Watch for a retest of the lower trendline or cloud support before a deeper drop.
Use stop-loss above 146.80 to manage risk if you're trading this setup.
Let me know if you want a buy/sell entry recommendation or SL/TP planning.
USD/JPY Bearish Flag (30.06.2025)The USD/JPY Pair on the M30 timeframe presents a Potential Selling Opportunity due to a recent Formation of a Bearish Flag Breakout Pattern. This suggests a shift in momentum towards the downside in the coming hours.
Possible Short Trade:
Entry: Consider Entering A Short Position around Trendline Of The Pattern.
Target Levels:
1st Support – 143.40
2nd Support – 142.86
🎁 Please hit the like button and
🎁 Leave a comment to support for My Post !
Your likes and comments are incredibly motivating and will encourage me to share more analysis with you.
Best Regards, KABHI_TA_TRADING
Thank you.
Disclosure: I am part of Trade Nation's Influencer program and receive a monthly fee for using their TradingView charts in my analysis.

08.07.25 Morning ForecastPairs on Watch -
FX:EURUSD
FX:USDJPY
A short overview of the instruments I am looking at for today, multi-timeframe analysis down to what I will be looking at for an entry. Enjoy!

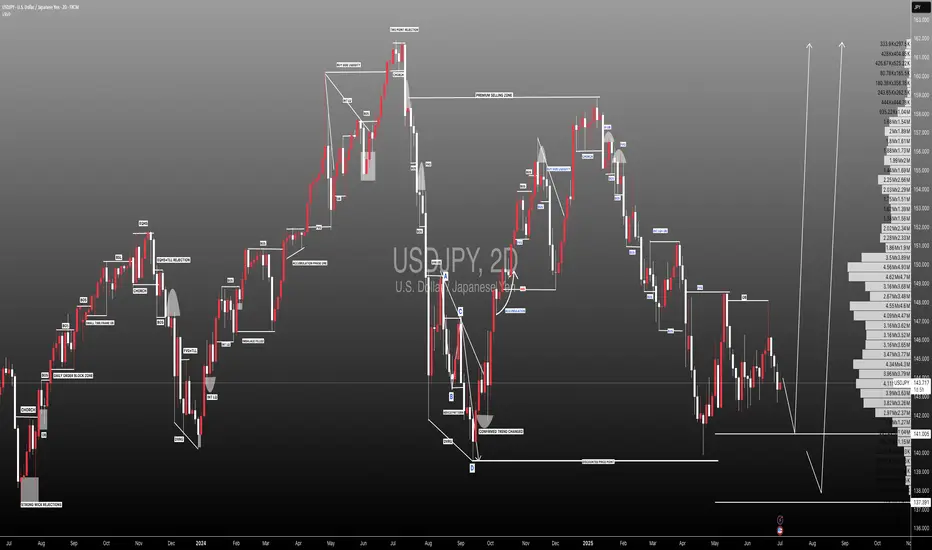
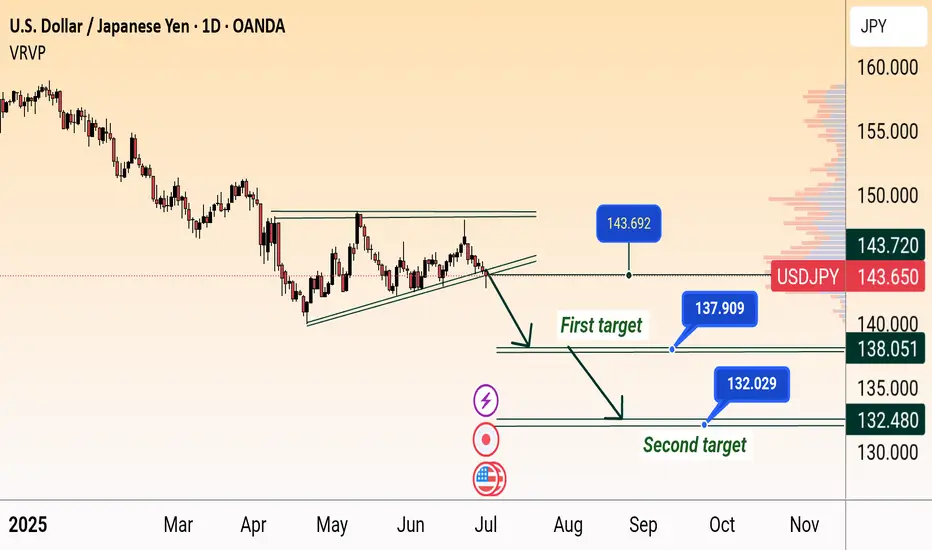
USD/JPY Bearish Breakdown Targets 138 & 132USD/JPY Bearish Breakdown Setup (Daily Chart)
USD/JPY breaks below rising wedge support near 144, signaling potential downside. Price targets are marked at 138.051 (first target) and 132.480 (second target), indicating possible continued weakness if the bearish momentum holds.
USDJPY TRADE SETUPMarket trend is broken i hope this week continue to up so let's see what happenned guys

USD/JPY) Back support level Read The captionSMC trading point update
Technical analysis of USD/JPY pair using a combination of price action, resistance/support levels, and indicators. Here's a breakdown of the idea behind the analysis:
---
Chart Breakdown (2H - USD/JPY)
1. Key Zones:
Resistance Level (Yellow Box at Top):
Price has previously been rejected from this zone multiple times.
Recent bearish wicks and aggressive sell-offs are marked by red arrows—showing strong seller interest.
Support Level / Target Point (Bottom Yellow Box):
Price has found strong buying interest around 142.142.
This zone is the anticipated downside target if the bearish scenario plays out.
2. Bearish Bias Justification:
Liquidity Grab / Fakeout (labeled “fug”):
The price briefly broke above the smaller resistance block but quickly reversed.
This "fake breakout" often traps buyers, strengthening the bearish case.
EMA 200 (Blue Line):
Price is currently near or slightly under the 200 EMA (144.553), suggesting a potential rejection area aligning with resistance.
RSI Indicator:
RSI shows divergence and has not confirmed a bullish breakout.
The values (56.77 and 42.82) indicate loss of bullish momentum.
3. Projection (Black Lines):
The black zig-zag lines represent a forecasted drop to the support level.
Suggests a short setup near 144.50–145.00 with targets near 142.14.
Mr SMC Trading point
---
Summary:
Bias: Bearish
Entry Zone: Near resistance area (144.50–145.00)
Target: 142.142 (support zone)
Invalidation: Strong break above 145.00 and hold
Confirmation: Rejection from resistance with bearish candle pattern
---
Please support boost 🚀 this analysis)

Sell USDJPYFor the first time, I have done some fundamental analysis. Last time NFP release was on a Thursday due to Bank Holiday was July 2020 where the USD gained on the news release but later gave up the gains. I am expecting a pullback

Trading Recommendations and Analysis for USDJPYThe technical picture on Monday may shape future developments in the medium term. The week began a gap up, followed by the formation of a long upper shadow. The daily close occurred exactly at the support level of 146.11 thereby closing the gap.
Today's trading also opened exactly at the same level, and the candle is already black in the early hours of trading. This defines Monday's movement as false, thus creating a strong bearish signal, with a potential breakdown of the 143.45 support and a subsequent decline toward the MACD line, which coincides with the target level of 141.70. The Marlin oscillator has turned downward. its return to negative territory will add additional pressure on the price.
In the H4 timeframe, the price has consolidated below the 146.11 level, making it easier to settle below the MACD line eventually.
A break below 145.48 -the June 11 high-will serve as confirmation. The Marlin oscillator appears to be fixed in bearish territory and has joined the new downward movement.
