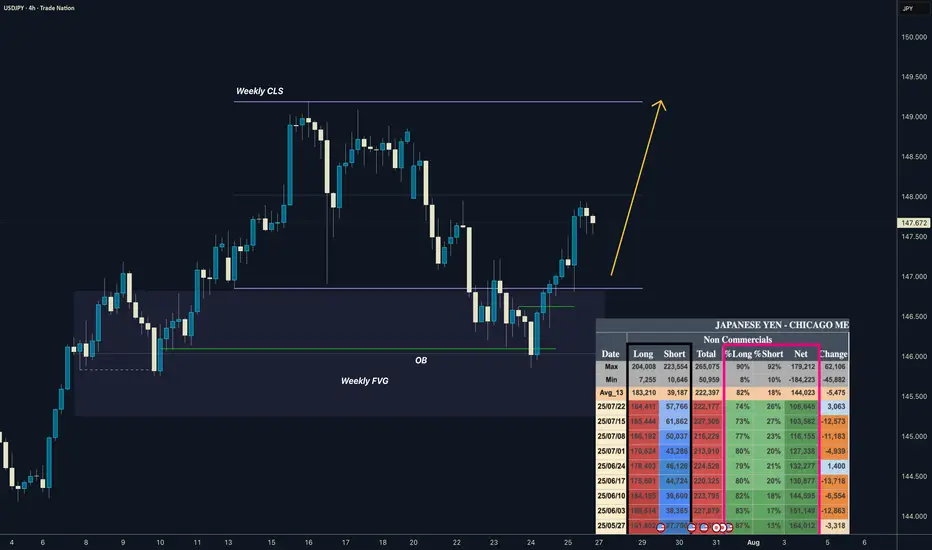
USDJPY I Weekly CLS I Model 1 / 2 I COT Bullish ASFYo Market Warriors ⚔️
Fresh Crypto Analysis— if you’ve been riding with me, you already know:
🎯My system is 100% mechanical. No emotions. No trend lines. No subjective guessing. Working all timeframes. Just precision, structure, and sniper entries.
🧠 What’s CLS?
It’s the real smart money. The invisible hand behind $7T/day — banks, algos, central players.
📍Model 1:
HTF bias based on the daily and weekly candles closes,
Wait for CLS candle to be created and manipulated. Switch to correct LTF and spot CIOD. Enter and target 50% of the CLS candle.
For high probability include Dealing Ranges, Weekly Profiles and CLS Timing.
Analysis done on the Tradenation Charts
Disclosure: I am part of Trade Nation's Influencer program and receive a monthly fee for using their TradingView charts in my analysis.
Trading is like a sport. If you consistently practice you can learn it.
COT Data
we can see reduced longs exposure and increasing shorts on JPY contract which is clear signs of bullishness confirmed by decreasing Net positions.
“Adapt what is useful. Reject whats useless and add whats is specifically yours.”
David Perk aka Dave FX Hunter
💬 Comment any Coin I ll give you my quick view
USDJPY trade ideas
Lingrid | USDJPY Potential Channel Breakout. LongFX:USDJPY is retesting the breakout zone after reclaiming support from a prior swap area near 146.9. Price action has broken above a downward trendline and is forming a bullish retest structure. As long as USDJPY holds above 146.920 zone, the setup favors a continuation toward the resistance barrier. A breakout above the red descending trendline could accelerate upside momentum.
📉 Key Levels
Buy trigger: Break and hold above 147.500
Buy zone: 146.900 – 147.000
Target: 148.250
Invalidation: Break below 146.000
💡 Risks
Failure to break the descending red trendline may trigger renewed selling
Consolidation below resistance could signal buyer exhaustion
Break below 146.000 would invalidate bullish retest setup
If this idea resonates with you or you have your own opinion, traders, hit the comments. I’m excited to read your thoughts!

USD/JPY on the 1D timeframeBased on the chart I provided for USD/JPY on the 1D timeframe, here is the target analysis:
📉 Downtrend Analysis:
The chart is showing a descending channel, indicating a bearish trend.
Price has been respecting the upper and lower bounds of the channel.
Two target zones are marked with labels “TakeProfit”, suggesting projected bearish targets.
🎯 Identified Targets:
1. First Target Zone (TakeProfit):
📍 Around 152.00
This is the first expected support area where price may bounce or consolidate.
2. Second Target Zone (TakeProfit):
📍 Around 146.50 – 146.00
This level aligns with historical support and volume profile concentration.

USDJPY Breakout and Potential RetraceHey Traders, in today's trading session we are monitoring USDJPY for a buying opportunity around 146.300 zone, USDJPY was trading in a downtrend and successfully managed to break it out. Currently is in a correction phase in which it is approaching the retrace area at 146.300 support and resistance area.
Trade safe, Joe.

USDJPY Short Setup: Trend Reversal Confirmation in ProgressAfter waiting patiently for nearly two weeks, price action on USDJPY is finally beginning to align with bearish expectations. The current setup shows signs of exhaustion in the bullish momentum, with a rejection near the 147.80–148.00 zone — a key area of interest.
🔍 Entry thesis:
Price is reacting below previous highs.
EMAs are starting to compress and slope downward.
Potential change of character (CHOCH) forming on lower timeframes.
🎯 Trade parameters:
Entry: 147.72
SL: 147.99
TP: 146.35
Risk/Reward: ~5:1
This move could unfold progressively throughout the week, especially as we approach the end-of-month flows and increased USD volatility. I’ll continue to monitor structure and volume for confirmation.

USDJPY: Bullish Move From Support Ahead! 🇺🇸🇯🇵
I think that there is a high chance that USDJPY will continue growing
next week.
A bullish breakout of a resistance line of a flag pattern that occurred
after a test of a key support provides a strong bullish signal.
Goal - 148.7
❤️Please, support my work with like, thank you!❤️
I am part of Trade Nation's Influencer program and receive a monthly fee for using their TradingView charts in my analysis.

USD/JPY Rejection Trade: Short from ResistanceUSD/JPY 1H Short Setup
Price entered a key resistance zone near 148.700–148.850 and formed a rejection. A short position is triggered with a stop loss above the resistance and target at 147.856 support. Bearish momentum expected.

USDJPY 30Min Engaged (Buy & Sell Reversal Entry's Detected )Time Frame: 30-Minute Warfare
Entry Protocol: Only after volume-verified breakout
🩸Bullish Reversal - 148.350
🩸Bearish Reversal - 148.370
➗ Hanzo Protocol: Volume-Tiered Entry Authority
➕ Zone Activated: Dynamic market pressure detected.
The level isn’t just price — it’s a memory of where they moved size.
Volume is rising beneath the surface — not noise, but preparation.
🔥 Tactical Note:
We wait for the energy signature — when volume betrays intention.
The trap gets set. The weak follow. We execute.

25.07.25 Morning ForecastPairs on Watch -
FX:USDJPY
CAPITALCOM:DE40
FX:GBPUSD
FX:AUDUSD
A short overview of the instruments I am looking at for today, multi-timeframe analysis down to what I will be looking at for an entry. Enjoy!

USDJPY 30Min Engaged ( Bullish Entry Detected )————-
➕ Objective: Precision Volume Execution
Time Frame: 30-Minute Warfare
Entry Protocol: Only after volume-verified breakout
🩸 Bullish From now Price : 146.500
➗ Hanzo Protocol: Volume-Tiered Entry Authority
➕ Zone Activated: Dynamic market pressure detected.
The level isn’t just price — it’s a memory of where they moved size.
Volume is rising beneath the surface — not noise, but preparation.
🔥 Tactical Note:
We wait for the energy signature — when volume betrays intention.
The trap gets set. The weak follow. We execute.

Lingrid | USDJPY Possible Strong Bullish RallyThe price perfectly fulfilled my previous idea . FX:USDJPY is trading within an upward channel after forming a higher low near the 147.50 zone, bouncing from the support trendline. Price action suggests a bullish structure continuation toward the 150.95 resistance, especially if the recent consolidation breaks higher. The overall formation aligns with a healthy correction phase before a potential push into the resistance area. Confirmation above 148.60 would likely accelerate the bullish move.
📌 Key Levels Buy zone: 147.50–147.25
Sell trigger: Below 147.00
Target: 150.95
Buy trigger: Break above 148.80
⚠️ Risks
Break below 147.50 may shift sentiment bearish
Strong resistance awaits near 150.00
Broader market volatility could invalidate pattern
If this idea resonates with you or you have your own opinion, traders, hit the comments. I’m excited to read your thoughts!

USDJPY Potential UpsidesHey Traders, in today's trading session we are monitoring USDJPY for a buying opportunity around 147.800 zone, USDJPY is trading in an uptrend and currently is in a correction phase in which it is approaching the trend at 147.800 support and resistance area.
Trade safe, Joe.

USDJPY BullishAfter exiting a correction, the first impulse (Wave 1) appears. I expect a retracement of at least 50% of the Fibonacci.

USDJPY 30Min Engaged ( BULLISH & Bearish Break Entry Detected )Time Frame: 30-Minute Warfare
Entry Protocol: Only after volume-verified breakout
🩸Bullish Break- 148.750
🩸Bearish Break- 148.370
➗ Hanzo Protocol: Volume-Tiered Entry Authority
➕ Zone Activated: Dynamic market pressure detected.
The level isn’t just price — it’s a memory of where they moved size.
Volume is rising beneath the surface — not noise, but preparation.
🔥 Tactical Note:
We wait for the energy signature — when volume betrays intention.
The trap gets set. The weak follow. We execute.

USDJPY 30Min Engaged ( Bearish Reversal Entry Detected )Time Frame: 30-Minute Warfare
Entry Protocol: Only after volume-verified breakout
🩸Bearish Retest - 148.450
➗ Hanzo Protocol: Volume-Tiered Entry Authority
➕ Zone Activated: Dynamic market pressure detected.
The level isn’t just price — it’s a memory of where they moved size.
Volume is rising beneath the surface — not noise, but preparation.
🔥 Tactical Note:
We wait for the energy signature — when volume betrays intention.
The trap gets set. The weak follow. We execute.
USD/JPY Technical Analysis - 4h Chart (Jul 24, 2025)
Key Observations:
Price Action (4h Close):
Open (O): 146.545
High (H): 146.660
Low (L): 146.448
Close (C): 146.473
Change: -0.036 (-0.028%) → Slight bearish momentum.
50% - Order Block:
Indicates a key retracement level where institutional traders may have placed orders.
Current price near 146.473 suggests potential consolidation or reversal if this level holds.
Profit Levels (Potential Targets):
Bullish Scenario (if USD strengthens):
147.170 → Minor resistance
147.956 → Stronger resistance
148.637 & 150.140 → Major upside targets
Bearish Scenario (if JPY strengthens):
146.450 → Immediate support
145.780 → Next key support
Context:
August Seasonal Trend: JPY often sees volatility in August due to fiscal flows and BoJ policy expectations.
Trading View Indicator: Likely referencing a custom strategy (e.g., breakout/mean reversion).
Trading Bias:
Neutral to Slightly Bearish (price closed below open, testing mid-range levels).
Watch 146.450 (support) and 147.170 (resistance) for breakout confirmation.
Key Levels:
Resistance Support
147.170 146.450
147.956 145.780
148.637
Actionable Idea:
A break below 146.450 could target 145.780.
A rebound above 147.170 opens path to 147.956.

Key Observations 1. Rectangle + Double Top (“Top 2”) Formation (left side):
• Price ranged between ~147.5 and ~149.5.
• A double top inside the rectangle signaled resistance and potential reversal.
• Breakdown from the rectangle zone occurred, confirming bearish momentum.
2. Rising Wedge Pattern (right side, green zone):
• A bearish pattern forming higher highs and higher lows.
• The red arrow indicates an expected breakdown from the wedge.
3. Bearish Price Projection (blue arrows):
• The chart projects a sharp drop following the wedge breakdown.
• Multiple target levels are marked:
• First Target: ~147.0 zone.
• Final Target: Near 144.0, aligning with the measured move from previous breakdown.
4. Confluence of Bearish Signals:
• Rectangle breakdown + rising wedge.
• Bearish candle rejection near 149 resistance.
• Pattern-based technical targets drawn using past behavior.

USDJPY Falling Fast Bearish Momentum or Reversal Zone?USDJPY has dropped significantly and is now trading around 147.730, nearing a key historical support zone near 147.20 – 147.00.
This area previously acted as a strong demand zone and may trigger a bounce or a breakdown depending on market sentiment.
🔹 Technical Overview (4H Chart):
• Current Price: 147.73
• Support Zone: 147.20 – 147.00
• Resistance: 149.00
• Breakdown Target: 145.80
• Possible Bounce Target: 148.80 – 149.30
📊 Bias:
I'm watching this zone closely.
• If price holds above 147.00 with bullish candle – Long Setup toward 149.00
• If price breaks below 147.00 and closes on 4H – Short Setup toward 145.80
⚠️ Use tight SL below support zone if buying.

USDJPY Will Fall! Short!
Take a look at our analysis for USDJPY.
Time Frame: 1D
Current Trend: Bearish
Sentiment: Overbought (based on 7-period RSI)
Forecast: Bearish
The price is testing a key resistance 147.661.
Taking into consideration the current market trend & overbought RSI, chances will be high to see a bearish movement to the downside at least to 145.139 level.
P.S
The term oversold refers to a condition where an asset has traded lower in price and has the potential for a price bounce.
Overbought refers to market scenarios where the instrument is traded considerably higher than its fair value. Overvaluation is caused by market sentiments when there is positive news.
Disclosure: I am part of Trade Nation's Influencer program and receive a monthly fee for using their TradingView charts in my analysis.
Like and subscribe and comment my ideas if you enjoy them!

Simple SMC Short Setup on USDJPY (15min TF)Here’s a short trade idea I’m watching on USDJPY using basic Smart Money Concepts (SMC).
🔍 What I saw:
The market made a Break of Structure (BOS) to the downside.
A Change of Character (CHoCH) confirmed that the trend might be shifting.
After the drop, price retraced back to a supply zone in the premium area—right near a swing high.
I also noticed a trendline liquidity sweep, which adds more confluence that this could be a trap before a drop.
📉 Plan:
Waited for price to tap the zone and react before entering short.
Stop loss is above the swing high (to protect against fakeouts).
Targeting the recent low for a potential clean move down.
This setup uses no indicators—just price action, supply & demand, and simple structure.
Drop your thoughts or questions below—I’m always open to feedback!

USDJPY 30Min Engaged (Buy & Sell Reversal Entry's Detected )Time Frame: 30-Minute Warfare
Entry Protocol: Only after volume-verified breakout
🩸Bullish Reversal - 148.750
🩸Bearish Reversal - 150.100
➗ Hanzo Protocol: Volume-Tiered Entry Authority
➕ Zone Activated: Dynamic market pressure detected.
The level isn’t just price — it’s a memory of where they moved size.
Volume is rising beneath the surface — not noise, but preparation.
🔥 Tactical Note:
We wait for the energy signature — when volume betrays intention.
The trap gets set. The weak follow. We execute.

How to ENTER A TRADE - USDJPY BUY trade EXPLAINED!!!Determining the direction of an asset you wish to trade is relatively easy, the difficult part is finding the best entry. In this vid we look at reasons to enter a trade and analyze a current live buy trade on USDJPY

USDJPY: Confirmed CHoCH & Bullish OutlookI spotted a confirmed Change of Character on 📈USDJPY on 4-hour timeframe.
The market, currently in a global bullish trend, has effectively broken through a minor bearish trend and surpassed a key horizontal resistance level.
It is likely to continue rising, with the next resistance at 149.00.
