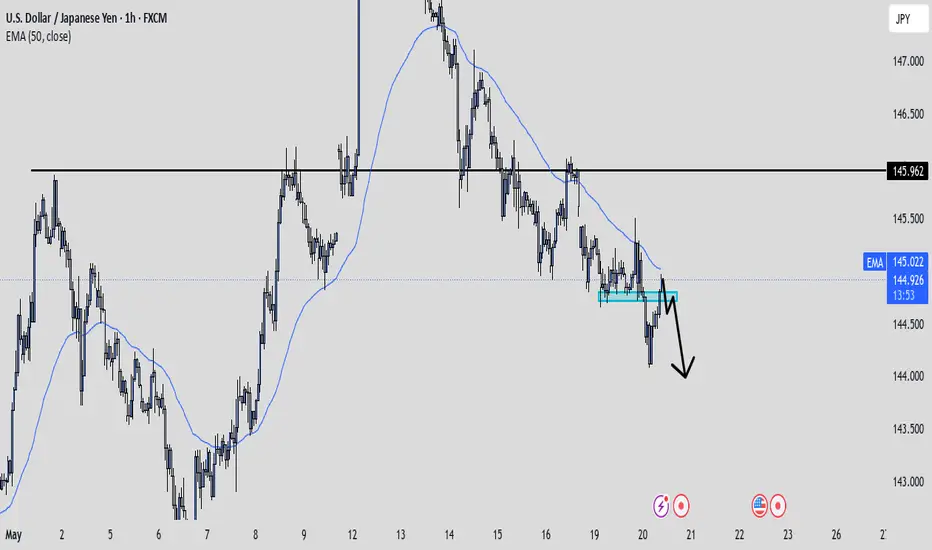
USD/JPY - H1 - Channel Breakout (17.05.2025) The Pair on the H1 timeframe presents a Potential Selling Opportunity due to a recent Formation of a Channel Breakout Pattern. This suggests a shift in momentum towards the downside in the coming hours.
Possible Short Trade:
Entry: Consider Entering A Short Position around Trendline Of The Pattern.
Target Levels:
1st Support – 142.40
2nd Support – 140.17
🎁 Please hit the like button and
🎁 Leave a comment to support for My Post !
Your likes and comments are incredibly motivating and will encourage me to share more analysis with you.
Best Regards, KABHI_TA_TRADING
Thank you.
Disclosure: I am part of Trade Nation's Influencer program and receive a monthly fee for using their TradingView charts in my analysis.
USDJPY trade ideas

USDJPY:Is it a beginning of major bullish trend? Read CaptionThe price of USDJPY has shown a mixed volume, making it difficult to determine the trend. However, if we analyse the data, we can see that USD is gaining strength in the coming time. This could be due to the strong news coming in this week, which may divert the USDJPY towards the 150 price region. There are four potential targets that price could hit and surpass. Please use this analysis solely for educational purposes, as it does not provide any guarantees.
Good luck and trade safely.
Thanks for your support! 😊
If you’d like to help us out, here are a few things you can do:
- Like our ideas
- Comment on our ideas
- Share our ideas
Team Setupsfx_
❤️

USDJPY: Very Bearish Setup ExplainedI spotted a lot of bearish confirmations on 📉USDJPY on a 4H time frame:
A significant head and shoulders pattern was formed, and its neckline is broken.
As the right shoulder formed, a distinct horizontal trading range emerged, which also saw support being violated.
The neckline serves as an important horizontal support, and the market has broken through all of these levels.
We can expect further declines, with the next support level at 143.

Usd/Jpy intra-day Analysis 20-May-2025Disclaimer: easyMarkets Account on TradingView allows you to combine easyMarkets industry leading conditions, regulated trading and tight fixed spreads with TradingView's powerful social network for traders, advanced charting and analytics. Access no slippage on limit orders, tight fixed spreads, negative balance protection, no hidden fees or commission, and seamless integration.
Any opinions, news, research, analyses, prices, other information, or links to third-party sites contained on this website are provided on an "as-is" basis, are intended only to be informative, is not an advice nor a recommendation, nor research, or a record of our trading prices, or an offer of, or solicitation for a transaction in any financial instrument and thus should not be treated as such. The information provided does not involve any specific investment objectives, financial situation and needs of any specific person who may receive it. Please be aware, that past performance is not a reliable indicator of future performance and/or results. Past Performance or Forward-looking scenarios based upon the reasonable beliefs of the third-party provider are not a guarantee of future performance. Actual results may differ materially from those anticipated in forward-looking or past performance statements. easyMarkets makes no representation or warranty and assumes no liability as to the accuracy or completeness of the information provided, nor any loss arising from any investment based on a recommendation, forecast or any information supplied by any third-party.

USDJPY → Support retest. Is the trend continuing?FX:USDJPY is storming key support within the local downtrend. Pressure is intensifying the dollar's decline...
The dollar index is beginning to fall, which is also reflected in the currency pair.
Selling pressure is intensifying. A local downtrend is forming, with an attempt to break through key support at 144.82, below which the path to 143.4 - 142 opens up. Consolidation of the price below 144.82 could intensify the sell-off.
Resistance levels: 145.34, 146.07
Support levels: 144.82, 143.44, 142.35
Global and local trends are downward, and the fall of the dollar can only provide additional resistance, which will intensify the sell-off. A break of key support and consolidation of prices below 144.82 will trigger further sell-offs.
Best regards, R. Linda!

USDJPY - New Impulse Soon!Hello TradingView Family / Fellow Traders. This is Richard, also known as theSignalyst.
📈USDJPY has been overall bullish trading within the rising broadening wedge pattern marked in blue and it is currently hovering around the lower bound of it.
Moreover, the orange zone is a strong structure and support.
🏹 Thus, the highlighted blue circle is a strong area to look for buy setups as it is the intersection of structure and lower blue trendline acting as a non-horizontal support.
📚 As per my trading style:
As #USDJPY is around the blue circle zone, I will be looking for bullish reversal setups (like a double bottom pattern, trendline break , and so on...)
📈The bullish impulse will begin after a break above the last minor high and upper red trendline.
📚 Always follow your trading plan regarding entry, risk management, and trade management.
Good luck!
All Strategies Are Good; If Managed Properly!
~Rich
Disclosure: I am part of Trade Nation's Influencer program and receive a monthly fee for using their TradingView charts in my analysis.

USD/ JPY) bullish trend analysis Read The ChaptianSMC trading point update
Technical analysis of 4-hour for USD/JPY (U.S. Dollar vs Japanese Yen). Here's the breakdown of the idea
---
1. Bullish Structure
The market is moving within a rising channel, indicating a bullish trend.
Higher highs and higher lows support the uptrend.
---
2. Key Zones
Support Zone (Demand Area): Around the 144.500–145.000 level, price has reacted positively here multiple times — it's marked as a strong support level.
Resistance Zone: Around 148.000 — this level is marked as an obstacle before reaching the final target point.
---
3. Indicators & Confluence
EMA 200: Price is currently testing just above/below the EMA 200 — a key dynamic support/resistance level.
RSI: Showing a bullish divergence or a potential recovery from oversold zone (both RSI lines are turning upward).
MACD-style Oscillator (Custom): Showing signs of a bullish crossover, confirming upward momentum.
---
4. Projection & Target
The expected move is a bounce from support, followed by:
A retest of resistance around 148.
A continuation to the target zone at 150.864 — marked as the final target point.
The potential move is approximately +592 pips (4.19%).
Mr SMC Trading point
---
Conclusion
This is a bullish continuation setup, expecting price to maintain above the support zone and ride the trendline and channel toward 150.864. The confluence of RSI, structure, and EMA adds strength to the idea.
Pales support boost 🚀 analysis follow)

UJ Could Tumble Back To 140 If Bears Take Expanding RangeToday FX:USDJPY Sellers make a Breakout of the Rising Support of the Expanding Range it's been trading in since the Low that started the range back on April 22nd.
An Expanding Range is typically considered a Continuation Pattern suggesting that if Sellers can hold price under the Rising Support, we can suspect JPY to overcome USD in this pair pulling price down continuing the Downtrend it was in prior to entering the pattern.
Once the Breakout of Consolidation is Validated, a Breakout & Retest of the Rising Support could deliver potential Short Opportunities to take price down to the Low of the Range.
Fundamentally, there is a lot of worry about the fall out of Tariff Talks with important trade partners with the 90-Day grace period soon coming to an end, weakening labor market potentially signaling "Stagflation" and additionally, it is suspected that Trump's Tax Cut Bill could add $3 - $5 Trillion to the $36.2 Trillion debt the US is already suffering from, further harming the Dollar.
-https://www.tradingview.com/news/reuters.com,2025:newsml_L1N3RT018:0-dollar-on-defensive-as-traders-eye-trump-tax-bill-g7-currency-talks/
-https://www.tradingview.com/news/te_news:459470:0-dollar-extends-losses/

USDJPY LONG📘 Trading Journal Entry – USD/JPY
Date: May 16, 2025
Timeframe: 2H
Pair: USD/JPY
Direction: Long (Buy)
Entry Price: ~145.5
Stop Loss: 144.818
Take Profit: 149.254
Risk/Reward Ratio: ~1:5
🧠 Trade Idea & Reasoning:
I’ve re-entered this trade based on strong bullish control of the market. Price has returned to a key support zone near 145.470–145.539, showing signs of holding despite recent downside pressure. Sellers have attempted to push price lower, but failed to break cleanly below — suggesting a liquidity sweep may have occurred (noted near the W.O. level).
There is no clear evidence yet that sellers have taken control. The market structure is still bullish, and the recent consolidation near support indicates possible accumulation by buyers. Additionally, price is forming smaller candle bodies (reduced volatility), which may precede an expansion upward.
🔍 Technical Notes:
Support Zone Held: 145.470–145.539 range held firm.
W.O. Sweep: Potential stop hunt below support zone; a bullish sign.
Market Structure: Bullish higher timeframe structure still intact.
Risk Managed: Stop placed below liquidity zone to protect capital in case of failure.
🎯 Trade Management Plan:
Monitor Tokyo/London session for momentum confirmation.
Look for bullish engulfing candles or strong impulse moves to validate re-entry.
If price stalls near 147.000, partial profits may be taken.
If price re-tests 145.470 and fails again, I may add to the position with tighter risk.
🧾 Reflection:
This is a high R:R setup aligned with the prevailing bullish trend. I’m trading based on structure, not emotion, and will stick to my plan. The stop loss placement respects the invalidation zone, and I’m prepared to accept the risk in full.

USD/JPY Long Trade Setup – Key Support Rebound Targeting 148.674Entry Point:
Price: 143.373
The chart suggests initiating a long (buy) position at this level, which is just slightly below the current market price.
Stop Loss:
Price: 141.707
Positioned below a strong support zone. This level protects the trade from excessive downside risk if the price breaks down.
Target Point:
Price: 148.674
The target is clearly defined, indicating a potential gain of approximately 5.991 points, or 4.20% from the entry.
🟪 Support/Resistance Zones
The purple boxes indicate demand (support) and supply (resistance) zones.
The lower zone (entry/stop area) shows a historically significant support range that has been tested multiple times (indicated with orange circles).
The upper purple zone marks the take-profit area, which coincides with previous resistance.
📊 Moving Averages
Blue Line: 200 EMA (Exponential Moving Average) – acting as dynamic resistance.
Red Line: 50 EMA – price is currently trading below it, indicating bearish short-term pressure but potential for reversal.
🧠 Trade Idea Summary
Bias: Bullish (long position)
Risk-Reward Ratio: Favorable
Risk: ~1.67 points (from 143.373 to 141.707)
Reward: ~5.3 points (from 143.373 to 148.674)
Approx. R:R = 1:3.17
Validation: The setup relies on the price holding the key support zone and bouncing higher, targeting the next major resistance.
⚠️ Considerations
Monitor for bullish candlestick patterns near the entry zone.
Keep an eye on macroeconomic news (like BoJ or Fed updates) that could cause volatility in USD/JPY.
Confirm momentum shift with RSI or MACD if using indicators.

USDJPY I Daily CLS Nested In Weekly CLS, Model 1Hey, Market Warriors, here is another outlook on this instrument
If you’ve been following me, you already know every setup you see is built around a CLS range, a Key Level, Liquidity and a specific execution model.
If you haven't followed me yet, start now.
My trading system is completely mechanical — designed to remove emotions, opinions, and impulsive decisions. No messy diagonal lines. No random drawings. Just clarity, structure, and execution.
🧩 What is CLS?
CLS is real smart money — the combined power of major investment banks and central banks moving over 6.5 trillion dollars a day. Understanding their operations is key to markets.
✅ Understanding the behaviour of CLS allows you to position yourself with the giants during the market manipulations — leading to buying lows and selling highs - cleaner entries, clearer exits, and consistent profits.
🛡️ Models 1 and 2:
From my posts, you can learn two core execution models.
They are the backbone of how I trade and how my students are trained.
📍 Model 1
is right after the manipulation of the CLS candle when CIOD occurs, and we are targeting 50% of the CLS range. H4 CLS ranges supported by HTF go straight to the opposing range.
📍 Model 2
occurs in the specific market sequence when CLS smart money needs to re-accumulate more positions, and we are looking to find a key level around 61.8 fib retracement and target the opposing side of the range.
👍 Hit like if you find this analysis helpful, and don't hesitate to comment with your opinions, charts or any questions.
⚔️ Listen Carefully:
Analysis is not trading. Right now, this platform is full of gurus" trying to sell you dreams based on analysis with arrows while they don't even have the skill to trade themselves.
If you’re ever thinking about buying a Trading Course or Signals from anyone. Always demand a verified track record. It takes less than five minutes to connect 3rd third-party verification tool and link to the widget to his signature.
"Adapt what is useful, reject what is useless, and add what is specifically your own."
— David Perk aka Dave FX Hunter ⚔️

USD/JPY) support level back up Read The ChaptianSMC Trading point update
Technical analysis of USD/JPY on the 4-hour timeframe suggests a bullish setup with the following key insights:
Analysis Overview:
1. Current Price: 147.492
2. Support Zone: Around 145.263 to 146.000
Marked as "Support Level / FVG" (Fair Value Gap), this is the potential demand zone where the price may retrace before bouncing.
3. Trendline: An ascending trendline is supporting the bullish structure.
4. EMA 200: Price is trading above the 200 EMA (145.263), which is generally a bullish signal.
5. RSI Indicator:
RSI is near overbought levels (currently at 63.46 and 70.56), suggesting strong bullish momentum but a potential pullback.
6. Target Zone: 151.360
Highlighted as the "Target Point" – this is the resistance area where price might face selling pressure.
Mr SMC Trading point
Trade Idea:
Entry: Buy on retracement into the support zone (around 145.5–146.0).
Stop Loss: Below the support zone or EMA (around 144.800 or as per risk tolerance).
Take Profit: Near the target zone around 151.360.
Risk-to-Reward: Favorable, approximately 1:2.5 to 1:3 depending on the entry.
Conclusion:
The idea is based on price respecting support, fair value gap (FVG), bullish structure, and a target based on recent price projections. If the price respects the support and bullish trendline, the bullish continuation towards 151.360 is a valid expectation.
Pales support boost 🚀 analysis follow)

USDJPY COT and Liquidity AnalysisCOT Report Analysis:
Overall, we can still see red data for the USDJPY, but let's look at the shorts closely. You can see they are being reduced. Check the charts where I highlighted the reports and how I read them.
Hey, what up traders, another week, another COT data and Liquidity report. This is a big part of my FX Trading. I'm always trying to trade with the Big players, so knowing their positions is a good thing.
📍Please be aware that institutions report data to the SEC on Tuesdays and data are reported on Fridays - so again, we as retail traders have a disadvantage, but there is the possibility to read between the lines. Remember, in the report is what they want you to see; that's why prices mostly reverse on Wednesday after the report, so their cards are hidden as long as possible. However, if the trend is running, you can read it and use it to your advantage.
📍Tip: If the level has confluence with the high volume on COT, it can be strong support / Resistance.
Analysis done on the Tradenation Charts
Disclosure: I am part of Trade Nation's Influencer program and receive a monthly fee for using their TradingView charts in my analysis.
"Adapt what is useful, reject what is useless, and add what is specifically your own."
Have a great trading week, see in the next report.
— David Perk aka Dave FX Hunter ⚔️

BUY USDJPY
USDJPY Buy Bias Analysis – May 2025
I'm bullish on USDJPY following the strong reversal from the weekly demand zone at 139.901 touched on April 21, 2025. The pair has shown consistent bullish sentiment since April 22, confirming institutional interest and price strength.
Seasonality supports this move, with historical patterns favoring USD strength during this period.
From COT (Commitment of Traders) perspective , commercial institutions are heavily long USDJPY, further reinforcing the bullish outlook. Their positioning often reflects informed, long-term sentiment.
Moreover, recent flows into the japanese Yen as a safe haven appear to be unwinding. With the USD regaining momentum, a massive sell-off in the Yen is likely, providing strong upside pressure on USDJPY.
In conclusion, with technical support, seasonal tailwinds, and institutional backing, I maintain a strong buy bias on USDJPY .
FOLLOW ME FOR WEEKLY BIAS

USDJPY – Potential Reversal Setup from Key Demand Zone
After several days of consistent bearish momentum, price action on USDJPY has finally tapped into a well-defined demand zone just below 144.40 – an area previously tested with strong bullish reaction.
I’m now anticipating a potential **Change of Character (CHOCH)** as price forms a temporary floor. The rejection wick near 144.10 gives a hint of buyer interest, with confluence from a Fair Value Gap (FVG) and prior liquidity sweep.
📍 **Entry:** Around 144.38
📈 **Target Zones:**
→ First Target: 146.00 (structure retest)
→ Final Target: 148.66 (major liquidity pool and previous high)
❌ **Invalidation:** Break below 143.70
If this move plays out, we could be looking at a solid **Risk-to-Reward above 3:1**. Patience now is key – I’ll wait for a strong bullish engulfing to confirm momentum shift before scaling in.
🧠 *Note:* Fundamentals (Fed tone + JPY weakness) and macro sentiment could serve as accelerators.
---


UsdJpy Trade IdeaUJ is overall bearish on all time frames. We do have price currently sitting below a major level with bearish structures still in play. I'll personally be shorting the pair if price can break down below the level of resistance and retest to confirm the bearish continuation. Well see what happens. Price may also flip the resistance level into support to continue ranging so patience is gonna pay here.
USDJPY BULLISH OR BEARISH DETAILED ANALYSISUSDJPY is trading around the 143.00 level, and we’re now closely eyeing a potential breakdown. After a prolonged uptrend driven by policy divergence between the Fed and the BoJ, the pair appears to be losing bullish momentum. Structurally, the pair has formed a lower high, and sellers are starting to step in near resistance. A clean break below the 142.00–141.50 zone could open the path toward my downside target at 135.00.
On the fundamental side, recent data suggests a shift in sentiment. The US dollar is under pressure as markets increasingly price in a Fed pause or even rate cuts by the end of the year, following soft retail sales and labor market figures. Meanwhile, the Japanese yen is gaining ground amid rising speculation that the Bank of Japan could adjust its ultra-loose policy sooner than expected. The BoJ’s recent bond purchase tapering and Governor Ueda's hints at tightening are starting to shift market flows back toward the yen.
Technically, USDJPY is at a critical juncture. The pair is testing a key trendline support that has held for months, but price action is showing signs of exhaustion. Volume is thinning on the rallies, and bearish divergence is visible on multiple indicators, including RSI and MACD. If the pair breaks below the current structure, we could see accelerated downside action toward the 135.00 target, which aligns with previous consolidation zones and fib retracement levels.
This setup offers a strong short opportunity with clear invalidation and solid risk-to-reward potential. The macro narrative is shifting in favor of the yen, and technicals are lining up with this view. I’ll be watching the coming sessions for confirmation of breakdown and potential entries. This could be the start of a broader correction after a strong bullish cycle.

USD will remain stronger today against JPYUSD will remain stronger today against JPY.
USD has been taking support from a very strong support area.

USD/JPY Breakdown Incoming? 4 Powerful Signals Say 'Short Now'! The current landscape for USD/JPY signals a potential bearish reversal, supported by a convergence of technical, sentiment, and fundamental factors. Following a strong bullish leg from the 140 zone, price has reached the 146–147 resistance area, where it is currently being rejected. Price action has broken below the ascending channel that began in early April, suggesting a loss of bullish momentum and a possible transition into a deeper corrective phase.
From the COT (Commitment of Traders) perspective, the picture aligns with this bias. Non-commercials on the USD Index (DXY) are aggressively reducing exposure on both long and short sides, resulting in a net position of -615 contracts. This reflects growing uncertainty or waning confidence in dollar strength as U.S. monetary policy enters a potential pivot zone. Meanwhile, JPY futures still show a strong net long position by speculators (194,226 long vs. 21,958 short), even after a significant long liquidation of over 9,700 contracts. Commercial traders, typically positioned opposite to trend, remain heavily net short—hinting at possible strength ahead for the yen.
Seasonality adds further weight: May is historically a bearish month for USD/JPY. The 5, 10, and 15-year averages all show negative returns, with a structural downside tendency, especially in the final two weeks of the month.
Retail sentiment further supports this case. Data shows that 68% of retail traders are currently long USD/JPY. Interpreting this through a contrarian lens, it implies growing downside potential, as over-positioned retail traders often precede a move in the opposite direction.
Lastly, technical analysis (daily timeframe) reinforces the bearish scenario. The break below the bullish channel invalidates the recent structure, and the RSI is trending lower with plenty of room to move down before hitting oversold levels. Immediate support zones lie between 143 and 141. A potential retest of 145.80–146.30 would offer a favorable entry for fresh shorts in line with a developing bearish swing structure.
🎯 Conclusion
All elements—technical structure, COT data, seasonal weakness, and retail sentiment—are converging toward a bearish USD/JPY outlook. Institutional traders are cutting dollar longs, seasonal forces are negative, and retail positioning is overly long. With price structure now broken, the bearish bias is well supported, targeting 143 first and 141 as a deeper move, pending price action confirmation.

USD/JPY - Trendline Breakout (14.05.2025)The USD/JPY Pair on the M30 timeframe presents a Potential Selling Opportunity due to a recent Formation of a Trendline Breakout Pattern. This suggests a shift in momentum towards the downside in the coming hours.
Possible Short Trade:
Entry: Consider Entering A Short Position around Trendline Of The Pattern.
Target Levels:
1st Support – 145.34
2nd Support – 143.81
🎁 Please hit the like button and
🎁 Leave a comment to support for My Post !
Your likes and comments are incredibly motivating and will encourage me to share more analysis with you.
Best Regards, KABHI_TA_TRADING
Thank you.

Hanzo / USDJPY 15m Path ( Confirmed Breakout Zones )🔥 USD/JPY – 15 Min Scalping Analysis (Bearish Setup)
Bias: Waiting For Break Out
Time Frame: 15 Min
Entry Type: Confirmed Entry After Break Out
👌Bullish After Break Out : 145.150
👌Bearish After Break Out : 144.650
☄️ Hanzo Protocol: Dual-Direction Entry Intel
➕ Zone Activated: Strategic Reaction from Refined Liquidity Layer
Marked volatility from a high-precision supply/demand zone. System detects potential for both long and short operations.
🔤 Smart Money Confirmation Acquired:
Structure break aligned with order block integrity.➗ Both bullish and bearish models validated. Tactical options open.
🔥Multi-Timeframe Confluence:🩸
Higher timeframe levels intersect — prime territory for sniper scalps in either direction.
🩸 Momentum Signature Detected:
Displacement candle confirms directional intent — AI pattern scan active.
— If upward: Bullish momentum burst.
— If downward: Aggressive bearish rejection.
💯 Market Zone: Transition Phase
Asset in premium-to-discount (or vice versa) range — valid for both reversal and continuation trades. Execute with precision.

Impatience Tax in Trading: The Costs of Clicking Too SoonHave you ever thought that maybe some of your losses don’t come from bad trades? Rather, they come from good trades, timed badly?
You see the setup, the signal’s almost there, the MACD is leaning in, the candle is flirting with support — and boom, you click. Early. Too early.
Price dips a bit more and then shoots upward like a rocket. Your stop gets triggered — you just paid the impatience tax.
Welcome to the place where you get taxed for being impatient — a very real, very expensive fee traders pay when their fingers move faster than their reasoning.
🤫 The Impatience Tax — A Silent Killer Dressed as Urgency
The impatience tax doesn’t appear on your statement. You won’t see it listed in your commissions, or under slippage, or labeled in red ink like a realized loss. But rest assured, it’s there — nibbling away at your P&L every time you front-run your own strategy.
And the worst part? It feels productive. You’re taking initiative, showing conviction, being bold. Except what you're really doing is lighting good setups on fire because you couldn’t wait for one more candle to close.
🧬 The Anatomy of an Early Click
Here’s how it usually goes:
You spot a setup.
You get excited.
You skip the checklist.
You enter on the 3rd candle instead of the 5th.
The market fakes out.
You get stopped out.
The market then does exactly what you expected — without you.
Every trader has lived this story. And it hurts more than a loss from a bad trade. Because this wasn’t a bad idea. It was a good idea butchered by bad timing.
🤝 Impatience Loves Company (And Volatility)
Impatience tends to thrive in fast markets. When the price is moving, you feel like you need to act. You notice some breaking news that moves markets, charts start to jiggle and tickers flash — suddenly your FOMO glands kick in.
You’re not waiting for confirmation. You’re reacting — to price, to emotion, to fear of missing out.
It’s not just beginners either. Even seasoned traders occasionally get sucked in. Why? Because the brain is wired to avoid missing opportunities more than it’s wired to avoid losses. We want in. Now. Before it's “too late.”
But here’s a pro secret: the markets tend to always give second chances. You just have to be around to take them.
⏰ Why the Best Traders Wait
Let’s talk about patience. Not the zen-monk, meditate-in-a-cave-for-years kind. The market kind.
The kind that says: “Nope, not yet.”
The kind that closes the platform until the London session starts.
The kind that lets a trade go because it didn’t meet all the criteria — even if it was close.
Top traders aren’t paid for activity. They’re paid for precision. The entry is 90% of the battle. If you win there, the rest is just management.
🧐 How to Identify an Impatience Habit
Want to know if you’re paying the impatience tax regularly? Try this:
Look at your last 10 triggered stop loss orders: How many were within a few ticks of reversal?
Count your trades per day: Are you averaging more than your strategy demands?
Review your entry notes: Did you say things like “close enough” or “looks good”?
If the answer is yes, you’re a tax-paying member of the Impatience Society.
👷♂️ Build a Buffer: Taming the Trigger Finger
So how do you stop paying the Impatience Tax?
Start with structure:
Use time-based confirmations. Wait for the candle to close. A candle halfway formed is a lie detector test mid-question.
Have a rule-based checklist. If a trade doesn’t meet every item, you don’t take it. No exceptions.
Use alerts , not entries. Let the price come to you. Your job is to hunt, not chase.
Trade fewer setups, better. Less is more when each trade has meaning and clarity.
And when in doubt? Wait. The worst that happens is you miss one trade. The best that happens is you finally stop losing money edge by edge.
💵 Impatience Is Expensive. Patience Is Profitable.
The market is designed to reward discipline, not urgency. Speed might help you scalp news reactions, but even that requires planned execution. Unchecked impatience is just impulse with a brokerage account.
It's important to always remember that you’re not trying to win this trade. You’re trying to win this game for the long run.
And winning the game means surviving long enough to let your edge play out — with patience, not panic.
💎 Final Thoughts: Don’t Confuse Action with Progress
The financial markets are a cruel place for dopamine seekers. They offer constant motion, flashing lights, and infinite temptation to click before thinking.
But progress isn’t about how many trades you take — it’s about how many good ones you wait for.
So next time your mouse finger twitches, ask yourself: Is this the plan? Or is this impatience disguised as opportunity seeking instant gratification?
Because every early click is a donation to someone else’s P&L.
👉 Your turn : What’s your best (or worst) story of jumping the gun? How have you built patience into your process — or are you still wrestling with the trigger? Let us know in the comments!
