SIMPLEST SELL SETUP YOU'VE EVER SEEN...POTENTIAL USDJPY SHORTSHey hey Tradingview community!!! Hope you are all doing amazing! Just wanted to do a very detailed and complex breakdown for potential swing short opportunities I see for USDJPY...let's dive in!!
OK so first....lol
I'm kidding. Very simple. Look at the chart. Mark those zones to look for shorts. Swing trading opportunity...Love you all!!
Cheers!
OH...if you need the RSI settings it is the 7 period deviation. Cheers pt. 2!
USDJPY trade ideas

USDJPY: Short Trading Opportunity
USDJPY
- Classic bearish pattern
- Our team expects retracement
SUGGESTED TRADE:
Swing Trade
Sell USDJPY
Entry - 146.78
Stop - 146.96
Take - 146.43
Our Risk - 1%
Start protection of your profits from lower levels
Disclosure: I am part of Trade Nation's Influencer program and receive a monthly fee for using their TradingView charts in my analysis.
❤️ Please, support our work with like & comment! ❤️

USDJPY may have already found its bottom and is now on a rising USDJPY may have already found its bottom and is now on a rising path
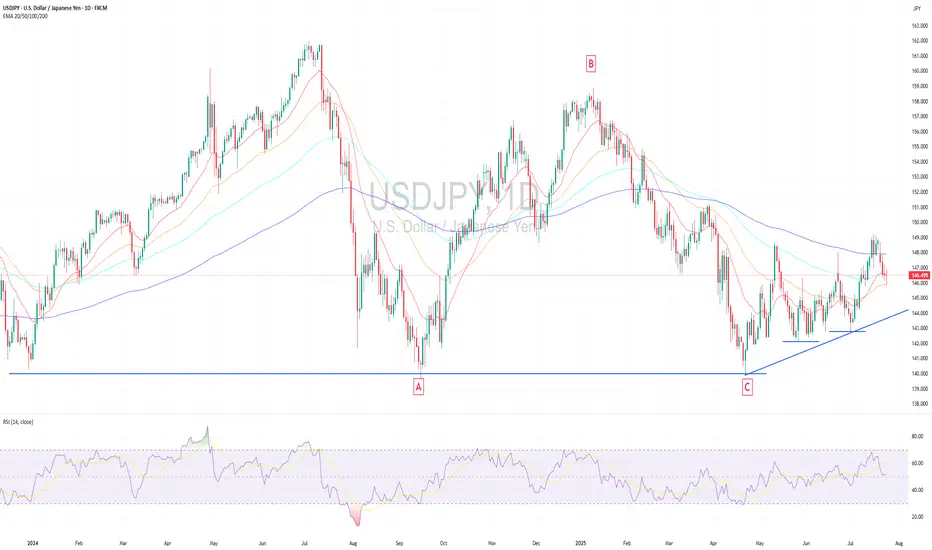
Technical Analysis USDJPY found long-term horizontal support (1.5 yrs) at 140.00 in April and began a slow rebound, forming consistent higher lows—signaling strengthening bullish momentum despite no clear breakout yet.
The EMAs across multiple timeframes are starting to converge after an extended bearish phase for months, indicating a possible bullish reversal as momentum shifts.
From an Elliott Wave perspective, the correction phase appears to have completed a full three-subwave, with Wave C ending at the same level as Wave A—forming a "Regular Flat Corrective Wave." This means USDJPY may now in an early stages of a new bullish impulse wave, signaling potential for extended upside.
If USDJPY can break and close above the previous high near 150.00, it would confirm the bullish reversal and could further strengthen upward momentum.
However, this analysis would be invalidated if the price closes below the key support around 142.00, in particularly if it drops below 140.00, which could signal a significant deeper downside.
Macroeconomic Analysis
In the long term, Japan has already passed its golden era driven by the Baby Boomer workforce and has now in an aging society. This structural demographic shift is reducing Japan's economic dynamic by slowing growth in productivity and overall consumption. As a result, demographic headwinds will likely weigh on Japan’s long-term economic momentum.
Japan’s tech and industrial edge, once dominant in autos and electronics, has eroded under pressure from China and South Korea, weakening long-term competitiveness and weighing on the yen.
On the trade front, Trump’s tariffs have reshaped global trade, hurting Japan’s export-led sectors like steel and autos. This likely reduced Japan’s trade surplus with the U.S., and by economic theory, this will cause the yen to weaken against the dollar. (Although the yen has recently strengthened due to President Trump’s announcement on Wednesday that Washington and Tokyo had reached a trade agreement, this is likely just a short-term market sentiment that will fade.)
In the near term, political uncertainty is also weighing on the yen. The Liberal Democratic Party's loss in the Upper House elections could hinder the government's legislative efforts. Rumors that PM Ishiba plans to resign could further undermine investor confidence in the yen.
Moreover, an uncertain impact of US tariffs on Japan makes it unlikely that the Bank of Japan (BoJ) can raise interest rates soon. This supports the continuation of the Yen Carry Trade, putting additional pressure on the yen.
Japan’s July Manufacturing PMI stayed in contraction at 48.8, while services slightly recovered. Q1 2025 GDP shrank -0.7% QoQ (annualized), reinforcing slowdown concerns and limiting BoJ’s room to hike rates.
Japan needs a new S-curve driver—like a tech revolution—to regain strong growth and restore confidence in the yen. Without it, further yen depreciation is likely.
Analysis by: Krisada Yoonaisil, Financial Markets Strategist at Exness
USDJPY range-bound trade- Trade is based on potential breakout on either side as range bound markets are there to be broken

USD/JPY Tests Pivotal Resistance in Bearish ContextFenzoFx—USD/JPY is testing the support at 146.6. This level is backed by anchored VWAP and the descending trendline.
From a technical perspective, the downtrend should resume if this level holds. In this scenario, the next bearish target could be 145.7. Furthermore, if the selling pressure exceeds this level, the price could fall toward the support at 144.1.

USDJPY BUY TRADE PLAN🔥 USDJPY TRADE PLAN 🔥
📅 Date: July 24, 2025
📋 Trade Plan Overview:
Plan ID Type Direction Confidence R:R Status
USDJPY2407-ID Intra-Day Buy ⭐⭐⭐⭐ 80% 3.6:1 ✅ Active (Confirmed)
Guidance:
Prioritize this Buy Plan as price is reacting to a clean H4 demand + engulfing candle + fundamental JPY weakness. Total risk: 0.75–1%.
🆔 Primary Trade Plan: Intra-Day BUY
📈 Market Bias & Trade Type
Bias: Bullish
Trade Type: Continuation after correction into H4 OB
🔰 Confidence Level
Confidence: ⭐⭐⭐⭐ (80%)
Breakdown:
🔹 H4 Bullish OB + Engulfing: 35%
🔹 JPY macro weakness + yield spread divergence: 20%
🔹 Volume buildup on LTF demand zone: 15%
🔹 Retail crowd short-biased: 10%
🔹 Sentiment score: +7.5/10
📌 Status
✅ Active – Entry Confirmed (H4 Engulfing)
📍 Entry Zones
🟩 Primary Buy Zone:
145.85 – 146.15 (H4 Demand + Previous LTF BOS Retest)
Current Price: 146.60 (slightly above, ideal retest already occurred OR wait for another re-test of 146.30-50 zone)
❗ Stop Loss
📍 SL: 144.85
(Just below secondary zone & structural wick buffer, 60–70 pips risk)
🎯 Take Profit Targets
🎯 Target Level R:R Notes
🥇 TP1 147.35 ~1.0:1 H1 Supply imbalance
🥈 TP2 148.05 ~2.1:1 H4 Resistance/Orderblock
🥉 TP3 148.60 ~3.6:1 D1 Wick High – swing extension
🧠 Management Strategy
Risk: 0.75–1% of $
Lots: Adjust for ~60–70 pips SL
Breakeven: Move SL to BE after TP1
Partials:
40% TP1
40% TP2
20% trail to TP3
Exit Early If: DXY rallies aggressively or USDJPY H1 prints reversal signal
⚠️ Confirmation Checklist
✅ H4 Bullish Engulfing Candle (Confirmed)
🔄 Tick chart volume cluster support
✅ Entry during London → NY overlap
❌ No high-impact red USD/JPY news in next 2 hours
💡 Look for additional M30 continuation on pullback
⏳ Validity
Plan valid: 24–36 hours
Expires: End of July 25 (or H4 break below 144.85)
Confirmed as active on H4
❌ Invalidation
Full H4 body close below 144.85
Sharp sell-off on high DXY momentum
Reversal signal + divergence on H1 near 147.30–148.00
🌐 Fundamental & Sentiment Snapshot
COT: Net Long USD, Net Short JPY widening
Yield Spread: Favors USD; JPY yields still compressed
Retail: 71% short USDJPY → Contrarian Buy
DXY: Soft intraday after CPI pullback
Macro Events: BOJ dovish stance remains, no USD red news today
Sentiment Score: +7.5/10
Historical: 76% win rate on this structure with engulfing confirmation
📋 Final Trade Summary
USDJPY offers a high-probability continuation long off a clean H4 demand block that was retested with engulfing confirmation. Momentum and bias align bullishly, retail is counter-trend, and volume supports continuation. This setup provides a favorable R:R with clear invalidation and 3 well-defined profit targets. Excellent structure for intra-day to swing capture.

15M TEMPORARY BUY THEN BIG SELL15M SELL range change to BUY.
Retracement up to 146.40 - 146.30 (BUY ZONE)
If red dotted line 146.73 crossed, H1 SELL range confirmed and hence we will enter SELL ZONE (146.80 - 146.90).
NB: If dotted line crossed first before come to BUY ZONE, I wont BUY.

USDJPY short position 24/07/2025English : According to our analysis, we anticipate a bearish scenario.
Morocan Darija : kanchofo d'apres l'analyse dyalna antsanaw hboot
ATENTION : I only share my ideas, not signals

Simple SMC Short Setup on USDJPY (15min TF)Here’s a short trade idea I’m watching on USDJPY using basic Smart Money Concepts (SMC).
🔍 What I saw:
The market made a Break of Structure (BOS) to the downside.
A Change of Character (CHoCH) confirmed that the trend might be shifting.
After the drop, price retraced back to a supply zone in the premium area—right near a swing high.
I also noticed a trendline liquidity sweep, which adds more confluence that this could be a trap before a drop.
📉 Plan:
Waited for price to tap the zone and react before entering short.
Stop loss is above the swing high (to protect against fakeouts).
Targeting the recent low for a potential clean move down.
This setup uses no indicators—just price action, supply & demand, and simple structure.
Drop your thoughts or questions below—I’m always open to feedback!

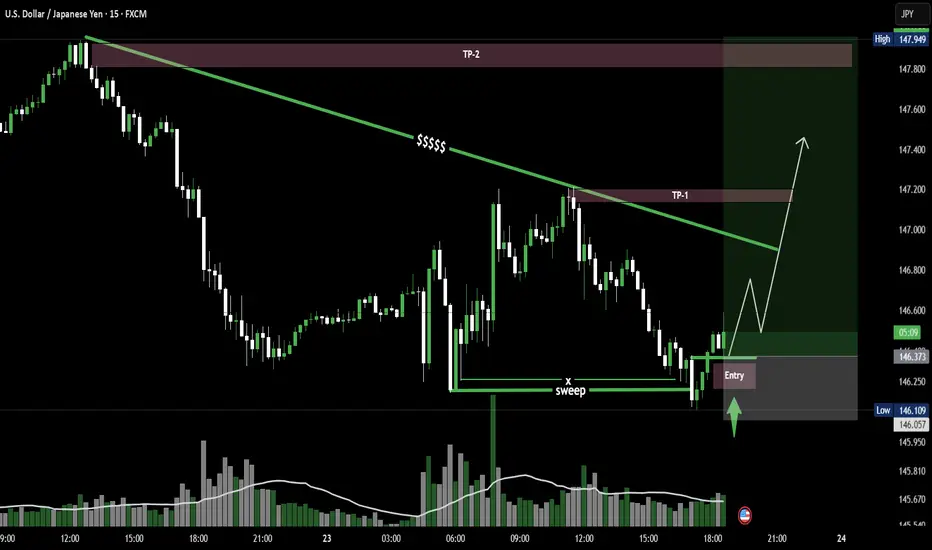
USD/JPY - 15MIN Sweep, Reclaim, LaunchUSD/JPY on the 15M chart shows a clean liquidity sweep followed by a strong reclaim and entry confirmation. Price is now pushing toward TP1 near the descending trendline and could extend to TP2, a key supply zone. Classic SMC structure in motion.
USD/JPY – Sweep, Reclaim, Launch 🚀
USDJPY Q3 | D24 | W30 | Y25 VIDEO EXPLANATION 📊USDJPY Q3 | D24 | W30 | Y25
Daily Forecast🔍📅
Here’s a short diagnosis of the current chart setup 🧠📈
Higher time frame order blocks have been identified — these are our patient points of interest 🎯🧭.
It’s crucial to wait for a confirmed break of structure 🧱✅ before forming a directional bias.
This keeps us disciplined and aligned with what price action is truly telling us.
📈 Risk Management Protocols
🔑 Core principles:
Max 1% risk per trade
Only execute at pre-identified levels
Use alerts, not emotion
Stick to your RR plan — minimum 1:2
🧠 You’re not paid for how many trades you take, you’re paid for how well you manage risk.
🧠 Weekly FRGNT Insight
"Trade what the market gives, not what your ego wants."
Stay mechanical. Stay focused. Let the probabilities work.
FRGNT

Fundamental Market Analysis for July 24, 2025 USDJPYThe Japanese yen (JPY) strengthened against its US counterpart for the fourth consecutive day and reached a nearly three-week high during Asian trading on Thursday. The recently announced trade deal between Japan and the US reduces economic uncertainty and increases the likelihood that the Bank of Japan (BoJ) will resume its tightening cycle at the end of this year, which in turn is seen as a key factor continuing to support the JPY. The US dollar (USD), on the other hand, is languishing near two-and-a-half-week lows and is putting additional pressure on the USD/JPY pair.
However, domestic political uncertainty and disappointing data on Japan's manufacturing PMI may keep yen bulls from aggressive bets. Moreover, the optimistic market sentiment should help limit the safe-haven yen's gains and further losses for the USD/JPY pair. Traders are now eagerly awaiting the release of US flash PMI indices to take advantage of short-term opportunities later in the North American session. However, the mixed fundamental backdrop calls for caution before making aggressive directional bets.
Trade recommendation: SELL 146.00, SL 147.10, TP 145.00

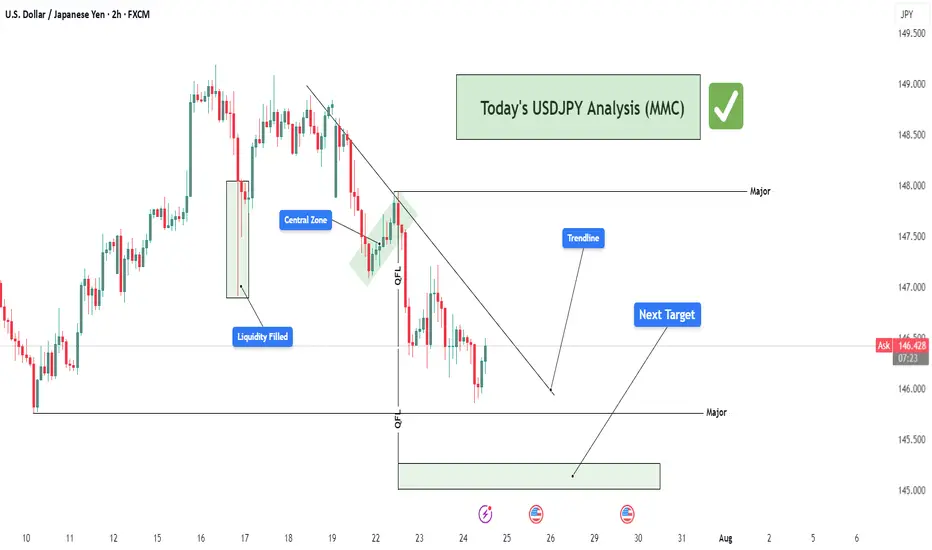
USDJPY Structure Analysis – Liquidity Filled, Rejection + Target🧠 Overview:
This 2-hour chart of USDJPY highlights a clear bearish structure following a smart money-driven move. The price action reflects market maker behavior, liquidity manipulation, trendline rejections, and strategic zone targeting. Let's break down the key elements for today’s USDJPY analysis.
🔍 Key Technical Breakdown:
1. 🏦 Liquidity Grab & Fill (July 17th)
The marked green zone shows an aggressive liquidity sweep where the price dipped sharply into a previous demand zone, triggering stop losses and collecting institutional orders.
This movement represents a classic "liquidity fill", often engineered by market makers to trap retail buyers/sellers.
After sweeping liquidity, price quickly reversed upwards — a signal that large buy orders were triggered and filled.
2. 🎯 Central Zone as a Distribution Region
The market retraced to the "Central Zone", highlighted on the chart, which acted as a distribution area:
Price consolidated and created indecision before rejecting sharply again.
This zone reflects a short-term supply where institutional players may have offloaded positions.
Key clue: This consolidation occurred below the major trendline, increasing its strength as resistance.
3. 🔻 QFL Zones (Quasimodo Failure Levels)
Two QFL levels are marked, which denote structure breaks and retracements in MMC/SMC strategy:
First QFL marks a major support break – a signal of shifting market sentiment from bullish to bearish.
Second QFL confirms continued lower lows formation – solidifying bearish market structure.
These levels are critical in identifying market intent and anticipating future moves.
4. 📉 Descending Trendline Rejection
The descending trendline drawn from recent highs is being respected continuously:
Price tested the trendline multiple times but failed to break above.
These rejections represent seller dominance and validate the trendline as a dynamic resistance.
A break above this line would invalidate the current bearish structure.
5. 🎯 Next Target – Major Demand Zone (145.00–145.20)
Price is heading toward a major demand zone marked in green around 145.000:
This area is a strong buy-side liquidity zone, where institutional buyers may show interest again.
If this zone is tapped, we may see either:
A bounce (bullish reaction), or
A breakdown and continuation lower if bearish momentum continues.
Traders should monitor this area closely for price action signals (engulfing candles, rejection wicks, or bullish divergence).
🧠 Strategic View:
Bias: Bearish, unless trendline breaks with strong volume.
Ideal Entry: Look for short entries on lower timeframe pullbacks into minor resistance (like trendline or last supply zone).
Target Area: 145.00 – ideal zone to book profits or switch bias.
Invalidation: A break and close above the descending trendline + central zone.
🔑 Confluences in This Analysis:
Concept Details
✅ Liquidity Grab Trap & Fill strategy at prior lows
✅ Central Zone Bearish distribution and rejection
✅ Trendline Repeated resistance rejections
✅ Structure Lower lows and QFL confirmations
✅ Target Area Clear next demand zone identified
⚠️ Risk Note:
As always, wait for confirmation before entering trades. The market may fake out near zones. Use proper risk management (1-2% risk per trade) and adjust your strategy as new candles form.
📌 Conclusion:
This chart paints a textbook scenario of how institutional movements and structure-based analysis (MMC/SMC) can offer high-probability setups. We expect further downside toward the 145.00 region before any significant reversal. Keep an eye on reaction from this demand zone for the next play.
USDJPY LTF Triangle being formedUSDJPY is going down in all TF's
We want to see a SELL position.
On the 15M, we see a Triangle being formed.
If it breaks below, we want to enter into a SELL position.

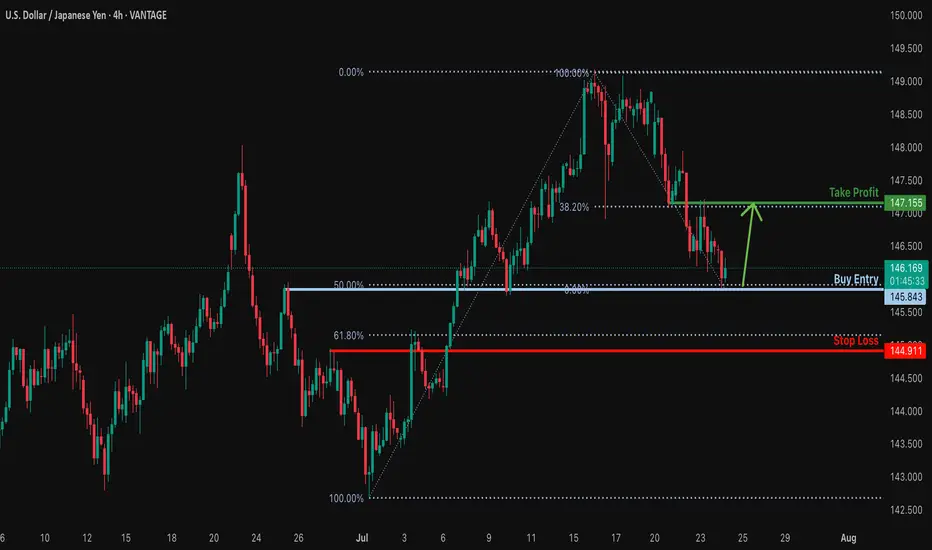
Bullish reversal?USD/JPY is falling towards the support level, which is an overlap support that aligns with the 50% Fibonacci retracement and could bounce from this level to our take profit.
Entry: 145.84
Why we like it:
There is an overlap support that aligns with the 50% Fibonacci retracement.
Stop loss: 144.91
Why we like it:
There is a pullback support that is slightly below the 61.8% Fibonacci retracement.
Take profit: 147.15
Why we like it:
There is an overlap resistance that lines up with the 38.2% Fibonacci retracement.
Enjoying your TradingView experience? Review us!
Please be advised that the information presented on TradingView is provided to Vantage (‘Vantage Global Limited’, ‘we’) by a third-party provider (‘Everest Fortune Group’). Please be reminded that you are solely responsible for the trading decisions on your account. There is a very high degree of risk involved in trading. Any information and/or content is intended entirely for research, educational and informational purposes only and does not constitute investment or consultation advice or investment strategy. The information is not tailored to the investment needs of any specific person and therefore does not involve a consideration of any of the investment objectives, financial situation or needs of any viewer that may receive it. Kindly also note that past performance is not a reliable indicator of future results. Actual results may differ materially from those anticipated in forward-looking or past performance statements. We assume no liability as to the accuracy or completeness of any of the information and/or content provided herein and the Company cannot be held responsible for any omission, mistake nor for any loss or damage including without limitation to any loss of profit which may arise from reliance on any information supplied by Everest Fortune Group.
**New Buy Signal – USD/JPY** (Recovery Plan)* You **can enter now** or set a **pending buy at 146.400** if price pulls back slightly.

USD JPY shortim not going against the trend a 1 to 2 risk to reward is perfect lets see ...
Please note: This is for educational purposes only and not a trading signal. These ideas are shared purely for back testing and to exchange views. The goal is to inspire ideas and encourage discussion. If you notice anything wrong, feel free to share your thoughts. In the end, to learn is to share !


USDJPY Q3 | D24 | W30 | Y25📊USDJPY Q3 | D24 | W30 | Y25
Daily Forecast🔍📅
Here’s a short diagnosis of the current chart setup 🧠📈
Higher time frame order blocks have been identified — these are our patient points of interest 🎯🧭.
It’s crucial to wait for a confirmed break of structure 🧱✅ before forming a directional bias.
This keeps us disciplined and aligned with what price action is truly telling us.
📈 Risk Management Protocols
🔑 Core principles:
Max 1% risk per trade
Only execute at pre-identified levels
Use alerts, not emotion
Stick to your RR plan — minimum 1:2
🧠 You’re not paid for how many trades you take, you’re paid for how well you manage risk.
🧠 Weekly FRGNT Insight
"Trade what the market gives, not what your ego wants."
Stay mechanical. Stay focused. Let the probabilities work.
FRGNT
FX:USDJPY


USDJPY| - Bullish Setup Loading30M price action remains heavy to the upside. Structure is intact — no lows invalidated. Currently sitting on a refined 30M order block, I’m patiently watching for price to dip back into the zone and sweep short-term liquidity (SSL).
Once that sweep happens and we pull back into the OB, I’ll be looking to ride the bullish momentum:
🎯 First target: 5M highs
🚀 Final target: 30M highs
Feeling confident — just waiting on smart money to confirm it’s time.

USDJPY Will Go Lower From Resistance! Sell!
Please, check our technical outlook for USDJPY.
Time Frame: 45m
Current Trend: Bearish
Sentiment: Overbought (based on 7-period RSI)
Forecast: Bearish
The market is approaching a significant resistance area 145.971.
Due to the fact that we see a positive bearish reaction from the underlined area, I strongly believe that sellers will manage to push the price all the way down to 145.357 level.
P.S
Overbought describes a period of time where there has been a significant and consistent upward move in price over a period of time without much pullback.
Disclosure: I am part of Trade Nation's Influencer program and receive a monthly fee for using their TradingView charts in my analysis.
Like and subscribe and comment my ideas if you enjoy them!

USDJPY LONG IDEASLooking good for bullish retracement on USDJPY 15 Minutes, i saw there is a potential because of its already overbought on RSI 14 and the current market price is on the support level on H4 and D1, suppose to be it is high probability because our analysis allign with big picture .
