USDJPY Will Go Lower From Resistance! Sell!
Please, check our technical outlook for USDJPY.
Time Frame: 45m
Current Trend: Bearish
Sentiment: Overbought (based on 7-period RSI)
Forecast: Bearish
The market is approaching a significant resistance area 145.971.
Due to the fact that we see a positive bearish reaction from the underlined area, I strongly believe that sellers will manage to push the price all the way down to 145.357 level.
P.S
Overbought describes a period of time where there has been a significant and consistent upward move in price over a period of time without much pullback.
Disclosure: I am part of Trade Nation's Influencer program and receive a monthly fee for using their TradingView charts in my analysis.
Like and subscribe and comment my ideas if you enjoy them!
USDJPY trade ideas

USDJPY LONG IDEASLooking good for bullish retracement on USDJPY 15 Minutes, i saw there is a potential because of its already overbought on RSI 14 and the current market price is on the support level on H4 and D1, suppose to be it is high probability because our analysis allign with big picture .

USD/JPY: A Bullish Thesis for Trend ContinuationThis analysis outlines a data-driven, bullish thesis for USD/JPY, identifying a strategic long entry within an established market trend. The setup is supported by a combination of fundamental catalysts and a clear technical structure.
📰 The Fundamental Picture
The primary driver for this trade will be the high-impact US economic data scheduled for release. This release is expected to inject significant volatility into the market. Fundamentally, this trade is a play on the deep policy differences between the US Federal Reserve and the Bank of Japan. While the Fed's future steps are a topic of debate, the Bank of Japan's policy remains one of the most accommodative in the world, creating a long-term headwind for the Japanese Yen. This dynamic provides a strong fundamental basis for relative US Dollar strength against the Yen.
📊 The Technical Structure
Chart analysis reveals that USD/JPY is in a confirmed and healthy uptrend. The current price action indicates a constructive pullback, presenting a strategic opportunity to join the dominant trend at a favorable price. The proposed entry point is positioned at a key technical level that offers a low-risk entry. Technical indicators support the continuation of the trend, suggesting that momentum remains with the bulls.
✅ The Trade Plan
This trade is structured with a clear and favorable risk-to-reward profile, aiming to capitalize on the established trend.
👉 Entry: 146.343
⛔️ Stop Loss: 145.233
🎯 Take Profit: 148.560
⚖️ Risk/Reward Ratio: 1:2

USD/JPY(20250724)Today's AnalysisMarket news:
U.S. President Trump continued to lash out at the Federal Reserve on Tuesday, but seemed to back off from the remaining plan to fire Chairman Powell. "I think he's doing a bad job, but he's going to be out of office soon anyway," Trump said in an exchange with reporters at the White House. "In eight months, he'll be out of office."
Technical analysis:
Today's buying and selling boundaries:
146.60
Support and resistance levels:
147.70
147.29
147.02
146.18
145.92
145.51
Trading strategy:
If the price breaks through 146.60, consider buying in, with the first target price at 147.02
If the price breaks through 146.18, consider selling in, with the first target price at 145.92

BULLISH SCENARIO A piece of prcie action with a blend of key levels and the various candle stick formation
but in all we keep watch as an eagle

USDJPY (daily analysus) 24/07hi everyone the daily analysis video is up little early today before the daily candle close so this analysis might change is closes differently, but as is we are still bearish.
as always happy trading and have a great day

JPY is gaining strength.USD/JPY is in a bearish trend, and based on my view through various fractals and market structure, a strong drop toward the marked zone is highly expected.
The stop loss is clearly defined in this scenario.
Wishing you success!

USDJPY Technical Analysis – Key Support Zone in Focus!USDJPY Technical Analysis – Key Support Zone in Focus!
As shown in the chart, USDJPY has broken out of its long-term trendline and is now trading within a rising channel structure. Currently, the price is sitting near a crucial support zone at 145.190, which could play a decisive role in the pair’s next move.
🔹 If this support holds, we may see a bullish continuation towards the following key resistance levels:
First target: 151.110
Next target: 160.100 (upper bound of the channel)
🔻 However, if the 145.190 support fails, the price could decline toward the bottom of the rising channel, with the next major support near:
136.000
📌 This area is critical for swing and position traders. Price action in this zone will likely provide strong signals for entry or exit.
📊 Follow for more real-time analysis and trading insights!


USDJPY - market structureUSDJPY - market structure, keep a clean chart and trake best decision , use risk managment
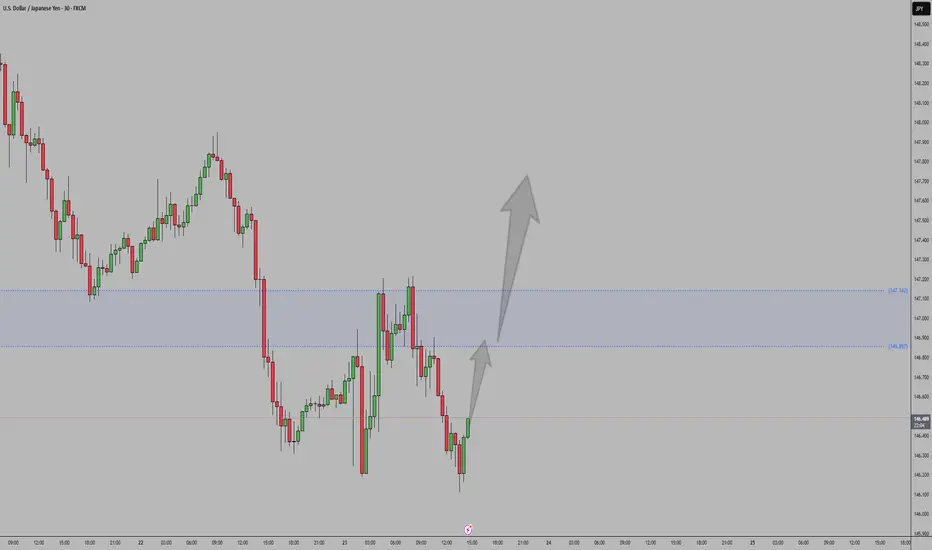
USD/JPY Is Ready Move Will Be Fly USD/JPY 30-min chart shows a potential buy setup from the 146.18 support zone, targeting 148.10 with stop loss at 145.82. Price is expected to rise through resistance levels at 147.00 and 147.70.

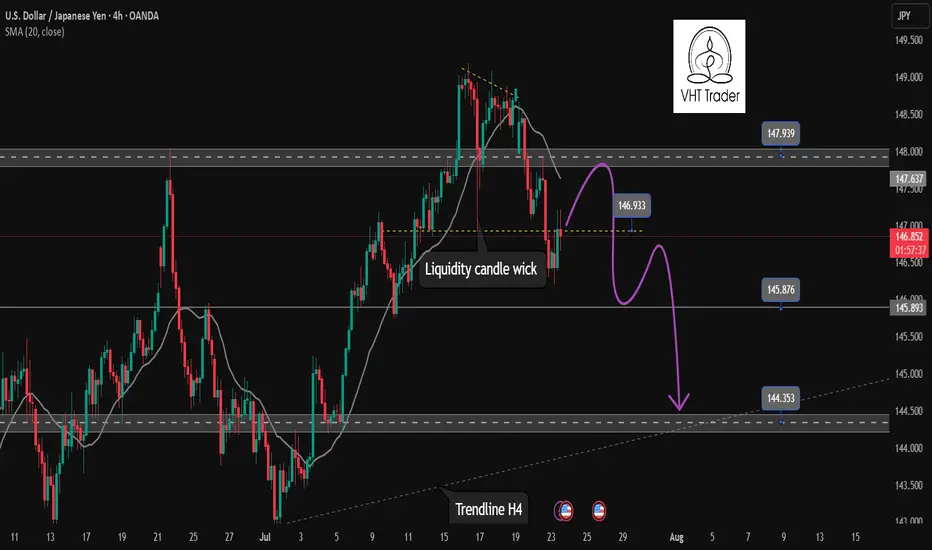
Continuation of downtrend. Waiting for confirmation SELL USDJPY✏️ OANDA:USDJPY is starting a corrective downtrend. Yesterday's New York session's selling pressure surpassed the buying liquidity zone around 147,000. This further confirms the possibility of the pair continuing its downward correction. Some recovery waves in today's Asia-Europe session are considered a good opportunity to SELL towards the target of 144,300 (trailline zone of the h4 frame). Pay attention to the important breakout price zone of 145,900.
📉 Key Levels
Support: 145,900-144,300
Resitance: 147,000-147,800
SELL trigger: Rejection from 147,000
SELL 147,700 (Strong resistance + SMA 20)
Target 144,400
SELL DCA: Break 145,900
Leave your comments on the idea. I am happy to read your views.
DXY, EURUSD & USDJPY Daily Trade SetupsIn this update we review the recent price action in the Dollar Index, Euro & Yen and identify the next high-probability trading opportunities and price objectives to target. To review today's video analysis, click here!

USDJPYUSDJPY continues to show solid bullish momentum, with price respecting higher lows and breaking through resistance zones cleanly. The market structure remains strong, supported by steady buying pressure and positive sentiment around the U.S. dollar. As long as support levels hold, the path of least resistance remains to the upside, with potential for continued gains in the short to medium term.
It is a buy position.Let’s wait calmly, let the market prove itself, and then ride the move with discipline.

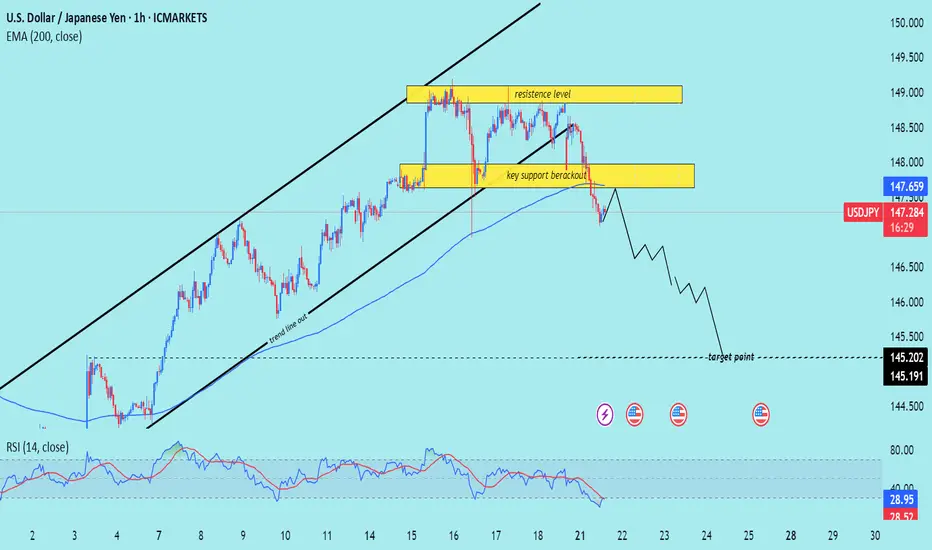
USD/JPY) bearish Trend Read The captionSMC Trading point update
Technical analysis of USD/JPY on the 1-hour timeframe, signaling a potential drop toward the 145.200 – 145.191 target zone. Here's the detailed breakdown:
---
Technical Analysis – USD/JPY (1H)
1. Rising Channel Breakdown
Price has broken below an ascending channel, confirming a trend line breakout and signaling a trend shift from bullish to bearish.
The trend line cut and rejection from the upper resistance zone support the bearish reversal.
2. Key Support Breakout
A crucial horizontal support zone around 147.80–148.00 was broken.
The break-and-retest of this area (yellow box) acts as a confirmation of bearish momentum continuation.
3. Bearish Momentum Below EMA
Price is trading below the 200 EMA (147.659) — a strong signal of downward bias on this timeframe.
The EMA has flipped from dynamic support to resistance.
4. RSI Oversold but Bearish
RSI is at 29.41, in oversold territory, which may hint at a short-term bounce.
However, the broader structure suggests more downside potential before a deeper retracement.
5. Target Projection
Projected target zone is between 145.200–145.191, aligning with previous structure lows and likely liquidity zone.
Mr SMC Trading point
Summary
Bias: Bearish
Current Price: 147.307
Key Resistance: 147.80–148.60 zone
Structure: Rising channel break + key support breakout
200 EMA: Above price (bearish signal)
RSI: 29.41 – oversold but momentum remains bearish
Target: 145.200–145.191
Please support boost 🚀 this analysis)
USDJPY Possible BEARISH setup🚀 USDJPY UPDATE: Bearish Setup
Summary:
Analysing price action from yesterday, breakout from the Daily timeframe accumulation zone has materialized with strong conviction.
TRADE SETUP Metrics:
- Entry: ✅
- Stop loss - Above Resistance Zone
- Target 1: (R:R 1:2)🎯
- Target 2: (R:R 1:3)🎯
- Target 3: (R:R 1:4)🎯
Technical Anticipations:
- Price action to show a Bearish follow-through
- Resistance zone to hold
Position Management:
- partial profits secured at Target 1
- Stop loss adjusted to breakeven upon reaching Targets
- Full Exit at Target 3
LIKE or COMMENT if this idea sparks your interest, or share your thoughts below!
FOLLOW to keep up with fresh ideas.
Tidypips: "Keep It Clean, Trade Mean!"

USDJPY short position 23/07/2025English : According to our analysis, we anticipate a bearish scenario.
Morocan Darija : kanchofo d'apres l'analyse dyalna antsanaw hboot
ATENTION : I only share my ideas, not signals

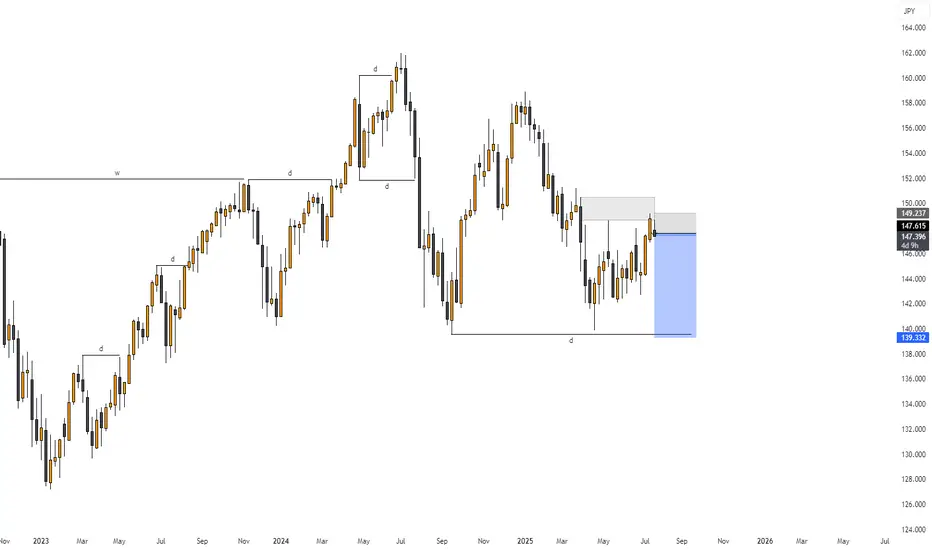
USD/JPY FORCAST 23-7📉 On the daily timeframe, price action confirms a potential start of a new bearish cycle.
🔄 Previous Cycle Breakdown:
Phase 3 (Impulsive Downtrend):
📅 Jan 8 → Mar 6
⏱️ ~41 daily candles
Phase 6 (Correction):
📅 Mar 6 → Mar 30
⏱️ ~20 daily candles
Phase 9 (Distribution/Exhaustion):
📅 ~16 daily candles, ending Apr 21
This marked the completion of a full cycle, triggering a shift in behavior.
🔁 What happened next?
A Reaccumulation / Manipulation phase began immediately after the cycle ended — which is normal after full cycle completion.
This reaccumulation lasted around 62 daily candles, building up pressure and liquidity.
> 80% of market movement is corrective or consolidative.
Only 20% (or less) is pure trend.
If you’re only looking for trends, you’re missing the actual map.
⚠️ Current Outlook: on the 1hr timeframe
As we now enter the final time pivot of the month — specifically beginning July 22 at 16:00 —
the market is signaling the start of a new Phase 3 (bearish impulsive wave).
usd/jpy may reach 141.453 before 1st of August.
I think this is the time to sell usd , or buy any other currencies or metal against usd
What’s your view? Are you trading with time or against it?

update : usd/jpy forcast 23th Jul📉 On the daily timeframe, price action confirms a potential start of a new bearish cycle.
🔄 Previous Cycle Breakdown:
Phase 3 (Impulsive Downtrend):
📅 Jan 8 → Mar 6
⏱️ ~41 daily candles
Phase 6 (Correction):
📅 Mar 6 → Mar 30
⏱️ ~20 daily candles
Phase 9 (Distribution/Exhaustion):
📅 ~16 daily candles, ending Apr 21
This marked the completion of a full cycle, triggering a shift in behavior.
🔁 What happened next?
A Reaccumulation / Manipulation phase began immediately after the cycle ended — which is normal after full cycle completion.
This reaccumulation lasted around 62 daily candles, building up pressure and liquidity.
> 80% of market movement is corrective or consolidative.
Only 20% (or less) is pure trend.
If you’re only looking for trends, you’re missing the actual map.
⚠️ Current Outlook: on the 1hr timeframe
As we now enter the final time pivot of the month — specifically beginning July 22 at 16:00 —
the market is signaling the start of a new Phase 3 (bearish impulsive wave).
usd/jpy may reach 141.453 before 1st of August.
I think this is the time to sell usd , or buy any other currencies or metal against usd
What’s your view? Are you trading with time or against it?

USDJPY → Hunting for liquidity before the fallFX:USDJPY is changing its local trend and succumbing to global pressure. The market is seeing a change in price movement following the decline in the dollar index...
The trend has broken and the price movement has turned bearish. The fall in the dollar index is allowing the Japanese yen to strengthen, which is generally negative for the currency pair. The decline may continue after a slight correction.
Fundamentally, the dollar is correcting amid uncertainty due to the tariff war, as well as expectations of interest rate cuts.
Resistance levels: 147.20, 147.89
Support levels: 145.85, 145.23
As part of the correction, the price may test the liquidity zone of 147.7 or 0.7f. A false breakout and consolidation of the price in the selling zone may trigger a further decline in both the short and medium term.
Best regards, R. Linda!

Major resistance ahead?USD/JPY is rising towards the pivot and could reverse to the 1st support which aligns with the 50% Fibonacci retracement.
Pivot: 147.67
1st Support: 145.89
1st Resistance: 149.03
Risk Warning:
Trading Forex and CFDs carries a high level of risk to your capital and you should only trade with money you can afford to lose. Trading Forex and CFDs may not be suitable for all investors, so please ensure that you fully understand the risks involved and seek independent advice if necessary.
Disclaimer:
The above opinions given constitute general market commentary, and do not constitute the opinion or advice of IC Markets or any form of personal or investment advice.
Any opinions, news, research, analyses, prices, other information, or links to third-party sites contained on this website are provided on an "as-is" basis, are intended only to be informative, is not an advice nor a recommendation, nor research, or a record of our trading prices, or an offer of, or solicitation for a transaction in any financial instrument and thus should not be treated as such. The information provided does not involve any specific investment objectives, financial situation and needs of any specific person who may receive it. Please be aware, that past performance is not a reliable indicator of future performance and/or results. Past Performance or Forward-looking scenarios based upon the reasonable beliefs of the third-party provider are not a guarantee of future performance. Actual results may differ materially from those anticipated in forward-looking or past performance statements. IC Markets makes no representation or warranty and assumes no liability as to the accuracy or completeness of the information provided, nor any loss arising from any investment based on a recommendation, forecast or any information supplied by any third-party.

Pound Hits $1.35 on Weaker DollarThe pound climbed to $1.35, supported by a weaker dollar and cautious positioning ahead of the August 1 U.S. tariff deadline. Investors expect UK economic data to show improving momentum, while the Bank of England may scale back bond sales due to weak demand. Despite the optimism, markets still price in two BoE rate cuts in 2025.
Resistance stands at 1.3550, with support at 1.3380.
