USD/JPY: Bearish Setup Looms Below VWAP ZoneUSD/JPY dipped as expected, currently testing the VWAP as support while Stochastic signals the Yen is overpriced in the short term.
Resistance is at 147.6, backed by the bearish VWAP. It is likely the pair will rise and test this level. Furthermore, a new bearish wave can potentially emerge if 147.6 holds. In this scenario, the next target could be the support at 145.8 followed by 144.2.
USDJPY trade ideas

USDJPY - BEARISH MOVE !Hello Traders !
The USDJPY failed to create a new higher high!
The price broke the support line!
So, I expect a bearish move📉
__________________
TARGET: 146.300🎯


The Day Ahead Economic Data
US June Existing Home Sales (10:00 ET): Will gauge housing demand resilience amid high mortgage rates. A weaker print may support rate cut expectations.
Eurozone July Consumer Confidence (Flash): Important for sentiment around ECB rate policy. Any downside surprise could weigh on the euro.
Central Banks
BoJ’s Uchida Speaks: Watch for any shift in tone post-yield curve control tweak. A hawkish slant may support JPY and pressure Japanese equities.
Earnings – High-Impact Reports
Tech & Comms:
Alphabet (GOOGL), Tesla (TSLA), IBM, T-Mobile US (TMUS) – Key for Nasdaq sentiment and AI/cloud/EV momentum.
Industrial & Energy:
GE Vernova, Equinor, Freeport-McMoRan – Outlooks can move energy, copper, and renewables sectors.
Financials & Payments:
Fiserv, UniCredit – Insight into global payment volumes and eurozone banking resilience.
Consumer & Healthcare:
Chipotle, Hilton, Thermo Fisher, Boston Scientific – Consumption trends, travel recovery, and health sector resilience in focus.
Fixed Income
US 20-Year Bond Auction (13:00 ET): Watch for demand metrics (bid-to-cover, indirect bids). Weak take-up could push yields higher and pressure equities.
This communication is for informational purposes only and should not be viewed as any form of recommendation as to a particular course of action or as investment advice. It is not intended as an offer or solicitation for the purchase or sale of any financial instrument or as an official confirmation of any transaction. Opinions, estimates and assumptions expressed herein are made as of the date of this communication and are subject to change without notice. This communication has been prepared based upon information, including market prices, data and other information, believed to be reliable; however, Trade Nation does not warrant its completeness or accuracy. All market prices and market data contained in or attached to this communication are indicative and subject to change without notice.

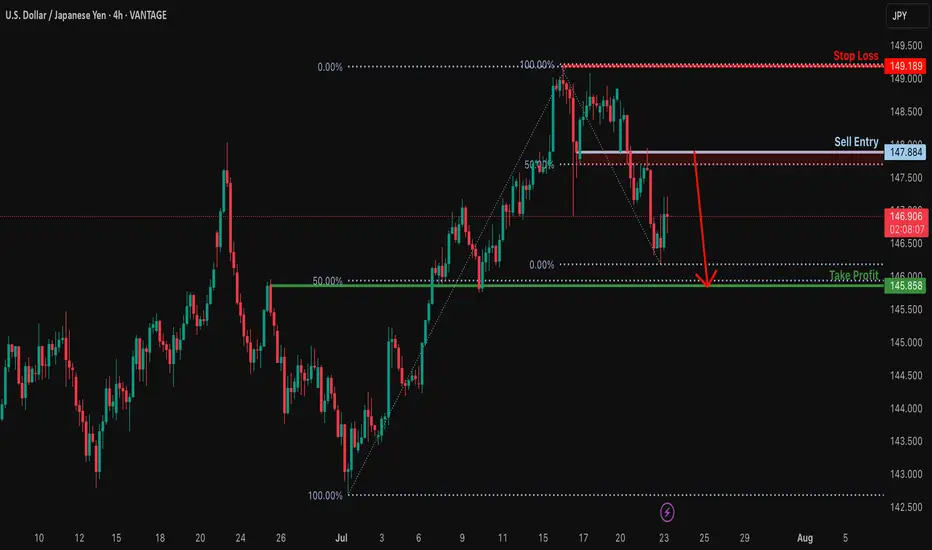
Bearish reversal off overlap resistance?USD/JPY is rising towards the resistance level which is an overlap resitance that is slightly above the 50% Fibonacci retracement and could reverse from this level to our take profit.
Entry: 147.88
Why we like it:
There is an overlap resistance that is slight.y above the 50% Fibonacci retracement.
Stop loss: 149.18
Why we like it:
There is a swing high resistance.
Take profit: 145.85
Why we like it:
There is an overlap support that lines up with the 50% Fibonacci retracement.
Enjoying your TradingView experience? Review us!
Please be advised that the information presented on TradingView is provided to Vantage (‘Vantage Global Limited’, ‘we’) by a third-party provider (‘Everest Fortune Group’). Please be reminded that you are solely responsible for the trading decisions on your account. There is a very high degree of risk involved in trading. Any information and/or content is intended entirely for research, educational and informational purposes only and does not constitute investment or consultation advice or investment strategy. The information is not tailored to the investment needs of any specific person and therefore does not involve a consideration of any of the investment objectives, financial situation or needs of any viewer that may receive it. Kindly also note that past performance is not a reliable indicator of future results. Actual results may differ materially from those anticipated in forward-looking or past performance statements. We assume no liability as to the accuracy or completeness of any of the information and/or content provided herein and the Company cannot be held responsible for any omission, mistake nor for any loss or damage including without limitation to any loss of profit which may arise from reliance on any information supplied by Everest Fortune Group.
USD/JPY – Bearish Rejection After Channel BreakUSD/JPY – Bearish Rejection After Channel Break
🔹 2H Chart Analysis by PULSETRADESFX
USD/JPY has broken down from a rising channel and is now rejecting a key supply zone around 147.000 – 147.250. The pair is showing early signs of bearish continuation after retesting this zone as resistance.
This setup favors short positions targeting deeper levels, especially with price failing to reclaim the broken structure.
📌 Trade Setup:
Entry: 146.808
Stop Loss: 147.350 (Above supply zone)
TP1: 146.000 (Recent low)
TP2: 145.250 (Demand support)
TP3: 144.300 (Major structural zone)
This is a clean break–retest–continuation scenario with risk-to-reward aligning well for short-term and swing traders.
✅ Bearish Confluences:
Rising channel break
Supply zone rejection
Lower high structure
Bearish engulfing reaction
TP levels mapped to recent price memory zones
📅 July 23, 2025
📊 CMC Markets Feed | USD/JPY (2H)
#USDJPY #ForexAnalysis #BearishBreakdown #TechnicalSetup #PriceAction #TradingView #PULSETRADESFX

Retracement then bearsish.Waitn for my setup, potential hns, retrace to the area of my interest. And down down.
hi everyone im away from the desk but we are still waiting for that short area of 147.590 on the short term trade. long term short trade still waiting for that daily FVG / BOS zone of the 4hr. will share chart set up once back. happy trading everyone
refer to video as its showing all the information im looking at on a day to day
9
0 comments
Leave a comment that is helpful or encouraging. Let's master the markets together
Post

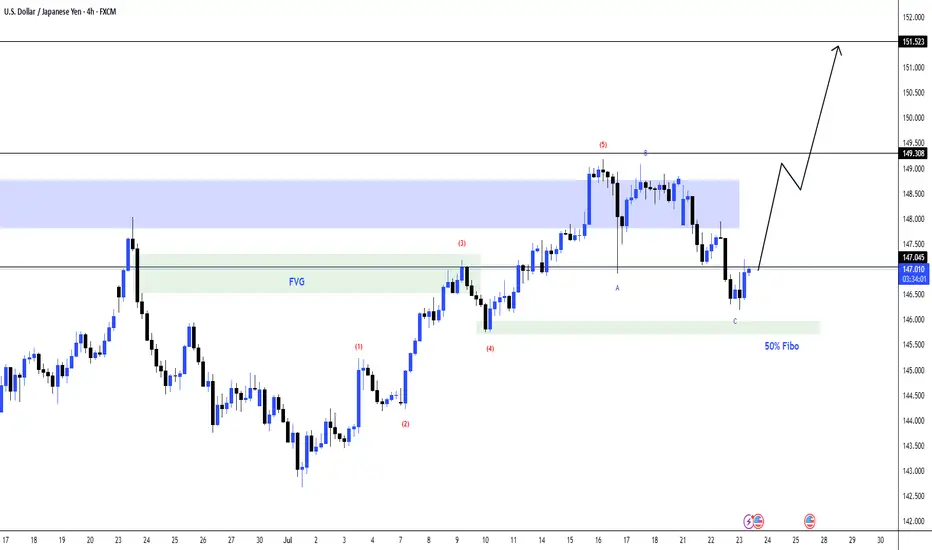
USDJPY 4H Chart Analysis – Bullish Setup in PlayThe USDJPY pair is currently showing signs of a bullish continuation after completing a corrective wave pattern (ABC) down into a strong confluence zone.
📌 Key Technical Insights:
✅ Wave Structure:
The market appears to have completed a 5-wave impulse up, followed by an ABC corrective pattern.
The final leg C has touched the 50% Fibonacci retracement level, aligning with a bullish reaction zone.
✅ Support & Confluence Zone:
Price retraced into the green demand zone marked around the 146.5 level.
This area also aligns with the Fair Value Gap (FVG) and the midpoint of the impulse leg, indicating strong demand interest.
✅ Fair Value Gap (FVG):
Price respected the FVG region twice – first as a breakout, now as a retest.
FVG acts as a dynamic support zone around 146.8–147.2.
✅ Key Resistance & Target Zones:
Immediate resistance lies at 149.30 (previous high and supply zone).
A breakout above this level can trigger a rally toward the 151.50 target, aligning with higher-timeframe resistance.
📈 Potential Bullish Pathway:
As shown on the projection path, price is expected to:
Hold above the 146.5–147.0 demand zone.
Retest 149.30 as resistance.
Continue to push higher toward 151.50, completing a larger bullish leg.
💬 Let me know your thoughts in the comments! Will USDJPY break 151 next?
#USDJPY #ForexAnalysis #ElliottWave #SmartMoney #PriceAction #FVG #TradingView #FX
USDJPY - Bearish BiasThe USD/JPY market currently shows a clear downtrend, as indicated by the break of structure (x-bos) and lower lows formation. The price is expected to retrace upwards towards key smart money areas defined by Lower Time Frame (LTF) Supply Zones highlighted in purple.
Using Fibonacci retracement from the recent swing high to the swing low, key Fibonacci levels—especially around the 0.618 and 0.786 zones—align with these LTF Supply Zones, creating high-probability entry areas for short positions.
The trading plan anticipates a retracement into these supply zones, where bearish price action signals can confirm entries. The ultimate target is set near the previous strong low (around 145.821), aiming to ride the next leg down in alignment with the market structure.
Risk management should involve placing stop losses slightly above the upper boundary of the LTF Supply Zones to protect against false breakouts. Patience is emphasized by waiting for price to reach these confluence zones, combining Smart Money concepts and Fibonacci levels for optimal timing and risk-to-reward profile.

USDJPY is continuing its uptrend, let's BUY✏️ OANDA:USDJPY broke the price channel and continued its uptrend at 151,000. The previous h4 candle wick had a liquidity sweep to 147,000, showing that the buyers are dominating the market. The USDJPY trading strategy will mainly BUY to the old peak around 151,000. When the price breaks 147,000, a corrective downtrend will begin to form.
📉 Key Levels
Support: 148.200 - 147.200
Resistance: 150.100 - 151.100
Buy trigger: Breakout above 148,800
BUY 147,200 (buyer liquidity zone)
Target: 145,000
Leave your comments on the idea. I am happy to read your views.

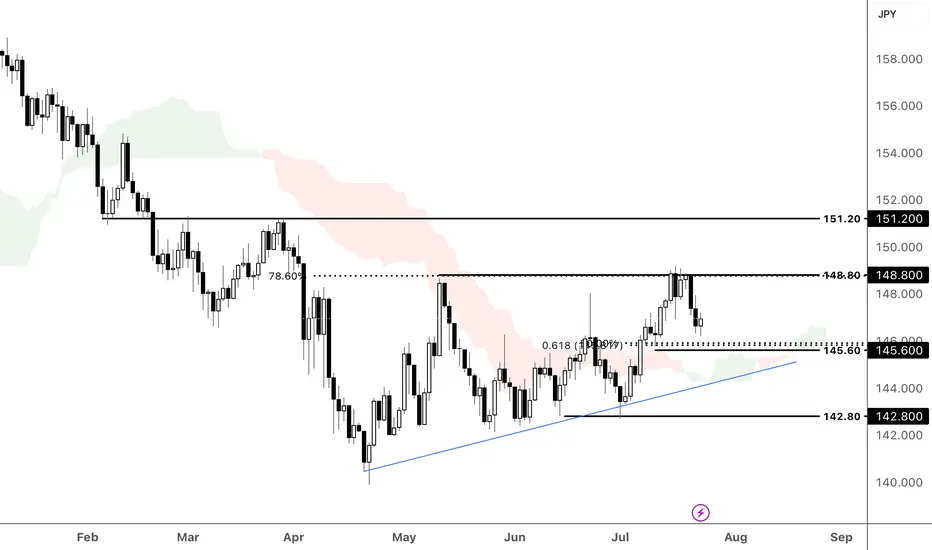
Trump’s 15% Tariff Move -Will It Trigger a USDJPY Trend ReversalThe dollar held firm after Trump announced a preliminary trade deal with Japan, setting a 15% tariff on Japanese imports and securing a 550 bln USD investment pledge. The agreement, which includes opening Japan's market to more US autos and agricultural goods, is part of Trump's broader push for "reciprocal tariffs" ahead of the Aug 1 deadline.
While details remain unclear, especially around potential exemptions for Japanese autos, the deal boosted sentiment in Japanese markets. Traders are watching for further specifics, as uncertainty around implementation and broader tariff risks linger.
From a technical perspective, USDJPY is approaching the support at 145.60, which aligns with an area of Fibonacci confluence. A rebound above 145.60 could prompt a further rise toward the following resistance at 148.80. Conversely, a break below the ascending trendline and support at 145.60 could prompt a further decline toward the following support at 142.80.
By Li Xing Gan, Financial Markets Strategist Consultant to Exness
Improved Buy Signal* Move SL to **Break Even (147.100)** once price hits **147.300**
* After TP1, you can **close half** or stay in full toward TP2 depending on your style

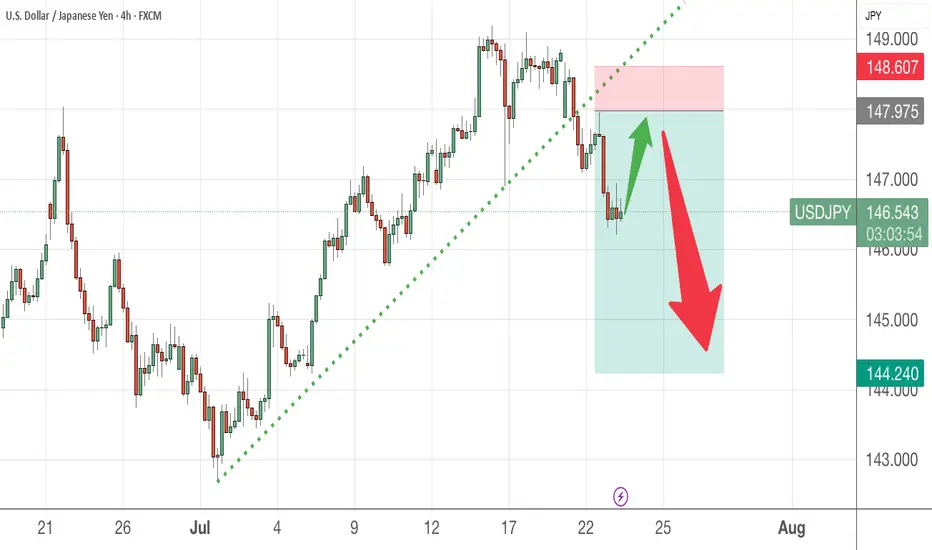
Thanks to Trump, time to short USDJPYLatest news here
You can either LONG the Nikkei 225 CFD or short the USDJPY.
As usual, please DYODD
JPY/USD 6J=F | SMC + LSTM Alignment | Target 0.006881 | VolanX P🚨 Bullish SMC Reversal Confirmed
After sweeping liquidity near 0.006804 equilibrium, price flipped BOS (break of structure) and is now pushing toward premium levels.
🔍 LSTM Model Forecast:
15-day trajectory aligns with upside bias. Short-term bearishness has likely completed.
🎯 Target: 0.006881 (2.414 fib extension)
🛡️ Smart entry was at the mitigation block between 0.006804–0.006820.
🔁 Price has returned to fair value and is now entering expansion.
🧠 VolanX DSS Signal:
SMC: BOS + mitigation + equilibrium tap
Fib cluster: 1.382–2.414 extensions favor bullish momentum
Volume profile confirms absorption
🪙 This may represent the continuation phase of JPY weakness or USD dominance. Monitor closely around 0.006862 (1.382 zone) for reaction.
VolanX Decision Protocol | Forecast Engine: DSS + LSTM AI | Not financial advice.

JPYUSD – Liquidity Grab Complete? VolanX Smart Reversal in Play📈 JPYUSD – Liquidity Grab Complete? VolanX Smart Reversal in Play ⚔️
The Yen just triggered a textbook Smart Money setup.
After sweeping the Equilibrium zone at 0.006738, we saw:
Reversal from the 0.618 Fib confluence (0.006803)
Clear CHoCH + BOS structure confirming demand re-entry
Strong upside magnet: Premium zone near 0.00712
🔍 VolanX DSS Outlook
The system now confirms a bullish reversal scenario with high probability based on:
Demand reactivation off discount levels
USD softening (jobless claims + CPI pressures)
BOJ inching away from ultra-loose policy
Capital rotation favoring defensive pairs like JPY
🧠 Probability Map:
🎯 0.00705–0.00712 = High liquidity target zone
📉 Invalid below 0.006660
📊 Thesis:
JPYUSD appears to be front-running global risk moderation and macro recalibration. VolanX tracks strong confidence in a reversal toward premium.
🔒 Positioning: Long bias maintained
🔔 Alert zones: 0.00688 (breakout), 0.00712 (TP zone)
💡 Powered by VolanX Protocol – Institutional-grade signal engine for macro + AI alpha convergence.
#VolanX #JPYUSD #SmartMoney #FXTrading #LiquiditySweep #VolatilityHedge #MacroTrades #ForexAnalysis #TradingView #WaverVanir

USDJPYUSDJPY Update 🚨
Entered long at 146.370, price is now at 146.895 — currently up +52.5 pips ✅
🧠 Trade idea was based on:
• Clean tap into higher timeframe demand zone
• Strong rejection and bullish engulfing on the 1H
• Solid R:R setup with a clear upside target (149 area)
📌 SL was safely below 146.00
📌 Holding partials now or trailing stops to lock in profits
Let me know if you caught this move too 🔥
Patience + precision = results 💯

USDJPY (daily update) 23/07happy trading everyone, here is the daily usdjpy video update. hope this helps happy trading as always


USDJPY BUY Setup🗾 USDJPY BUY Setup – Reversal from Demand Zone (H1 Analysis)
📅 22 July 2025
USDJPY has shown strong bearish momentum recently, but price has now tapped into a clear demand zone (marked in green), which previously acted as a launchpad for bullish moves.
🟦 Entry: Buy @ 146.37
🔵 SL: Below 146.00 (just beneath demand zone)
🟩 TP: 149.10 – targeting the recent H1 structure high
🔍 Why I took this trade:
• Clean reaction from a historical demand zone
• Strong rejection wick forming on the hourly
• RSI divergence and volume exhaustion confirmed the buy
• Risk-to-reward ratio > 3:1
⏳ Waiting for confirmation on lower timeframes (M15/M5) before scaling in further.
📊 Let’s see how this plays out – following price action closely!

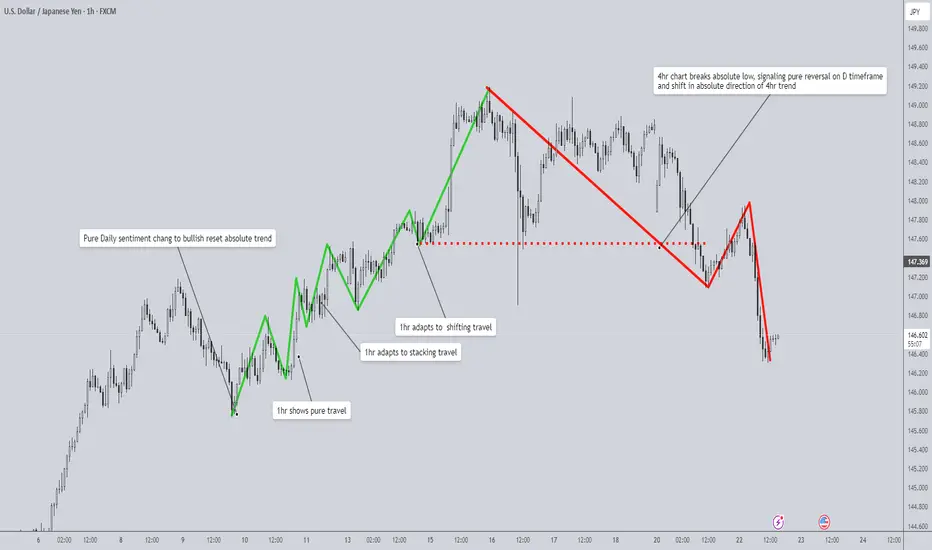
Market Travel: An Adaptive Framework for Tracking Structure🧭 Understanding Market Travel: An Adaptive Framework for Tracking Structure Manually
Market structure can be one of the most challenging patterns to read. There are tools and methods to help interpret it, but none are absolute. As market speed and volatility shift, so does its behavior. That’s why it’s important to move beyond rigid definitions and start understanding how price travels through the market.
What Is Travel?
“Travel” is a concept I developed through personal study and chart work. As price moves, it naturally forms pullbacks—temporary dips toward the weak side—and breaks—moves that close beyond the strong side. These are the two critical phases that form the backbone of market structure.
While most people focus on static patterns, I’ve found more value in learning how price travels through its pullbacks and breaks. These movements aren’t random—they follow clear behavioral patterns. Once you learn to identify these, structure becomes easier to read across timeframes.
The Three Modes of Travel
I've observed three types of travel that occur between the dip and the break:
1. Pure Sentiment Travel
This is the cleanest and most decisive form of travel. Price moves in one dominant direction with little to no opposing candles. For example, in a daily uptrend, the pullback might consist entirely of bearish 4H candles. As soon as a strong bullish candle appears, that typically signals the return toward the trend’s strong high.
2. Stacking Travel
Stacking is more nuanced. Price moves with alternating bullish and bearish candles, but the dominant sentiment stays in control.
Let’s say price is dipping in a daily uptrend. On the 1H chart, you may see a bearish sequence that includes a few bullish candles. These bullish candles don’t invalidate the bearish structure because they fail to close above the pivot high formed between the last bullish leg and the beginning of the bearish move. As long as that high is respected, the bearish stacking is valid.
Once price breaks that high (or, in a bullish stacking case, breaks the pivot low), the stacking order is broken, and that signals a reversal back toward the dominant direction.
3. Shifting Travel
Shifting travel looks similar to stacking but is constantly flipping between bullish and bearish stacking. Each shift creates a new high or low within the shifting structure. These micro-structures form lower lows or higher highs as sentiment switches back and forth.
Once price breaks its own shifting structure (e.g., breaks a bearish sequence with a bullish close), this typically signals the end of that leg of travel and a reversal toward the dominant higher timeframe trend.
How to Apply Travel Across Timeframes
These three types of travel operate in a hierarchy:
- Shifting travel (LTF) respects stacking travel (MTF)
- Stacking travel (MTF) respects pure travel (HTF)
- Pure sentiment travel (HTF) is the master mode that resets the others
When you identify a new pure sentiment shift on the higher timeframe, that becomes your reset point. From that candle forward, you should begin fresh stacking and shifting analysis on your lower timeframes.
Workflow example:
1. Spot a pure sentiment shift on the HTF (e.g., bullish daily candle after a clean bearish pullback)
2. From that pivot low, begin tracking stacking travel on the MTF
3. Use shifting travel on the LTF to navigate inside the stacking structure
If stacking or shifting behavior breaks unexpectedly, that usually means market speed is changing—and you may need to reassign which timeframes serve as HTF, MTF, and LTF.
Why This Works
This framework gives you a fixed point of structure—the dip and the break—but allows you to adapt to the behavior in between. Instead of just reacting to breakouts, you're learning how price moves to get there.
That’s what gives you the edge: not just reading where price is, but how it’s traveling to get there.
Final Thoughts
This adaptive travel model helps break down market structure into something both trackable and flexible. Try observing these travel types in real time and let me know how it works for you.
Tools & Resources
If you’d like to access my Pure Order Flow indicator and more exclusive tools, visit my TradingView profile:
@The_Forex_Steward
I’ve built an arsenal of indicators designed to support this framework across different markets and styles. If this breakdown helped, don’t forget to boost the post so others can benefit from it too!
USDJPY Exposed Bullish zone Key Reversal Zones
Bullish Reversal: 146.450
If price breaks above with confirmed surge in volume (relative to recent baseline), initiate long.
Breakout Confirmed: Price closes beyond reversal level (not just taps). Volume Surge: Spike exceeds previous 3–5 bar average; look for institutional signature (non-retail flow) Trap Signature: Prior candle(s) must show wicks or indecision = fuel for move.
Breakout Compression: Low volume chop signals energy build-up. Sudden spike at level = intention exposed. Through: 2nd candle must confirm; hesitation = abort. Rapid thinning above/below = hidden hands preparing.
The price breaks — but the volume reveals.”
Don’t front-run memory levels. Let the market show its hand, then strike with precision.
Ready for deployment. Set alerts at 146.450 and 147.350.
Monitor volume, not emotion.
Would you like a trade log template or live tracking sheet for this setup?

USDJPY Bearish Breakout!
HI,Traders !
#USD-JPY was trading along
The rising support line but
Now we are seeing a bearish
Breakout so we are bearish
Biased and we will be expecting
A further bearish move down !
Comment and subscribe to help us grow !

USD/JPY - Potential TargetsDear Friends in Trading,
How I see it,
KEY RESISTANCE AREA @ 147.000 - 147.150
1) 145.940 - Swing Area @ 50% Retracement of July rally
2) As long as price remains below key resistance, watch price reaction
at swing area.
3) If this swing area is decisively breached, 145.000 will be targeted next.
I sincerely hope my point of view offers a valued insight.
Thank you for taking the time study my analysis.
