Bullish bounce off major support?USD/JPY is falling towards the pivot, which acts as an overlap support and could bounce to the 1st resistance, which is a swing high resistance.
Pivot: 145.96
1st Support: 144.98
1st Resistance: 149.18
Risk Warning:
Trading Forex and CFDs carries a high level of risk to your capital and you should only trade with money you can afford to lose. Trading Forex and CFDs may not be suitable for all investors, so please ensure that you fully understand the risks involved and seek independent advice if necessary.
Disclaimer:
The above opinions given constitute general market commentary, and do not constitute the opinion or advice of IC Markets or any form of personal or investment advice.
Any opinions, news, research, analyses, prices, other information, or links to third-party sites contained on this website are provided on an "as-is" basis, are intended only to be informative, is not an advice nor a recommendation, nor research, or a record of our trading prices, or an offer of, or solicitation for a transaction in any financial instrument and thus should not be treated as such. The information provided does not involve any specific investment objectives, financial situation and needs of any specific person who may receive it. Please be aware, that past performance is not a reliable indicator of future performance and/or results. Past Performance or Forward-looking scenarios based upon the reasonable beliefs of the third-party provider are not a guarantee of future performance. Actual results may differ materially from those anticipated in forward-looking or past performance statements. IC Markets makes no representation or warranty and assumes no liability as to the accuracy or completeness of the information provided, nor any loss arising from any investment based on a recommendation, forecast or any information supplied by any third-party.
USDJPY trade ideas

Yen Holds Firm as Ishiba Stays in OfficeThe yen hovered around 147.5 per dollar on Tuesday, holding its 1% gain as markets digested Japan’s election outcome. Despite the ruling coalition losing its upper house majority, Prime Minister Shigeru Ishiba is likely to stay in office, easing political concerns. Ishiba confirmed his continued involvement in US trade negotiations. Meanwhile, opposition parties are expected to advocate for fiscal stimulus and tax cuts, which could pressure the yen and push bond yields higher. Trade discussions with the US remain on schedule for the August 1 deadline.
Resistance is at 147.75, with major support at 146.15.
Dollar to Weaken Against Yen Over Next 6 MonthsUSD/JPY is showing signs of a potential downtrend after failing to break above key resistance at 152.00. The pair has formed a double-top pattern on the weekly chart, with RSI divergence signaling weakening bullish momentum. A break below 150.00 could accelerate losses toward 145.00 (200-day MA) and possibly 140.00 over the next 6 months.
The US dollar may weaken as the Fed is expected to start cutting rates in late 2024/early 2025, while the BoJ could cautiously tighten policy if wage growth persists. Narrowing US-Japan yield differentials (10-year yields) would reduce JPY carry-trade appeal, supporting yen strength. MoF’s verbal warnings and past interventions near 152.00 suggest strong resistance to further yen weakness.
Sasha Charkhchian

USD/JPY Possible Bear Scenario🔍 Analysis Summary:
USDJPY has failed to close above 146.1 on the weekly for the past 13 candles, showing clear signs of price exhaustion at this level. Price has also tapped into a marked 8HR bearish order block and printed a Daily Pin Bar — a strong reversal signal indicating potential downside.
📍Key Technicals:
• Resistance Holding: 146.1–146.6 zone
• Bearish Rejection: Pin Bar off resistance + order block
• Risk Area (Stop Zone): Above 147.16
• Target Zones: 144.2 (interim) → 142.4 (swing level)
🛠 Confluence:
• Order block rejection
• Multi-week resistance
• Clean structure with defined R:R
• Bearish candlestick confirmation
📊 Timeframe: 8HR
📉 Bias: Short
🔐 Risk Management: Proper stop loss in place above structure. Use personal risk limits.
⸻
⚠️ Disclaimer:
This setup is for educational and informational purposes only. It is not financial advice or a recommendation to trade. Always conduct your own analysis and use risk management based on your personal trading plan.

USDJPY InsightHello to all our subscribers!
Please feel free to share your personal opinions in the comments. Don’t forget to hit the boost and subscribe buttons!
Key Points
- There were speculations that the Liberal Democratic Party’s election defeat in Japan could lead to Prime Minister Ishiba’s resignation. However, Ishiba announced that he will remain in office, easing concerns and reducing political risk.
- U.S. Treasury Secretary Scott Bessent stated that negotiations are progressing swiftly but emphasized there is no rush to reach a deal. Meanwhile, U.S. Commerce Secretary Howard Lutnick commented that reciprocal tariffs will proceed as scheduled, although negotiations can still continue.
- With the FOMC meeting scheduled for July 31, attention is focused on Fed Chair Powell’s speech on July 22, which is expected to provide clues about the future path of monetary policy.
Key Economic Events This Week
+ July 22: Fed Chair Powell’s speech
+ July 24: ECB interest rate decision
USDJPY Chart Analysis
After breaking above the 148 level and extending gains to the 149 level, the pair quickly reversed and pulled back to the 147 level. Currently, a further decline toward the 146 level appears likely, with strong support expected there. If confirmed, a rebound toward the 151 level is highly probable. However, if price action deviates from expectations, we will promptly revise our strategy.

SYMMETRICAL TRIANGLEGood morning and good afternoon traders, wherever you're dialed in from.
Hope y’all are stacking those pips this week — whether you’re trend-riding, countering swings, or just sitting back letting setups come to you. 🔍
We’ve been hitting precise targets lately, and the tape’s been speaking loud and clear. Doesn’t matter what the sentiment says — we follow price, we follow structure.
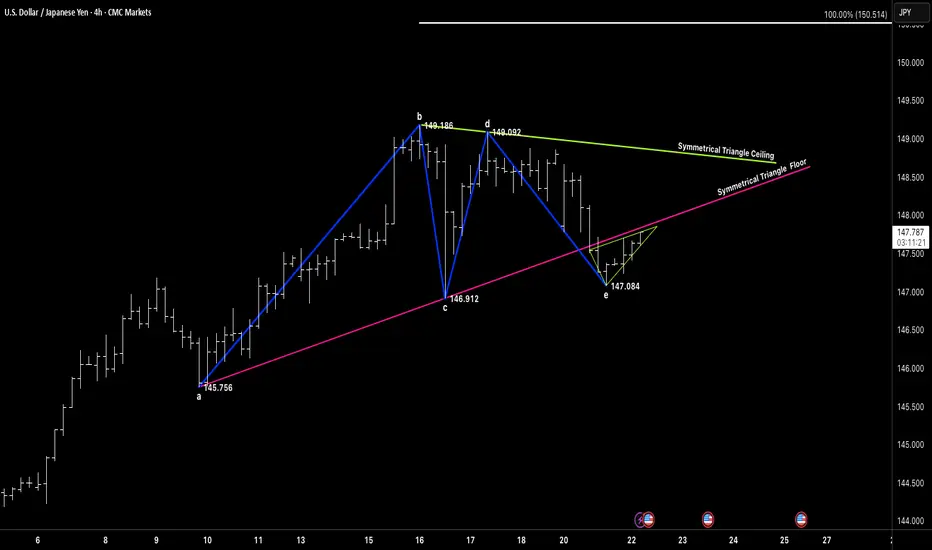
Right now, we’ve got a clean symmetrical triangle unfolding on USDJPY (4H). Marked up from point a to e, with that little fakeout dip at E (147.084) acting like a trap for the impatient. Textbook spring behavior.
What catches my eye is the way price is coiling tight between the triangle’s ceiling and rising floor. We’re hovering just under 147.80, and a decisive push through that ceiling could unlock a sharp move toward the 150.50 zone (symmetrical projection).
If you missed the earlier leg, don’t chase — let price show you real intent. A confirmed breakout above 148.00 is the trigger. If we break back below 146.90, reassess.
No need to guess — we observe, we react. Let the market come to us.
“We don’t force trades. We trade when the market invites us.”
This breakout confirms bullish momentum **we now have the green light to issue a new bullish signal**.

USDJPY - Bullish Bias, In OB ZonePair: USDJPY (UJ)
Bias: Bullish
HTF Overview: Bullish structure remains intact — price currently pushing upward, respecting higher timeframe flow.
Current Zone: Price is now sitting within the 30M OB, showing potential strength but no LTF confirmation yet.
LTF Confirmation: Still in analysis mode — sitting on hands, waiting for clean reaction on 5M or 1M before considering entries.
Entry Zone: 30M OB being monitored closely — ideal setup would include inducement and clear shift before entry.
Targets: Next 1H high remains the first target — extended targets to be trailed if momentum builds.
Mindset Note: Analysis first, execution second. Discipline is the edge — no rush until LTF gives the green light.
Bless Trading!

$USDJPY looking primed for another leg up.FX:USDJPY looking primed for another leg up.
The weekly chart shows a textbook Stage 2 uptrend, holding strong above the 200 EMA. After a healthy pullback, the price is now testing a key pivot level around 147.60, which aligns with a major support zone.
On the 4-hour chart, the Stochastic oscillator is approaching oversold territory, suggesting the recent selling pressure may be exhausted. A bounce from this support could be the catalyst for a move back to the 155-160 resistance area.
#USDJPY #Forex #FX #Trading #Bullish
USDJPY - M15 Downtrend with Supply Zone RetestThe USD/JPY market currently exhibits a downtrend with price rebounding slightly from recent lows. The key focus is the Lower Time Frame (LTF) Supply Zone around 148.2, which acts as a strong resistance level.
The trading plan anticipates the price to rise into this LTF Supply Zone, where selling pressure is expected to resume, leading to a continuation of the downward trend. The ultimate target is near the previous strong low around 146.8, representing a potential demand zone and support level.
This plan suggests watching for price action signals such as rejection wicks or bearish candlestick patterns within the supply zone to confirm entries for short positions. Managing risk involves placing stop losses just above the supply zone to protect against unexpected breakouts.

USDJPY Will Fall! Sell!
Take a look at our analysis for USDJPY.
Time Frame: 2h
Current Trend: Bearish
Sentiment: Overbought (based on 7-period RSI)
Forecast: Bearish
The price is testing a key resistance 147.628.
Taking into consideration the current market trend & overbought RSI, chances will be high to see a bearish movement to the downside at least to 146.784 level.
P.S
Overbought describes a period of time where there has been a significant and consistent upward move in price over a period of time without much pullback.
Disclosure: I am part of Trade Nation's Influencer program and receive a monthly fee for using their TradingView charts in my analysis.
Like and subscribe and comment my ideas if you enjoy them!

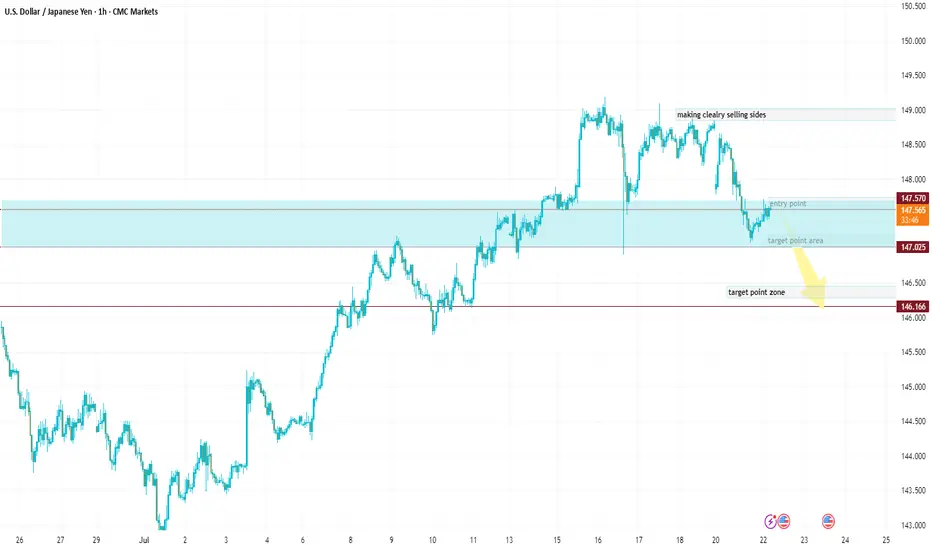
USDJPY Entry Zone: Current market is near your ideal entry zoneEntry Point (for Sell): Around 147.800 – 147.600
🔻 First Target (TP1): 147.050 – Labeled as "target point area"
🔻 Second Target (TP2): 146.300 – Labeled as "target point zone"
🛑 Invalid Zone (Sell Weakens): Above 148.600 – 149.000 (marked as “making clearly selling sides”)
Entry Zone:
Current market is near your ideal entry zone.
A pullback or rejection around 147.800 provides a good short opportunity.
🎯 Take-Profit Zones:
TP1: 147.050 (first support level / structure base)
TP2: 146.300 (major demand zone)
📉 Stop-Loss (SL):
Above 148.600
USDJPY H1 I Bearish Reversal off the 61.8%Based on the H1 chart, the price is rising toward our sell entry level at 147.90, a pullback resistance that aligns closely with the 61.8% Fib retracement.
Our take profit is set at 146.78 an overlap support.
The stop loss is set at 149.05, a swing high resistance.
High Risk Investment Warning
Trading Forex/CFDs on margin carries a high level of risk and may not be suitable for all investors. Leverage can work against you.
Stratos Markets Limited (tradu.com ):
CFDs are complex instruments and come with a high risk of losing money rapidly due to leverage. 66% of retail investor accounts lose money when trading CFDs with this provider. You should consider whether you understand how CFDs work and whether you can afford to take the high risk of losing your money.
Stratos Europe Ltd (tradu.com ):
CFDs are complex instruments and come with a high risk of losing money rapidly due to leverage. 66% of retail investor accounts lose money when trading CFDs with this provider. You should consider whether you understand how CFDs work and whether you can afford to take the high risk of losing your money.
Stratos Global LLC (tradu.com ):
Losses can exceed deposits.
Please be advised that the information presented on TradingView is provided to Tradu (‘Company’, ‘we’) by a third-party provider (‘TFA Global Pte Ltd’). Please be reminded that you are solely responsible for the trading decisions on your account. There is a very high degree of risk involved in trading. Any information and/or content is intended entirely for research, educational and informational purposes only and does not constitute investment or consultation advice or investment strategy. The information is not tailored to the investment needs of any specific person and therefore does not involve a consideration of any of the investment objectives, financial situation or needs of any viewer that may receive it. Kindly also note that past performance is not a reliable indicator of future results. Actual results may differ materially from those anticipated in forward-looking or past performance statements. We assume no liability as to the accuracy or completeness of any of the information and/or content provided herein and the Company cannot be held responsible for any omission, mistake nor for any loss or damage including without limitation to any loss of profit which may arise from reliance on any information supplied by TFA Global Pte Ltd.
The speaker(s) is neither an employee, agent nor representative of Tradu and is therefore acting independently. The opinions given are their own, constitute general market commentary, and do not constitute the opinion or advice of Tradu or any form of personal or investment advice. Tradu neither endorses nor guarantees offerings of third-party speakers, nor is Tradu responsible for the content, veracity or opinions of third-party speakers, presenters or participants.

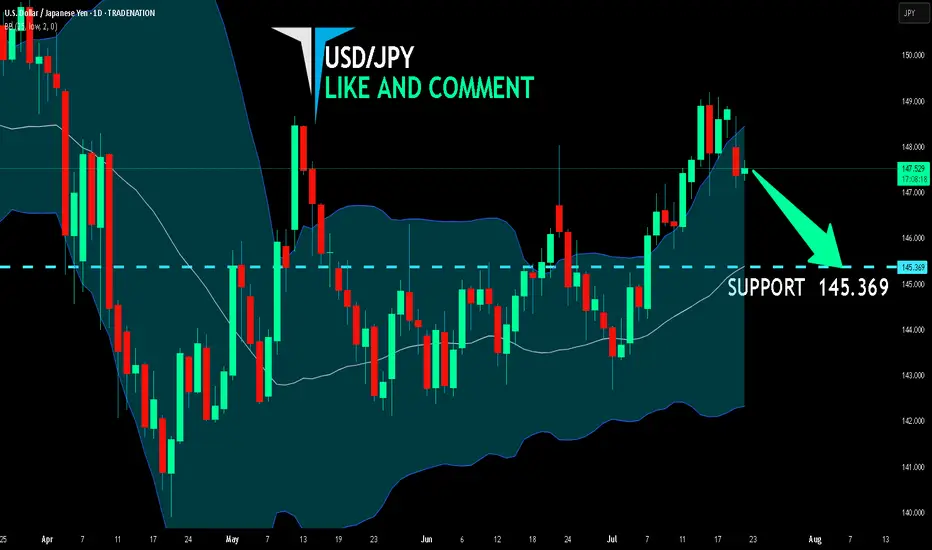
USD/JPY SENDS CLEAR BEARISH SIGNALS|SHORT
Hello, Friends!
USD/JPY pair is trading in a local uptrend which we know by looking at the previous 1W candle which is green. On the 1D timeframe the pair is going up too. The pair is overbought because the price is close to the upper band of the BB indicator. So we are looking to sell the pair with the upper BB line acting as resistance. The next target is 145.369 area.
Disclosure: I am part of Trade Nation's Influencer program and receive a monthly fee for using their TradingView charts in my analysis.
✅LIKE AND COMMENT MY IDEAS✅
USDJPY TREND REVERSAL TRADELooking at 4h chart, our short term bearish channel has been broken indicating a possible reversal. Waiting for this sell setup to trigger. Let me know your thoughts.

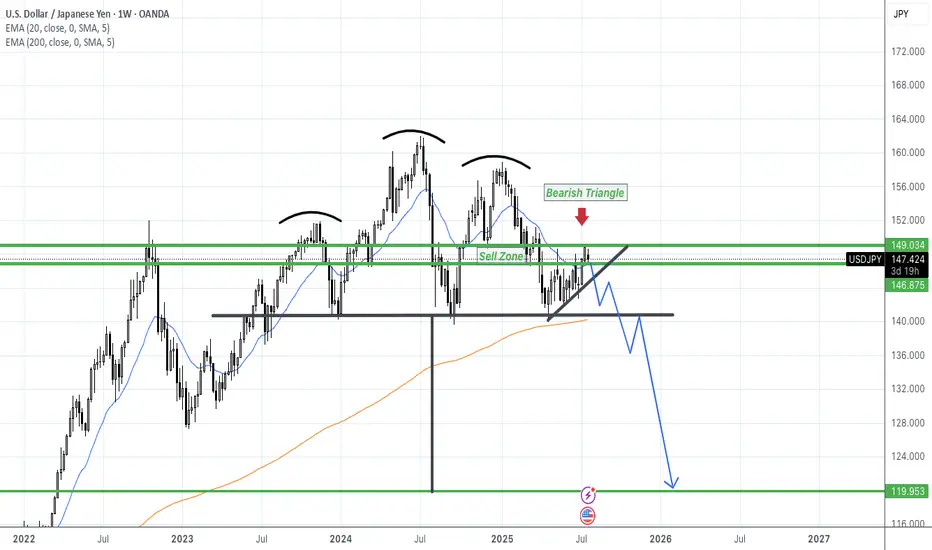
USDJPY SHORTSThe weekly chart shows a clear head and shoulders formation forming under a major bearish descending triangle, with strong rejection from the 149.034–150.000 Sell Zone. Price action continues to print lower highs, and the horizontal support near 140 is weakening under repeated pressure.
Technical Breakdown Highlights:
• Multiple rejections forming the classic head and shoulders reversal structure.
• Price is coiling under resistance, compressing in a bearish triangle, signaling seller strength.
• Bearish momentum could trigger a breakdown toward the 119.950 support zone—nearly 2,700+ pips from current levels.
• 20 EMA is below the 200 EMA—bearish alignment.
⸻
🧠 Macro & Micro Fundamentals Supporting This Setup:
🔻 Macro (Fundamental Pressure on USD):
• The Federal Reserve is shifting dovish as inflation cools and unemployment begins to rise. Markets are now pricing in multiple rate cuts in 2025, which could weaken the USD significantly.
• The 10-year Treasury yield is falling, further reducing USD attractiveness.
• Global de-dollarization and capital flight to alternative assets (gold, crypto, BRICS currencies) adds long-term pressure on USD.
💴 Micro (Supportive Tailwinds for JPY):
• The Bank of Japan is gradually tightening—it has begun to move away from negative interest rates and yield curve control. Any shift in BoJ policy will strengthen the yen dramatically due to Japan’s massive capital flows.
• Japan remains one of the largest global creditors—capital repatriation from Japanese institutions during risk-off cycles supports the JPY.
• Safe haven demand during any geopolitical or recessionary volatility also favors the yen.
⸻
🎯 Target: 120.000
⛔️ Invalid if Weekly Closes >150.000
⏳ Timing: Breakdown likely between Q3 2025 and early 2026 if macro alignment holds.
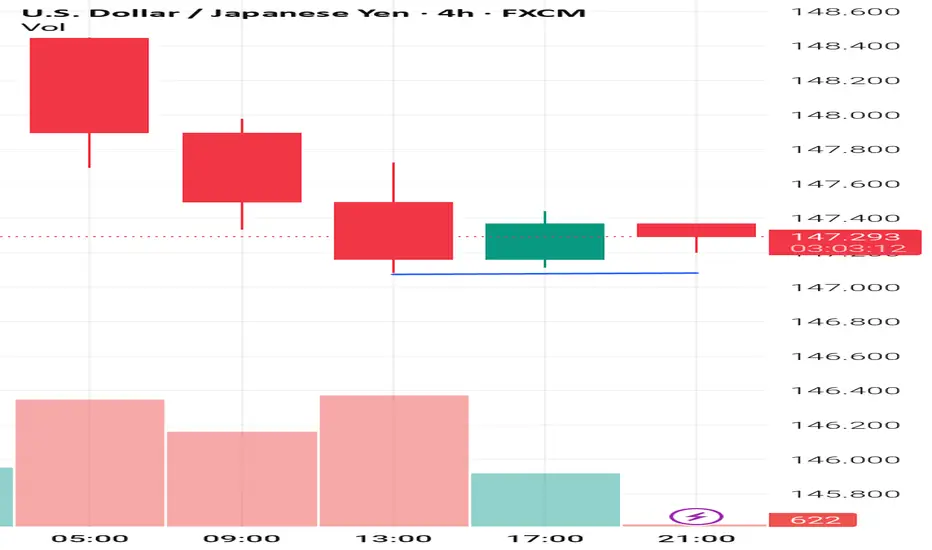
USD/JPY Drops as Market Awaits Powell's RemarksIn today’s trading session, the USD/JPY pair is showing renewed weakness, currently trading around 147.76 — down more than 0.68% from the previous session. The decline is driven by falling U.S. Treasury yields and cautious investor sentiment ahead of an upcoming speech by Federal Reserve Chair Jerome Powell, which is weighing on the U.S. dollar.
From a technical perspective, USD/JPY has broken its short-term uptrend and is approaching a key support level at 147.60. If this level fails to hold, the bearish momentum could extend further.

USD/JPY 4-Hour Forex Chart4-hour chart from FOREX.com displays the exchange rate between the U.S. Dollar (USD) and the Japanese Yen (JPY). The current rate is 147.446, with a slight increase of 0.072 (+0.05%). The chart shows recent price movements, including a notable drop within a highlighted support and resistance zone (light green and pink areas). Buy and sell prices are marked at 147.446 and 147.444, respectively, with additional price levels indicated on the right side ranging from 146.943 to 149.000. The chart includes candlestick patterns and is timestamped up to July 22, 2025.

Fundamental analysis: JPY strength and TV show recommendation The outcome of the Japanese election has created JPY strength. If you placed a short term JPY long based on the election, I would find it difficult to argue. But, personally, I think any JPY strength will be short lived. Essentially due to uncertainty creating a likelihood of a slower pace of BOJ rate hikes (If at all). Meaning, JPY short trades back on the table soon.
Whilst I await a 4hr swing with a 'push up' on JPY charts (for a JPY short). I'd like to recommend a very interesting TV programme I recently watched called FINDING THE MONEY.
Depending on your region you might be able to watch it for free., Living in the UK, I paid about £6 to watch it via Amazon prime.
It won't necessarily make you a better trader, it's just a very interesting watch, particularly if you're curious about the concept of M.M.T and the workings of the financial system.
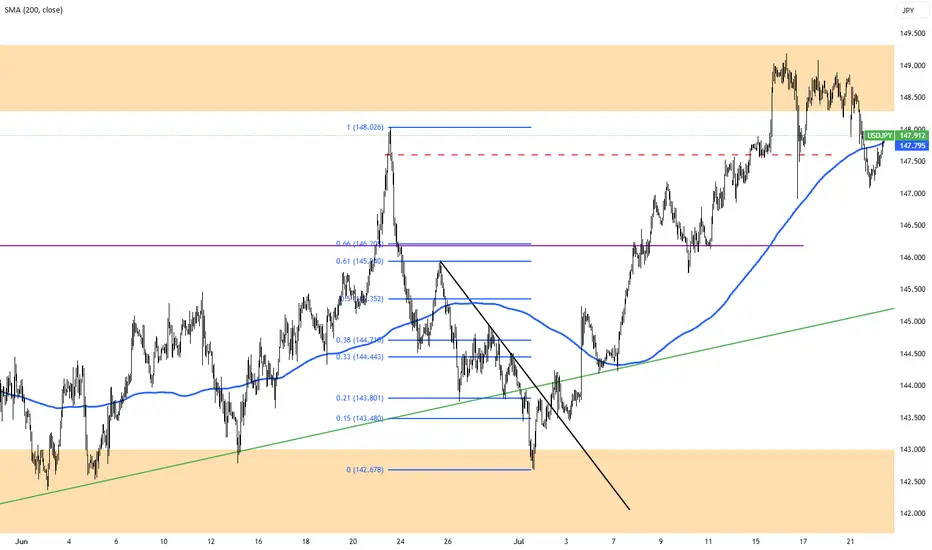
USD/JPY Bearish Reversal Setup with Key Targets and Stop LossThis 4-hour USD/JPY chart suggests a bearish setup. Price has rejected the order block near 149.220 and is heading downward. A support level is marked at 145.268, with the target around 142.637. A stop loss is set above the order block, indicating a short trade setup expecting a continued drop.

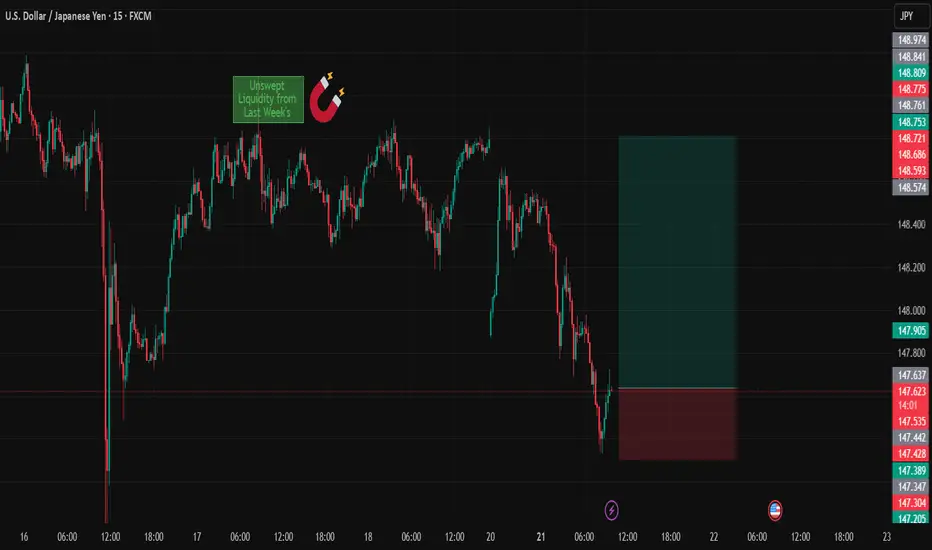
USDJPY (Weekly analysis) 22/07hi everyone please see the weekly analysis i did not do one yesterday as it was a bank holiday in JPY. happy trading everyone

USDJPY
Date:
July 21,2025
Session:
New York Open
Pair:
USDJPY
Bias:
Long
1. Clean liquidity pool left unswept from last week's NYC Open (Thursday).
2. NY session typically retraces or extends from London reversal, giving directional momentum.
Entry:147.544
Stop Loss:147.250
Target:148.794
RR:4.11
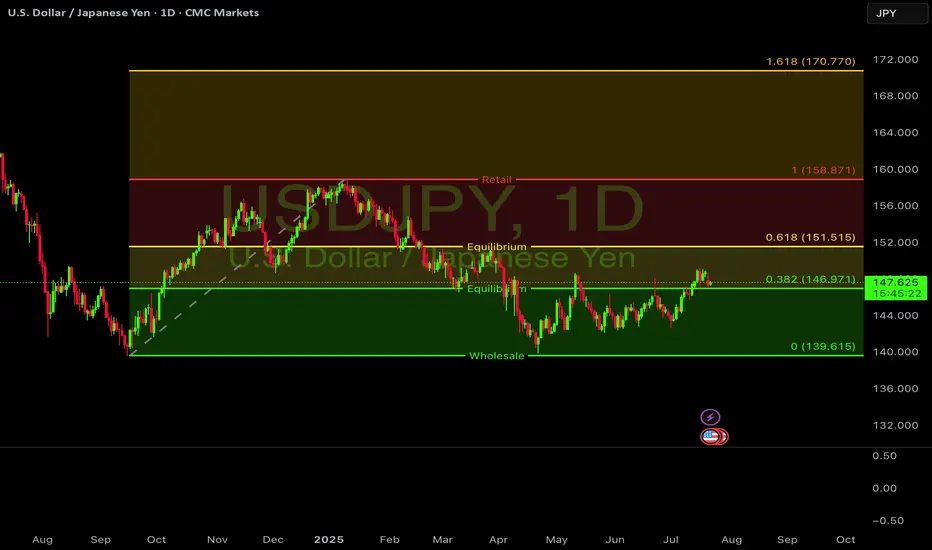
USD/JPY Fibo Support Test NearbyUSD/JPY continues to brew traps on both sides of the pair as last week's push up to fresh three-month highs has been followed by a decisive snap back in the pair. The drive behind the move is also of interest, as Japanese election results over the weekend haven't been completely digested by Japanese markets, as they were closed on Monday for a public holiday. So the next 24 hours will be key for seeing the way that this theme gets priced-in.
In USD/JPY, there's a support level nearby in the form of the 61.8% retracement of the September-January move. Notably, this was the price that caught the low last Wednesday after the Trump-fueled sell-off took over in the USD, just after the threat to fire Jerome Powell.
Fears of a more dovish Fed make sense for USD-weakness as that could pressure further unwind of the carry trade. But with the LDP losing a majority in the upper chamber, it seems that greater political vulnerability would make for a more difficult road for the Bank of Japan to hike rates. Nonetheless, the response to support is what matters here, and there's quite a bit of structure lurking below the Fibonacci level, with 146.54 and 145.93 both of note, and that's before the 145.00 level comes back into play. - js
