USD/JPY(20250714)Today's AnalysisMarket news:
① Fed's Goolsbee: The latest tariff threat may delay rate cuts. ② The Fed responded to the White House's "accusations": The increase in building renovation costs partly reflects unforeseen construction conditions. ③ "Fed's megaphone": The dispute over building renovations has challenged the Fed's independence again, and it is expected that no rate cuts will be made this month. ④ Hassett: Whether Trump fires Powell or not, the Fed's answer to the headquarters renovation is the key.
Technical analysis:
Today's buying and selling boundaries:
147.02
Support and resistance levels:
148.39
147.88
147.55
146.49
146.15
145.64
Trading strategy:
If the price breaks through 147.55, consider buying, and the first target price is 147.88
If the price breaks through 147.02, consider selling, and the first target price is 146.49
USDJPY trade ideas

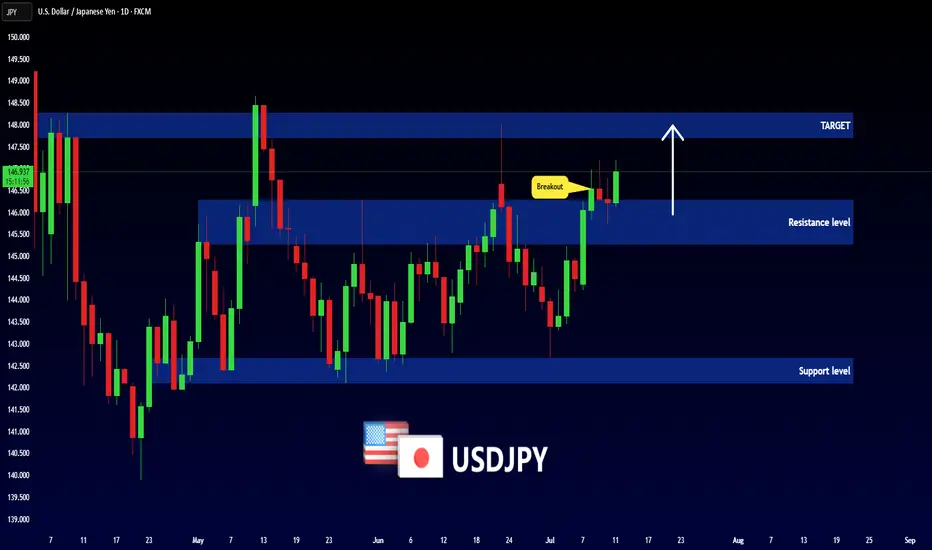
USDJPY - NEW BREAKOUT !Hello Traders !
After a huge bullish move,
The USDJPY broke the resistance level (146.285 - 145.280).
This key level becomes new support!
So, I expect a new bullish move🚀
_______________
TARGET: 147.700🎯
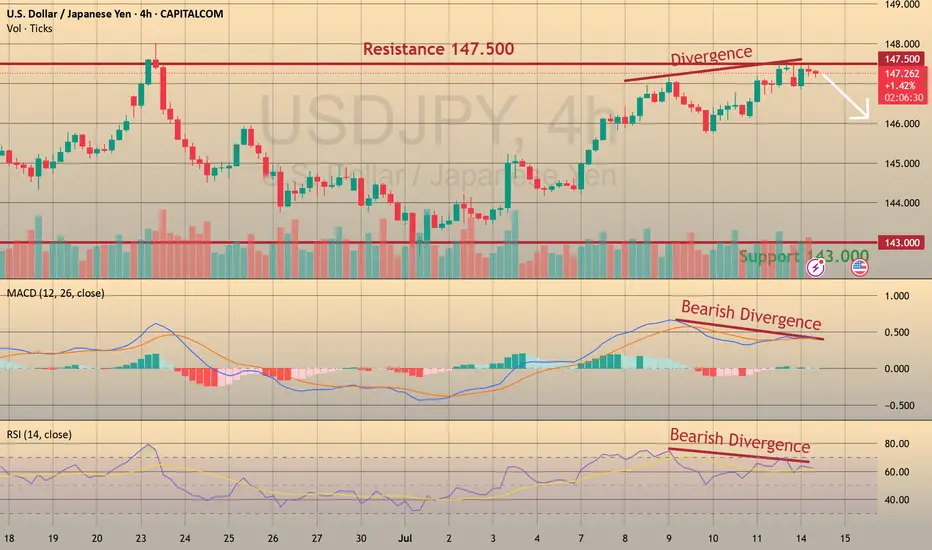
USDJPY: Bearish Divergence – Eyeing Shorts to 143 CAPITALCOM:USDJPY
We’re seeing strong bearish divergence in USDJPY near the 148 resistance zone, shifting our focus to short opportunities with a medium-term target at 142.
📈 Trading Plan:
🔻 SELL Stop: 147.040
❌ Stop Loss: 149.220
✅ Take Profit: 143.000
(Click 👉 Trade Now 👈 on your mobile to copy SL & TP easily)
🔍 Why am I short here?
✅ Technical: Clear bearish divergence on the H4 (RSI & MACD), indicating potential reversal signals.
✅ Resistance Zone: Price is testing the key 148 resistance, providing an ideal risk-reward location for shorts.
✅ Macro Event: Ahead of tomorrow’s US CPI release, a conservative trade structure is maintained to manage volatility risks.
📰 Fundamental Snapshot:
Japan’s economy shows signs of stabilization:
Core machinery orders fell only 0.6% MoM in May to ¥913.5B, much better than April’s -9.1% and forecasts of -1.5%.
Despite the headline decline, it indicates resilience in Japan’s capital spending, supporting the JPY’s medium-term outlook amid global trade and growth risks.
Trade cautiously!

USDJPY BreakdownPro Tip: I believe the is an order block that is being executed every time a session starts, whether it be the London or the New York Session.

Bullish trend in USDJPY PairIn chart it's showing bullish trend and after checking divergence it's bearish divergence, So I am taking my trade in sell stop and booking TP 1 and TP 2.

dollar bullish against all currenciesReversal of pattern
Rsi divergernce
2 bull point
RRR 1:2
breakeven after 1:1
Risk 1, 2%

USDJPY| - Bullish Play Within Bearish HTF ContextHTF Overview (4H): Structure is still technically bearish, with buy-side liquidity (BSL) untouched and a major 4H supply OB unmitigated above. Expecting price to seek out that zone before any full reversal.
MTF Refinement (30M): Refined structure shows a potential bullish leg forming to push toward the 4H supply. Price is reaching for nearby sell-side liquidity (SSL), acting as inducement.
Execution Plan: Waiting for a clean sweep of SSL. Once that occurs and the 30M OB is mitigated, I’ll drop to LTF (1M/5M) to confirm bullish intent with CHoCH or BOS before executing a long.
Mindset: Playing the internal bullish wave with precision while respecting higher timeframe narrative. Quick to react if the HTF bias reasserts itself.
Bless Trading!

Heading into pullback resistance?The USD/JPY is rising towards the pivot, which is a pullback resistance and could reverse to the 1st support.
Pivot: 148.44
1st Support: 143.24
1st Resistance: 151.23
Risk Warning:
Trading Forex and CFDs carries a high level of risk to your capital and you should only trade with money you can afford to lose. Trading Forex and CFDs may not be suitable for all investors, so please ensure that you fully understand the risks involved and seek independent advice if necessary.
Disclaimer:
The above opinions given constitute general market commentary, and do not constitute the opinion or advice of IC Markets or any form of personal or investment advice.
Any opinions, news, research, analyses, prices, other information, or links to third-party sites contained on this website are provided on an "as-is" basis, are intended only to be informative, is not an advice nor a recommendation, nor research, or a record of our trading prices, or an offer of, or solicitation for a transaction in any financial instrument and thus should not be treated as such. The information provided does not involve any specific investment objectives, financial situation and needs of any specific person who may receive it. Please be aware, that past performance is not a reliable indicator of future performance and/or results. Past Performance or Forward-looking scenarios based upon the reasonable beliefs of the third-party provider are not a guarantee of future performance. Actual results may differ materially from those anticipated in forward-looking or past performance statements. IC Markets makes no representation or warranty and assumes no liability as to the accuracy or completeness of the information provided, nor any loss arising from any investment based on a recommendation, forecast or any information supplied by any third-party.

USDJPY: Bullish Continuation After Breakout📈 USDJPY is set to increase further in price after breaking through a significant daily/intraday horizontal resistance.
The next target is 147.81.

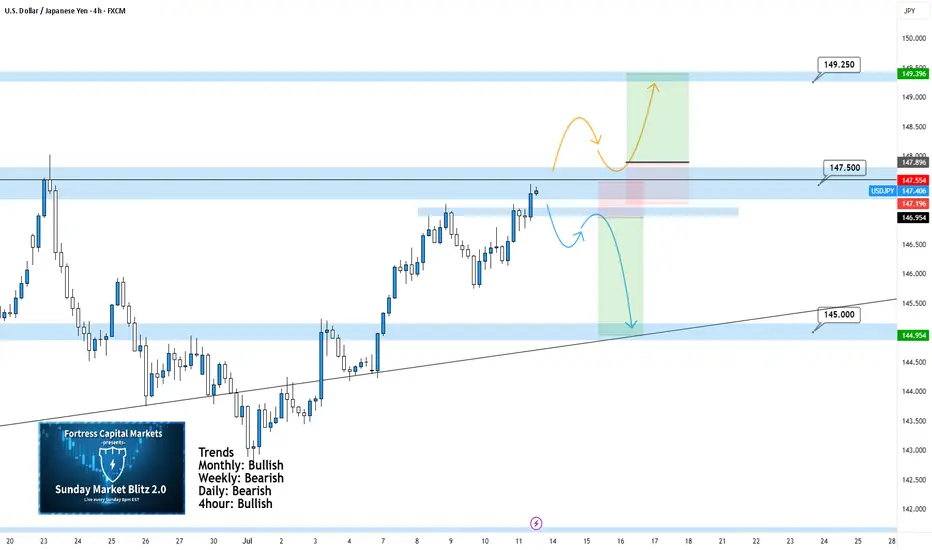
USDJPY 4Hour TF - July 13th, 2025USDJPY 7/13/2025
USDJPY 4Hour Neutral Idea
Monthly - Bullish
Weekly - Bearish
Daily - Bearish
4Hour - Bullish
Finally UJ is looking more clear. We’re now able to drop to the 4Hour instead of the Daily TF due to price action reaching a major zone of anticipated reactions.
As always we’re looking at two trade scenarios going into the week ahead:
Bullish Continuation - UJ is currently sitting at 147.500 resistance and closed there last week. Going into this week we could see the bullish trend continue but we would need to see a clear break of 147.500 resistance to gain confidence. Look for a higher low confirmed above 147.500 followed by strong bullish setups to enter long on. Look to target higher toward major resistance levels like 149.250 area.
Bearish Reversal: Despite the strong bullish momentum we saw from last week, a reversal is still possible as price action is near our 147.250 zone. In order to consider bearish setups we would need to see strong rejection from the current level of resistance. Look to target lower toward 145.000 support.
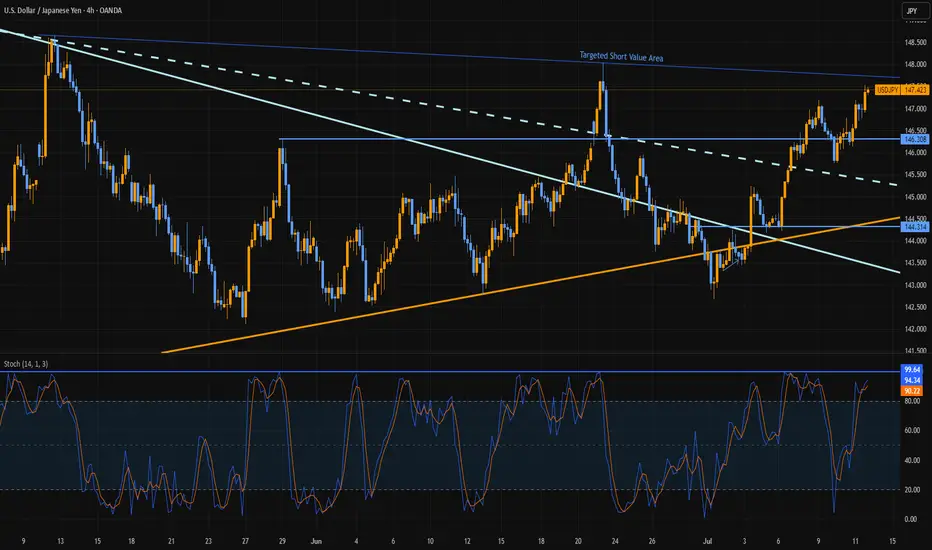
An Emerging ceiling in play for USDJPYCurrent levels are approaching to a multiple potential, and one very big, resistance area. Also move stochastic over these levels are rare. Closing over 147.50 on weekly is not seen since before April moves. But not discounting possibility of this move going over 148.00.
I'm operating with value areas above 147.80 for a short. Stops are well above 149.20. Targeting a pull back 142.80 area.
USD/JPY) LOGN TIME Analysis Read The captionSMC trading point update
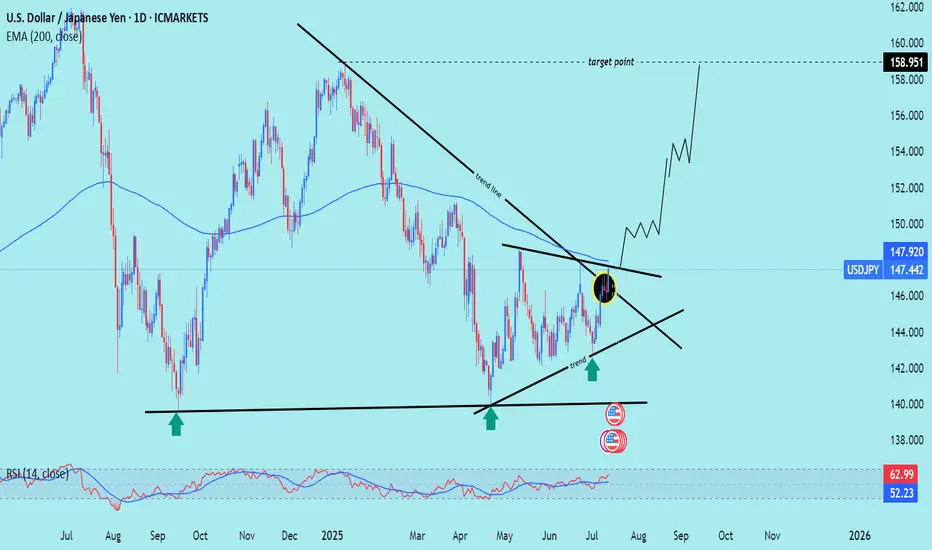
Technical analysis of USD/JPY on the daily timeframe, highlighting a long-term downtrend reversal with potential for significant upside.
---
Analysis Summary
Pair: USD/JPY
Timeframe: Daily
Current Price: 147.442
Bias: Bullish breakout from a descending wedge structure.
---
Key Technical Insights
1. Descending Trendline Break:
Price has broken above the long-term downtrend line, signaling a reversal.
Breakout area is circled in yellow, confirming bullish intent.
2. Trendline & Structure Support:
Multiple rejections from the ascending support trendline (marked by green arrows) confirm accumulation and higher lows.
3. 200 EMA as Dynamic Resistance/Support:
Price is now above the 200 EMA (147.920) — a bullish signal, turning resistance into support.
4. RSI (14):
RSI at 62.99, approaching overbought territory, but still has room to push further.
---
Target Point
Target: 158.951
Based on measured move from wedge breakout and historical resistance level.
---
Trade Setup Idea
Direction Entry Stop-Loss Target
Buy 147.40–147.60 Below 145.80 158.95
Mr SMC Trading point
---
Summary
This chart signals a major bullish breakout on USD/JPY, with the break of a year-long downtrend structure, reclaiming the 200 EMA. If this breakout sustains, price could aim for 158.95 in the coming weeks.
Please support boost 🚀 this analysis)
USDJPY LONG & SHORT – WEEKLY FORECAST Q3 | W29 | Y25
💼 USDJPY LONG & SHORT – WEEKLY FORECAST
Q3 | W29 | Y25
📊 MARKET STRUCTURE SNAPSHOT
USDJPY is currently reaching for a key higher time frame supply zone, looking for price action to show weakness at premium levels. Structure and momentum are now aligning for a short opportunity backed by multi-timeframe confluence.
🔍 Confluences to Watch 📝
✅ Daily Order Block (OB)
Looking for Strong reaction and early signs of distribution.
✅ 4H Order Block
Break of internal structure (iBoS) confirms a short-term bearish transition.
✅ 1H Order Block
📈 Risk Management Protocols
🔑 Core principles:
Max 1% risk per trade
Only execute at pre-identified levels
Use alerts, not emotion
Stick to your RR plan — minimum 1:2
🧠 You’re not paid for how many trades you take, you’re paid for how well you manage risk.
🧠 Weekly FRGNT Insight
"Trade what the market gives, not what your ego wants."
Stay mechanical. Stay focused. Let the probabilities work.
🏁 Final Thoughts from FRGNT
📌 The structure is clear.
The confluences are stacked.
Let execution follow discipline, not emotion.

USD/JPY "The Ninja Heist" – Bullish Loot Grab!🌟 Hey, Thieves & Market Bandits! 🌟
💰 Ready to raid the USD/JPY "The Gopher" vault? 💰
Based on 🔥Thief Trading Style🔥 (technical + fundamental heist analysis), here’s the master plan to swipe bullish profits before the market turns against us! Escape near the high-risk Yellow MA Zone—overbought, consolidation, and bear traps ahead! 💸 "Take the money and run—you’ve earned it!" 🏆🚀
🕵️♂️ Heist Strategy:
📈 Entry (Bullish Raid):
The vault’s unlocked! Buy any price—this heist is LIVE!
Pullback lovers: Set buy limits at recent/swing lows for extra loot.
🛑 Stop Loss (Escape Route):
Thief SL at recent/swing low (4H/Day trade basis).
Adjust based on your risk, lot size, and multiple orders.
🎯 Target (Profit Escape):
147.500 (or flee earlier if bears ambush!)
⚔️ Scalpers’ Quick Strike:
LONG ONLY! If rich, attack now. If not, join swing traders & rob slowly.
Trailing SL = Your bodyguard! 💰🔒
💥 Why This Heist?
USD/JPY "The Ninja" is bullish due to key factors—check:
📌 Fundamental + Macro + COT Report
📌 Quantitative + Sentiment + Intermarket Analysis
📌 Future Targets & Overall Score (Linkks In the profile!) 🔗🌍
🚨 Trading Alert (News = Danger!):
Avoid new trades during news—volatility kills!
Trailing SL saves profits on running positions.
💖 Support the Heist Team!
💥 Smash the Boost Button! 💥
Help us steal more money daily with Thief Trading Style! 🏆🚀
Stay tuned—another heist is coming soon! 🤑🎯

USD/JPY Profit Heist – Are You In or Missing Out?"🔥💰 "USD/JPY NINJA HEIST: Bullish Loot Before the Trap! (Thief Trading Style)" 💰🔥
🌟 Attention Market Robbers & Profit Takers! 🌟
🚨 Thief Trading Alert: USD/JPY "The Ninja" is primed for a BULLISH HEIST!
Based on our stealthy technical & fundamental analysis, we’re locking in a long entry strategy. The plan? Loot profits before the RED ZONE danger hits! Overbought? Maybe. Risky? Sure. But the real robbery happens before the bears wake up! 🏴☠️💸
🎯 ENTRY: The Vault is OPEN!
Buy Limit Orders: Swipe the dip on pullbacks or jump in at key swing lows.
Aggressive? Enter now & ride the wave!
🛑 STOP LOSS (Thief-Style Escape Plan):
Swing Low (5H TF): 143.600 (Adjust based on your risk & lot size!)
Multiple orders? Scale SL wisely—don’t get caught!
🎯 TARGETS:
Main Take-Profit: 151.000 (Or escape earlier if the trap triggers!)
Scalpers: Only play LONG—trail your SL & lock in quick loot!
📢 SCALPERS & SWING TRADERS:
Got deep pockets? Ride the wave now!
Small account? Join the swing heist & rob the trend slowly!
📈 WHY USD/JPY?
Bullish momentum + Macro/Fundamental tailwinds!
COT Report, Sentiment, & Intermarket Analysis all hint at more upside! go ahead to check 👉🔗🌏
⚠️ WARNING: NEWS = VOLATILITY!
Avoid new trades during high-impact news!
Trailing SL = Your best friend! Protect profits & avoid jail (stop-out)!
💥 BOOST THIS IDEA TO SUPPORT THE HEIST!
More boosts = More robberies = More profits for YOU!
Stay tuned—next heist coming soon! 🚀💰
🔥 Like, Share, & Follow for Daily Steals! 🔥

USDJPY M15 Support & Resistance Levels🚀 Here are some key zones I've identified on the 15m timeframe.
These zones are based on real-time data analysis performed by a custom software I personally developed.
The tool is designed to scan the market continuously and highlight potential areas of interest based on price action behavior and volume dynamics.
Your feedback is welcome!

usd jpy possible scenariousd jpy possible scenario seems like a pattern is emerging lets see hope you good luck

usdjpy head and shoulder emergingexperimental !!! it can be a possible scenario , pls feel free to coment and share your ideas with me hop you have green portfolio!!!

USD JPY ACa possible scenario it should hit for tomorrow .
I'm so lost in this market nothing seem to work .still try to survive. a strategy that works for days or even a month dosent have a guarantee to work for next month ,every thing is like gamble . im trying so hard too many ways too see the holy grail yet till now i can say it with trust there is not a easy peasy holy grail of trading ... be ready to looose and be ready to maybe not to gain anything ,, this trading stuff is like an art as u drown in it it only cuase insanity . right now i gotta go ill use trading view as journal now on to see what im doing good luck have fun trading

USDJPY Analysis : Major Move Loading Towards Target Zone🕵️♂️ Overview
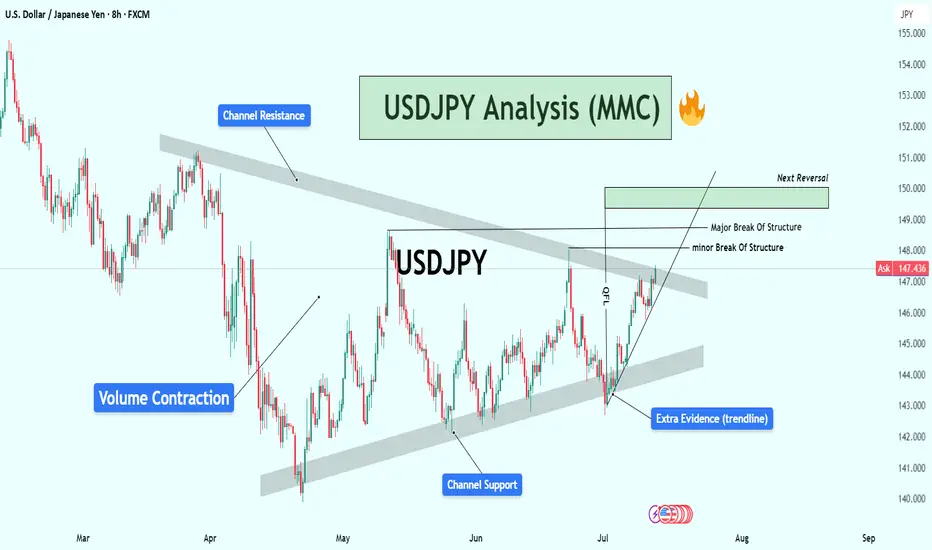
The USDJPY pair is approaching a critical turning point within a well-established descending channel structure. After several months of corrective movement and internal structure shifts, the market is now displaying multiple layers of confluence pointing toward an impending major reaction or reversal. Let’s break down this chart step by step.
🧱 Market Structure Analysis
🔹 Descending Channel:
The entire chart is governed by a broad descending channel, with price making lower highs and lower lows since early March.
Each touch of the channel support has led to a bounce, and the price is now once again near channel resistance, creating a possible reaction zone.
🔹 Volume Contraction Phase:
In the mid-section of the chart, we observe volume contraction, indicating liquidity drying up and buyers/sellers entering a phase of uncertainty.
This contraction is typical in accumulation or re-accumulation phases, which often precede strong impulsive moves — exactly what followed here.
🧩 Structural Breaks and Trendline Clarity
🔸 Minor Break of Structure:
A recent high was taken out in early July, marking a minor break of structure (BOS), showing the first signs of bulls taking short-term control.
🔸 Major Break of Structure:
A more significant high (marked on the chart) has also been broken, confirming a major BOS — this implies institutional positioning or a shift in market sentiment.
🔸 Trendline Break – Extra Confirmation:
The bullish push came after breaking a clean internal trendline, which acted as diagonal resistance.
Once this trendline broke, price aggressively accelerated upward — this is a classic market maker cycle (MMC) Phase 2 (expansion) move.
📍 Confluence at Next Reversal Zone (149.00 – 150.00)
The green highlighted zone is the next potential area for bearish pressure to return, based on:
Key Supply Zone: Historical area where sellers previously dominated.
Channel Resistance Confluence: Top of the descending channel aligns with this zone.
Psychological Level: 150.00 is a major psychological round number — often attracts profit-taking and institutional activity.
Fibonacci (if plotted): Likely 78.6% – 88.6% retracement from last swing high.
Overextended Rally: Price has rallied strongly since early July with very little correction — it’s approaching exhaustion.
🔄 Market Maker Cycle (MMC) Alignment
This move perfectly reflects the Market Maker Cycle:
Accumulation: During volume contraction phase.
Manipulation: Fakeouts near channel support to trap shorts.
Expansion: Break of structure + trendline, aggressive rally.
Distribution (Next): Likely to occur at the 149–150 zone with a sharp rejection.
🧠 Trader’s Plan – What to Look For
📈 If Bullish:
Targets: 148.80 to 149.80 zone
Hold until rejection signs (bearish candles, volume spikes, divergences)
SL: Below recent swing low/trendline (~146.00)
📉 If Bearish (After Rejection):
Watch for:
Strong bearish engulfing candle or shooting star
RSI/MACD divergence (not shown but suggested)
Break of short-term ascending trendline
Targets: Back toward 145.50 or mid-channel (dynamic)
🔖 Summary
USDJPY is showing clear signs of bullish exhaustion near the upper channel resistance and major structure levels. If price respects this zone (149–150), expect a healthy corrective leg or full reversal. Multiple layers of technical evidence, including structure breaks, trendline breach, and MMC phases, are aligning for a high-probability play.
This is a textbook setup for experienced traders watching key zones with proper confirmations.
USDJPY Is Very Bearish! Short!
Take a look at our analysis for USDJPY.
Time Frame: 9h
Current Trend: Bearish
Sentiment: Overbought (based on 7-period RSI)
Forecast: Bearish
The market is testing a major horizontal structure 147.419.
Taking into consideration the structure & trend analysis, I believe that the market will reach 146.283 level soon.
P.S
Please, note that an oversold/overbought condition can last for a long time, and therefore being oversold/overbought doesn't mean a price rally will come soon, or at all.
Disclosure: I am part of Trade Nation's Influencer program and receive a monthly fee for using their TradingView charts in my analysis.
Like and subscribe and comment my ideas if you enjoy them!

USDJPY (weekly analysis) 13/07hi everyone hope you are having a good weekend. here is the weekly analysis. have a good day and happy trading.
