USD/JPY short: Clash of the TitansHello traders
I entered into a short GBP/JPY position last week after the contraction in GBP Industrial, manufacturing production and GDP. The United Kingdom is also struggling with their own version of the Big Beautiful Bill. The difference is of course that there is no Republican Congress there who is willing to throw their constituents under the bus by cutting Medicaid.
The technical side of USD/JPY is vanilla but the fundamental side is a whole other enchilada.
The sweeping tariffs from Liberation Day MAY become a moot market mover if the Federal Court of Appeals side with the International Trade Court after July 31st. It does not mean that all tariffs will become null and void. My previous IDEA elaborates a little on this.
The Israel/Gaza conflict is still simmering and has just been turned up a notch after an American/Palestinian was beaten to death by West bank settlers. Tragic.
There is no certainty how Iran may still retaliate against the USA after the nuclear site strikes.
The BIG one: President Donald J Trump is finally standing up to Vladimir Putin by announcing the shipment of Patriot missiles to Ukraine. This is a major milestone and turning point for President Trump who was previously under the impression that he can manage Foreign Policy by cozying up to the Russian and North Korean strongmen. Welcome to the real world. Putin, Xi Jinping and Kim Jong Un have been scheming behind your back to support the war against Ukraine.
This is the point where the fictional Dutch boy who used his finger to prevent a leaking dike to prevent a flood might be you, President Trump.
The safety and security of the entire Western World rests on your shoulders at this precise point in time. If Russia conquers Ukraine, it will only be a matter of time before the next European Sovereign country becomes a target. Should this happen, it will also serve as a proxy for the Chinese invasion of Taiwan. And North Korea invading South Korea. Bit of a stretch but not impossible.
Against this background, moving funds into the traditional safe havens of JPY, CHF and Gold make senses and I contend that BTC has joined the list.
Super long dated JPY 40Y bonds have also ticked up in anticipation of upcoming elections and conflicting policies.
The American people definitely do not have the desire or political will to enter into another war BUT it is maybe time for us to become the International Order Sheriff again. Towards this end, I am finally willing to call you my President and Commander in Chief, DJT.
Please be the Titan who does not pick on his own citizens and stand up to the real danger on our planet. Godspeed.
USDJPY trade ideas

USDJPY Short: Completion of Triple Combination Sub-wave 2Hello everyone! Over in this video, I analyzed the USDJPY and go through how I counted the waves and go through the lower levels sub-wave counts. I believe that USDJPY has completed a triple combination with the Z wave as a 5-wave structure. I talk about how this final wave might not be ideal and propose how the waves might be viewed in a different perspective. However, I believe also that the price is now good enough to short and propose a scaling-in method to short USDJPY.
Eventually, I think that USDJPY will go down to the lower trendline and break it. However, we will have to revisit the chart again when it does to see how the waves unfolded and then decide how to trade it.
Finally, as always, keep your risk tight and Good luck!

USDJPY InsightHello to all subscribers,
Please feel free to share your personal thoughts in the comments. Don’t forget to like and subscribe!
Key Points
- U.S. President Trump raised tariff uncertainty by sending tariff letters to 25 countries, but mentioned that “negotiations remain open with major trading partners like the EU,” reigniting TACO trading sentiment.
- Trump warned that if Russia does not reach a ceasefire agreement with Ukraine within 50 days, the U.S. will impose “secondary tariffs” on Russia and any countries conducting trade with it.
- BOE Governor Andrew Bailey hinted that the Bank of England could cut interest rates more aggressively if needed.
Key Economic Events This Week
+ July 15: U.S. June Consumer Price Index (CPI)
+ July 16: U.K. June CPI, U.S. June Producer Price Index (PPI)
+ July 17: Eurozone June CPI
USDJPY Chart Analysis
The pair showed a mild upward trend near the 142 level and successfully rose to the 148 level. The direction is expected to shift around the 148 resistance. If it fails to break through, a decline back to 142 is likely. However, if it breaks above 148, a further rise toward the 151 level is expected.

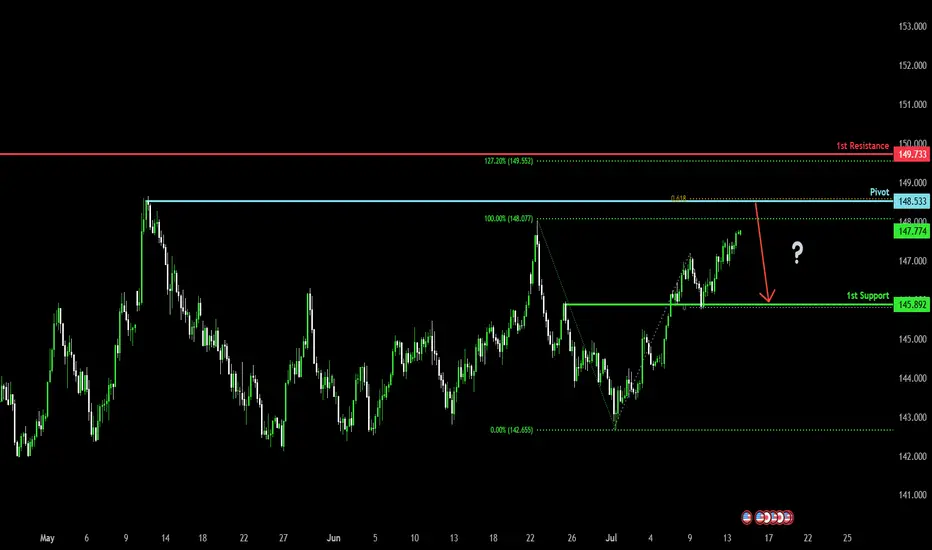
Could the price reverse from here?USD/JPY is rising towards the pivot which is a swing high resistance and could reverse to the 1st support which acts as an overlap support.
Pivot: 148.53
1st Support: 145.89
1st Resistance: 149.73
Risk Warning:
Trading Forex and CFDs carries a high level of risk to your capital and you should only trade with money you can afford to lose. Trading Forex and CFDs may not be suitable for all investors, so please ensure that you fully understand the risks involved and seek independent advice if necessary.
Disclaimer:
The above opinions given constitute general market commentary, and do not constitute the opinion or advice of IC Markets or any form of personal or investment advice.
Any opinions, news, research, analyses, prices, other information, or links to third-party sites contained on this website are provided on an "as-is" basis, are intended only to be informative, is not an advice nor a recommendation, nor research, or a record of our trading prices, or an offer of, or solicitation for a transaction in any financial instrument and thus should not be treated as such. The information provided does not involve any specific investment objectives, financial situation and needs of any specific person who may receive it. Please be aware, that past performance is not a reliable indicator of future performance and/or results. Past Performance or Forward-looking scenarios based upon the reasonable beliefs of the third-party provider are not a guarantee of future performance. Actual results may differ materially from those anticipated in forward-looking or past performance statements. IC Markets makes no representation or warranty and assumes no liability as to the accuracy or completeness of the information provided, nor any loss arising from any investment based on a recommendation, forecast or any information supplied by any third-party.
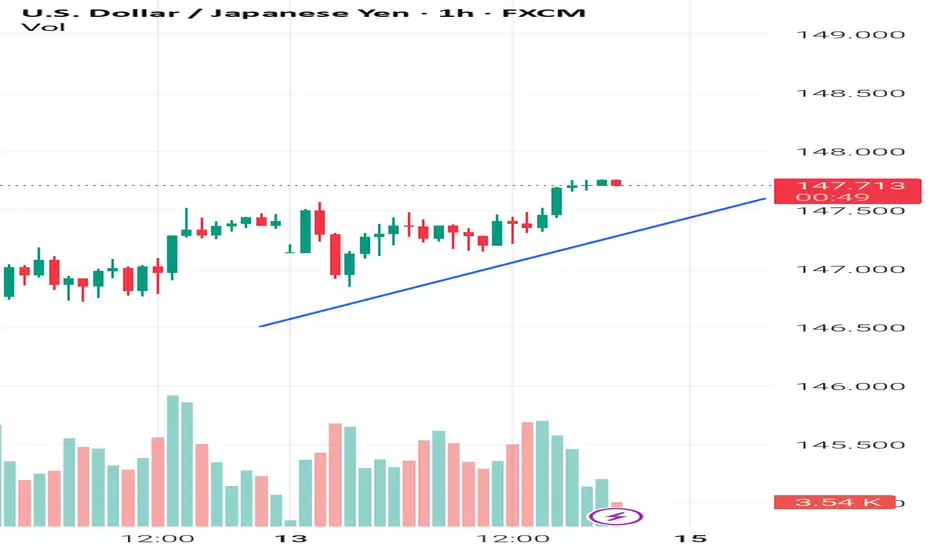
Fundamental analysis: Monday 14 July Despite a little bit of tariff noise, nothing has fundamentally altered my view that 'risk on' trades are viable, particularly short JPY. Although (with the exception of the strong USD, we've seen fairly lackluster movement today). Which I suspect can be put down to the market waiting for Tuesdays US CPI data. I would also attribute today's USD strength to 'positioning' ahead of the release.
Regarding the data, it could be very market moving. We are starting to hit the time when 'tariff caused inflation' could show up in the data.
This is a situation where anyone 'testing' anticipation trades could set USD orders in both directions a few minutes before the event. Meaning, (for example) a 'buy stop' AUD USD in the event of a below forecast number (USD negative).
But also a 'sell stop' AUD USD for the event of a higher than forecast number (USD positive).
Setting the orders (roughly) the distance of the 1hr ATR (look back 100). Ideally with a stop loss behind, or close to, the open of the news candle.
If an order triggers, immediately delete the other order. If no orders trigger after 90 seconds, delete both orders and reassess.
The 'anticipation' strategy is something I've dipped in and out of for a while now. Privately it's been very successful, but the reason I say 'testing' is because I can't endorse it in a live account until each individual has experienced the 'slippage on entry' the strategy occasionally experiences (causing a loss to what looks like a winning trade). As alluded to over the last week or so, I do think 'red flag' US data releases could create 'anticipation trades' moving forward. But, please don't dive in with a live account. Be sure to gather enough 'demo data' to form your own opinion as to if it's a good strategy or not.
Regarding post event, catalyst / standard trades. It's complicated. I envision that long term the market will brush aside a high CPI number. But, in the short term, in the event of a high number, a USD long 'catalyst trade' would be very viable.
My preference would be for a below forecast number, which would create a 'no-brainer risk on trade', probably USD short but I would compare the momentum of USD JPY to determine which is the best 'short option'.
In other news, Canada reports CPI at the same time as the US, I expect the US data to dominate. But the CAD could be used as a tradable currency depending on the outcome of its data.
Sentiment for the GBP remains negative, in particular I suspect GBP AUD will continue it's downward trajectory.
Finally, the CHF continues to be strong in the face of the 'risk on environment'. Which I can only put down to the article I read a while ago suggesting the SNB GOLD HOLDINGS are benefitting the CHF. It makes sense considering the high price of gold at the moment.
It's not a situation i envision will last forever, but, it does mean I would rather short the JPY (or USD) in times of 'risk on'. In times of 'risk off' I'll compare the USD, JPY and CHF against each other. If the CHF is the strongest, I'd feel very confident in a CHF long.
Trading is never easy, but it feels particularly complicated at the moment, please feel free to offer thoughts or questions:
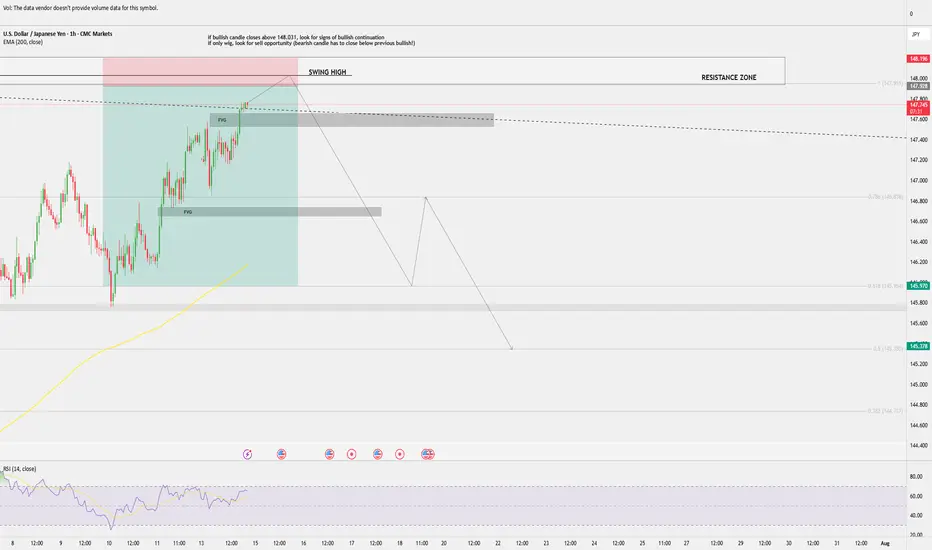
USD/JPY sell opportunity approaching?USD/JPY is approaching previous swing high and resistance zone.
Bullish closure above the swing high (148.031) could indicate further push up.
Failure to close above swing high (bullish candle tapping into it, but only with the wig) and second bearish candle closing below the previous bullish opens sell opportunity.
SELL IDEA
entry: 147.928
SL: 148.196
TP: 145.970 (around 0.618 Fib retracement)
Potential second TP at 145.378 (0.5 Fib retracement).
PLEASE NOTE THIS IS ONLY AN IDEA
I am not a professional trader, but learning to analyse and looking to share ideas and get feedback.
USDJPY is currently at 147.724, offering a potential sell opport
major confirmation support is at 145.00 — this is the key level to watch for trend continuation.
As long as price remains below 148.025, the bias remains bearish in the short term.
If the price falls to the 145.00–146.00 zone and shows reversal signs, it could become a buy zone.
Traders may look to take profit near 146.00 initially, and consider adding to positions on a break of 147.00.
The best buy zone lies between 145.00–146.00, ideally after a confirmed bullish reversal pattern appears.
USDJPY is currently at 147.724, offering a potential sell opportunity based on technical resistance.
The immediate resistance level is at 148.025, which can be used as a stop-loss for the short position.
The pair has shown bearish signals near this resistance, suggesting downside momentum.
Initial support is seen at 147.00 — a break below this could confirm further bearish continuation.
The next support level lies at 146.00, where price may pause or consolidate.

USDJPYThis could become a trade, but it requires the market to return to our setup and provide a good risk-to-reward opportunity. Further downside is possible, but a reversal is not out of the question..

USD/JPY) Bullish trend analysis Read The captionSMC trading point update
Technical analysis of USD/JPY on the 4-hour timeframe, signaling a breakout and possible rally toward the 151.016 target zone. Here's the detailed breakdown:
---
Technical Analysis – USD/JPY (4H)
1. Bullish Structure Breakout
Price has broken above a long-term resistance trendline, indicating a bullish breakout from a rising wedge or ascending channel.
The breakout is confirmed by bullish momentum and sustained price action above the previous highs.
2. Trendline + EMA Confluence
Price remains well above the 200 EMA (145.143), reinforcing the bullish bias.
A clear higher low was formed at the inner trendline (support), followed by strong upside moves.
3. RSI Strength
RSI is around 63.16, indicating strong bullish momentum without being overbought yet.
Suggests more upside potential while maintaining healthy trend conditions.
4. Price Target Projection
The chart shows two upward extensions:
First move projected ~+2.20%, indicating a measured move target around 149.7.
Final target point is 151.016, based on previous price action extension and resistance level.
Mr SMC Trading point
---
Summary
Bias: Bullish
Current Price: 147.366
Key Support: Rising trendline + 145.143 EMA
Targets:
Short-term: ~149.7
Final: 151.016
RSI: Strong but not overbought (63.16)
Invalidation: Break below the inner trendline support and EMA (below 145.00)
Please support boost 🚀 this analysis)

USDJPY SELLGet real time data on the USD/JPY pair including the live rate, as well as our currency converter, analysis, news, historical data and more.

USD/JPY(20250714)Today's AnalysisMarket news:
① Fed's Goolsbee: The latest tariff threat may delay rate cuts. ② The Fed responded to the White House's "accusations": The increase in building renovation costs partly reflects unforeseen construction conditions. ③ "Fed's megaphone": The dispute over building renovations has challenged the Fed's independence again, and it is expected that no rate cuts will be made this month. ④ Hassett: Whether Trump fires Powell or not, the Fed's answer to the headquarters renovation is the key.
Technical analysis:
Today's buying and selling boundaries:
147.02
Support and resistance levels:
148.39
147.88
147.55
146.49
146.15
145.64
Trading strategy:
If the price breaks through 147.55, consider buying, and the first target price is 147.88
If the price breaks through 147.02, consider selling, and the first target price is 146.49

USDJPY - NEW BREAKOUT !Hello Traders !
After a huge bullish move,
The USDJPY broke the resistance level (146.285 - 145.280).
This key level becomes new support!
So, I expect a new bullish move🚀
_______________
TARGET: 147.700🎯
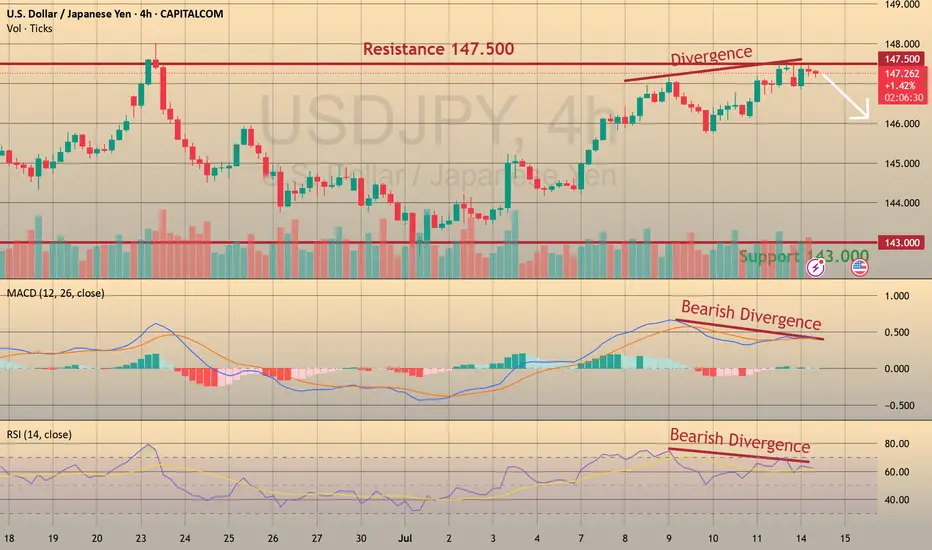
USDJPY: Bearish Divergence – Eyeing Shorts to 143 CAPITALCOM:USDJPY
We’re seeing strong bearish divergence in USDJPY near the 148 resistance zone, shifting our focus to short opportunities with a medium-term target at 142.
📈 Trading Plan:
🔻 SELL Stop: 147.040
❌ Stop Loss: 149.220
✅ Take Profit: 143.000
(Click 👉 Trade Now 👈 on your mobile to copy SL & TP easily)
🔍 Why am I short here?
✅ Technical: Clear bearish divergence on the H4 (RSI & MACD), indicating potential reversal signals.
✅ Resistance Zone: Price is testing the key 148 resistance, providing an ideal risk-reward location for shorts.
✅ Macro Event: Ahead of tomorrow’s US CPI release, a conservative trade structure is maintained to manage volatility risks.
📰 Fundamental Snapshot:
Japan’s economy shows signs of stabilization:
Core machinery orders fell only 0.6% MoM in May to ¥913.5B, much better than April’s -9.1% and forecasts of -1.5%.
Despite the headline decline, it indicates resilience in Japan’s capital spending, supporting the JPY’s medium-term outlook amid global trade and growth risks.
Trade cautiously!

USDJPY BreakdownPro Tip: I believe the is an order block that is being executed every time a session starts, whether it be the London or the New York Session.

Bullish trend in USDJPY PairIn chart it's showing bullish trend and after checking divergence it's bearish divergence, So I am taking my trade in sell stop and booking TP 1 and TP 2.

dollar bullish against all currenciesReversal of pattern
Rsi divergernce
2 bull point
RRR 1:2
breakeven after 1:1
Risk 1, 2%

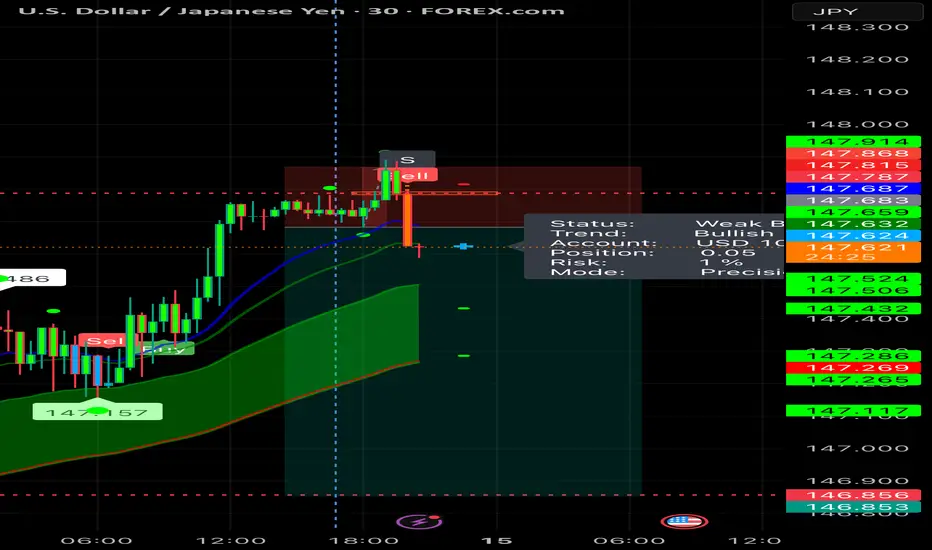
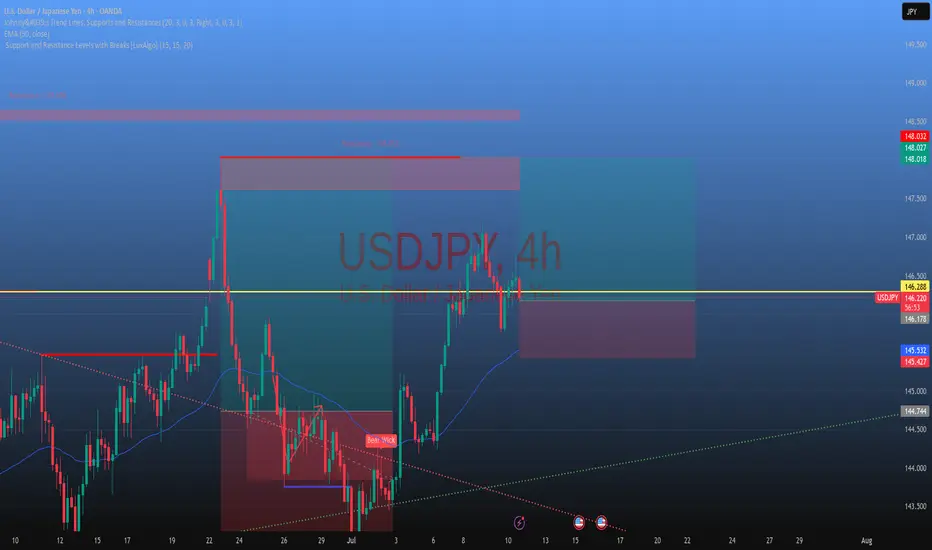
USDJPY| - Bullish Play Within Bearish HTF ContextHTF Overview (4H): Structure is still technically bearish, with buy-side liquidity (BSL) untouched and a major 4H supply OB unmitigated above. Expecting price to seek out that zone before any full reversal.
MTF Refinement (30M): Refined structure shows a potential bullish leg forming to push toward the 4H supply. Price is reaching for nearby sell-side liquidity (SSL), acting as inducement.
Execution Plan: Waiting for a clean sweep of SSL. Once that occurs and the 30M OB is mitigated, I’ll drop to LTF (1M/5M) to confirm bullish intent with CHoCH or BOS before executing a long.
Mindset: Playing the internal bullish wave with precision while respecting higher timeframe narrative. Quick to react if the HTF bias reasserts itself.
Bless Trading!

Heading into pullback resistance?The USD/JPY is rising towards the pivot, which is a pullback resistance and could reverse to the 1st support.
Pivot: 148.44
1st Support: 143.24
1st Resistance: 151.23
Risk Warning:
Trading Forex and CFDs carries a high level of risk to your capital and you should only trade with money you can afford to lose. Trading Forex and CFDs may not be suitable for all investors, so please ensure that you fully understand the risks involved and seek independent advice if necessary.
Disclaimer:
The above opinions given constitute general market commentary, and do not constitute the opinion or advice of IC Markets or any form of personal or investment advice.
Any opinions, news, research, analyses, prices, other information, or links to third-party sites contained on this website are provided on an "as-is" basis, are intended only to be informative, is not an advice nor a recommendation, nor research, or a record of our trading prices, or an offer of, or solicitation for a transaction in any financial instrument and thus should not be treated as such. The information provided does not involve any specific investment objectives, financial situation and needs of any specific person who may receive it. Please be aware, that past performance is not a reliable indicator of future performance and/or results. Past Performance or Forward-looking scenarios based upon the reasonable beliefs of the third-party provider are not a guarantee of future performance. Actual results may differ materially from those anticipated in forward-looking or past performance statements. IC Markets makes no representation or warranty and assumes no liability as to the accuracy or completeness of the information provided, nor any loss arising from any investment based on a recommendation, forecast or any information supplied by any third-party.

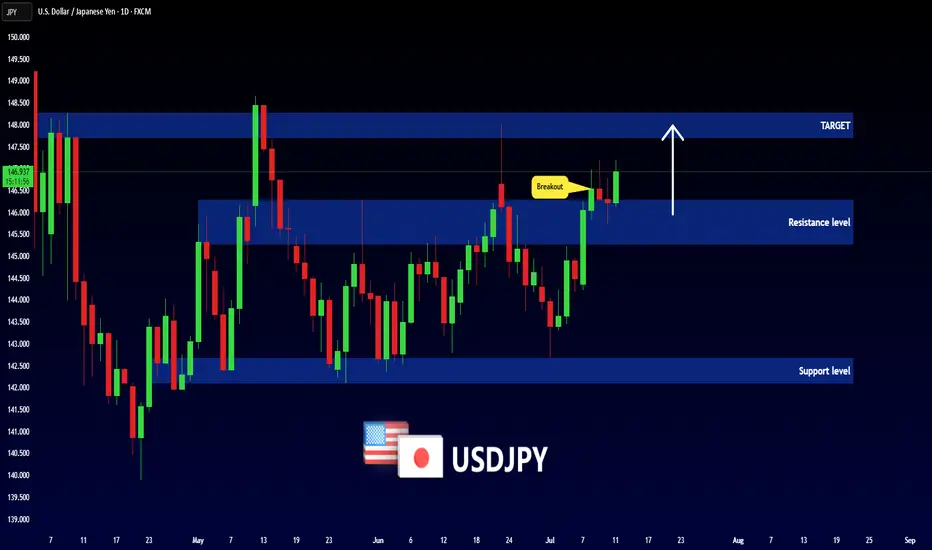
USDJPY: Bullish Continuation After Breakout📈 USDJPY is set to increase further in price after breaking through a significant daily/intraday horizontal resistance.
The next target is 147.81.

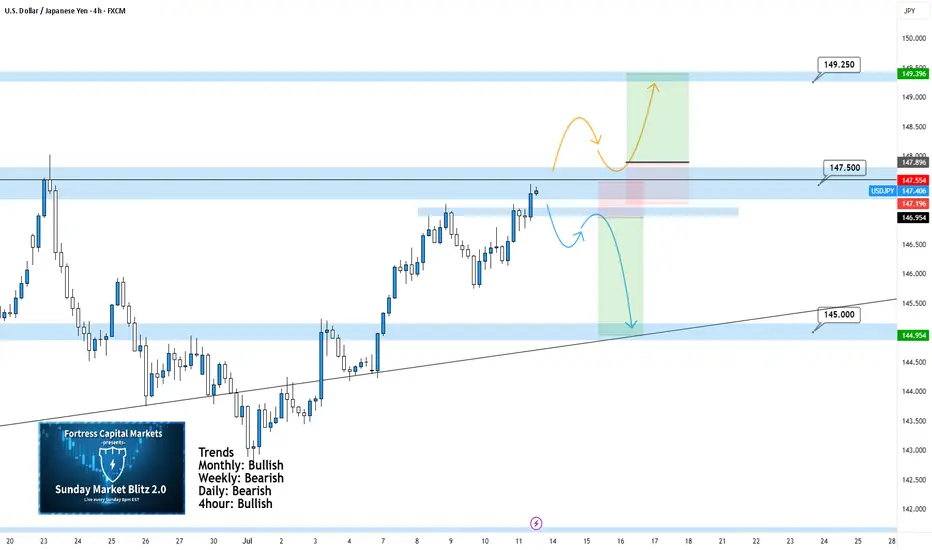
USDJPY 4Hour TF - July 13th, 2025USDJPY 7/13/2025
USDJPY 4Hour Neutral Idea
Monthly - Bullish
Weekly - Bearish
Daily - Bearish
4Hour - Bullish
Finally UJ is looking more clear. We’re now able to drop to the 4Hour instead of the Daily TF due to price action reaching a major zone of anticipated reactions.
As always we’re looking at two trade scenarios going into the week ahead:
Bullish Continuation - UJ is currently sitting at 147.500 resistance and closed there last week. Going into this week we could see the bullish trend continue but we would need to see a clear break of 147.500 resistance to gain confidence. Look for a higher low confirmed above 147.500 followed by strong bullish setups to enter long on. Look to target higher toward major resistance levels like 149.250 area.
Bearish Reversal: Despite the strong bullish momentum we saw from last week, a reversal is still possible as price action is near our 147.250 zone. In order to consider bearish setups we would need to see strong rejection from the current level of resistance. Look to target lower toward 145.000 support.