USD/JPY Breakout, 3-Month HighsUSD/JPY has had several large reactions to U.S. CPI prints over the past couple of years, including the reversal last July that saw more than 2,000 pips taken-out as the spillover of carry unwind hit global equity markets.
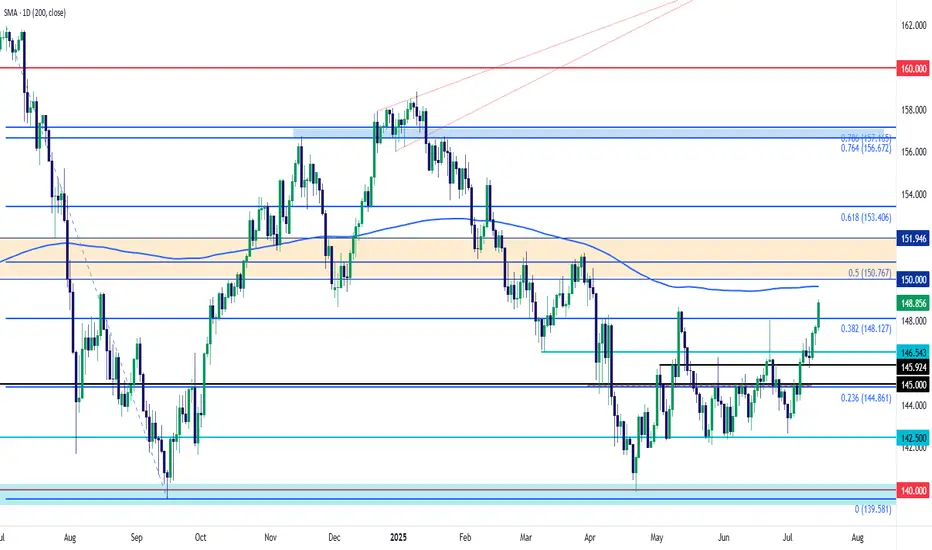
As recession fears hit in the U.S. in the first-half of the year, USD/JPY was in a vulnerable state until finding support at the familiar 140.00 handle in late-April. Since then, however, even as the USD posted fresh multi-year lows, USD/JPY held higher-lows with respect of the 140.00 level from April and then 142.50 in May and June.
And now that U.S. CPI is heading higher, bringing to question the rate cuts markets are still pricing in around the Fed into the end of the year, USD/JPY shorts are being squeezed again, allowing for fresh three-month highs in the pair.
USD/JPY has been difficult to chase this year and there's some resistance sitting overhead, in the form of the 200-day moving average and then the 150.00 psychological level. For support, the 148.13 Fibonacci level is of note for pullback scenarios. - js
USDJPY trade ideas
USD/JPY ticks higher today!USDJPY has been trading strongly bullish in couple of days now and it seems the momentum ain’t slowing down anytime soon! Yes, this is a good time to opt in for a buy once we get any opportunity for that. We’re looking forward to tracking the market for a time price will begin to make a pullback so as to opt in for a buy.

USDJPYGiven the strong net long positioning on the U.S. Dollar (DXY) and the relatively weaker net positioning on the Japanese Yen (JPY) reflected in the latest COT report, we can anticipate a continued bullish outlook for USD/JPY.

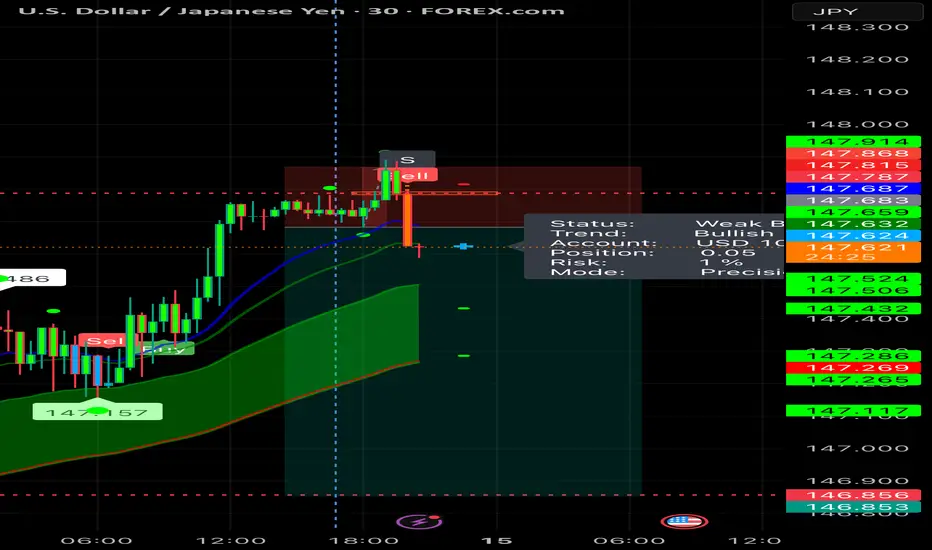
USDJPY 30Min Engaged ( Buy Entry Detected )➕ Objective: Precision Volume Execution
Time Frame: 30-Minute Warfare
Entry Protocol: Only after volume-verified breakout
🩸 Bullish From now Price : 147.900
➗ Hanzo Protocol: Volume-Tiered Entry Authority
➕ Zone Activated: Dynamic market pressure detected.
The level isn’t just price — it’s a memory of where they moved size.
Volume is rising beneath the surface — not noise, but preparation.
🔥 Tactical Note:
We wait for the energy signature — when volume betrays intention.
The trap gets set. The weak follow. We execute.
USDJPY 30Min Engaged ( Buy Entry Detected )

USDJPY - BUY Market has broken resistance level with good bullish momentum candle and we anticipate market to remain bullish.
we plan our TPs with R:R of 1:1 and 1:2 with SL as defined below HL.

USDJPY 30Min Engaged ( Buy & Sell Entrys Detected ) ➕ Objective: Precision Volume Execution
Time Frame: 30-Minute Warfare
Entry Protocol: Only after volume-verified breakout
🩸 Bullish From now Price : 147.350
🩸 Bearish Reversal Price : 147.850
➗ Hanzo Protocol: Volume-Tiered Entry Authority
➕ Zone Activated: Dynamic market pressure detected.
The level isn’t just price — it’s a memory of where they moved size.
Volume is rising beneath the surface — not noise, but preparation.
🔥 Tactical Note:
We wait for the energy signature — when volume betrays intention.
The trap gets set. The weak follow. We execute.

USDJPY Short Setup Near Key Resistance🔻 USDJPY Short Setup Near Key Resistance 🔻
Timeframe: 4H
Symbol: USDJPY
Trade Type: Short (Sell)
📌 Context:
USDJPY is approaching the psychological resistance zone at 148.00–148.50, an area that has historically triggered pullbacks. While the recent momentum is bullish, key technical indicators are flashing overbought conditions.
📉 Technical Confluence:
RSI above 70, suggesting exhaustion
Price nearing upper Bollinger Band
4H structure hints at a possible bearish divergence
Previous resistance around 148.00 held multiple times
💡 Short Idea:
I’m watching for signs of rejection or bearish candle confirmation near the 148.00–148.30 zone. If the price fails to break above, this could be an ideal place to short.
🎯 Potential Targets:
TP1: 147.20 (recent support / 50EMA on 4H)
TP2: 146.50 (mid-June consolidation zone)
⛔️ Stop Loss:
SL above 148.50, just beyond the resistance structure
⚠️ Invalidation:
A clean breakout and 4H close above 148.50 would invalidate this idea.
📝 Note: Always wait for confirmation. This is not financial advice. Use proper risk management.
#USDJPY #forex #shortidea #tradingview #priceaction #JPY #DXY #resistancezone #technicals
Adding USDJPY SHORTS now !please take a look at the 30m chart. I am short at time of writing this post.
As usual, have a higher SL and watch your position sizing. Do not be greedy and stack up unnecessarily.
Please DYODD

USDJPY 1H - market buy with a confirmed structureThe price has bounced from a key support zone and is showing early signs of recovery. A clear base has formed, and the MA50 is starting to turn upward, indicating a shift in short-term momentum. While the MA200 remains above the price, the overall structure suggests a potential continuation of the bullish move.
Trade #1 — entry at market, target: 145.939, stop below recent local low.
Trade #2 — entry after breakout and retest of 145.939, target: 148.000, stop below the retest zone.
Volume has stabilized, and the reaction from support is clear. As long as price holds above the last swing low, buying remains the preferred strategy.

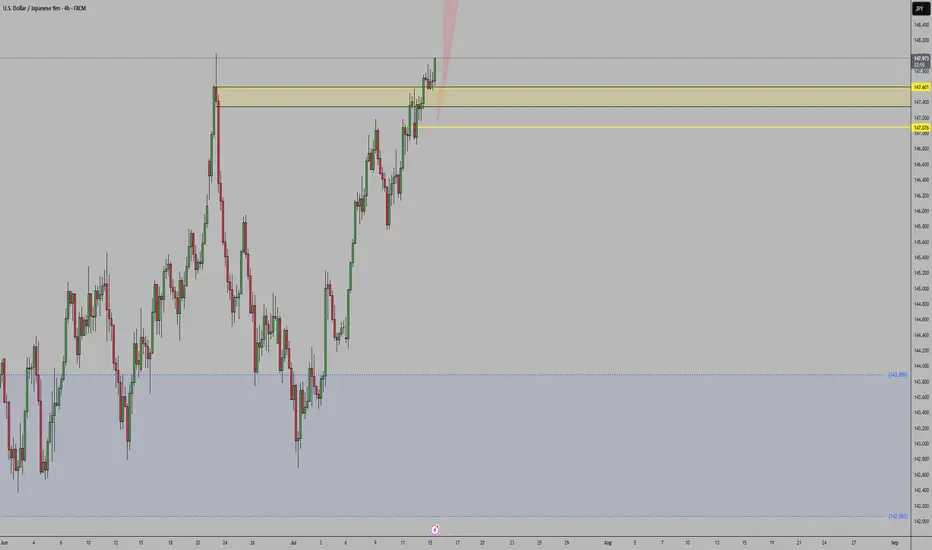
USDJPY Analysis : Bullish Channel Strategy & FMFR Zone Reaction🧩 Market Structure Overview
USDJPY has been in a strong bullish market structure, forming consistent higher highs and higher lows since the beginning of July. The pair recently created a rising ascending channel, where price action has respected both the upper and lower bounds with clean impulsive and corrective moves.
From the 11th to 15th July, USDJPY moved steadily within this bullish channel, forming minor consolidation zones and reacting to short-term supply-demand levels. However, on the 15th, we witnessed a pullback from the upper channel resistance, indicating short-term profit-taking or internal bearish liquidity sweep.
🧠 Current Price Action
Now, price is pulling back and approaching a high-confluence demand zone, marked as:
FMFR (Fair Market Fill Range): A zone where unfilled buy-side orders are likely resting.
SR Flip (Support-Resistance Interchange): A previous resistance zone, now turned into a potential support base.
This area (between 146.80 – 147.00) has multiple confirmations:
Past supply zone → broken and retested
Strong impulsive bullish move originated here
Mid-point of the current bullish channel
Psychological level (147.00 round number)
The market is now offering a potential buying opportunity from this zone, provided a bullish confirmation pattern is printed on lower timeframes (1H or 30M).
🔍 Key Technical Confluences
Bullish Ascending Channel:
Clearly respected — suggesting institutional accumulation. Price is now retesting mid-level or base structure of this channel.
FMFR Zone:
Typically used to spot unbalanced price areas where limit buy orders may rest. Smart money often returns to fill these zones before moving further.
SR Flip:
The prior supply zone from July 8–10 was broken decisively, and price is now using this same level as support.
Liquidity Sweep & Trap:
The current rejection from the channel top may have liquidated early longs. That opens room for a smart-money reversal from the deeper FMFR zone.
📌 Trading Plan (Execution-Based Strategy)
🔽 Entry Criteria:
Wait for a clear bullish reversal candle within the FMFR zone (e.g., bullish engulfing, pin bar, morning star).
Entry can be refined on the 1H or 30M timeframe using a BOS (Break of Structure) signal.
🟢 Buy Zone:
Between 146.80 – 147.00
🔴 Stop Loss:
Below 146.40, well below the FMFR zone and recent wick lows
🎯 Take Profits:
TP1: 148.20 – Retest of the central channel zone
TP2: 149.60 – Next Major Reversal Zone
TP3 (Optional): 150.00 psychological round level (if bullish continuation breaks structure)
⚠️ Risk Management Tips:
Wait for confirmation — don’t rush into the zone without candle proof.
Risk only 1-2% per trade idea.
Adjust lot size according to stop-loss distance.
Avoid chasing if price closes below 146.40 — structure will be invalid.
🔮 What Could Invalidate This Setup?
Clean break below 146.40 support with bearish structure forming (LL, LH)
Bearish fundamentals from USD side (e.g., CPI, FOMC impact)
A tight channel breakdown without bullish volume
📅 Fundamental Backdrop:
USD is currently reacting to macro data and rate expectations.
JPY remains weak structurally, unless BOJ introduces surprise tightening.
US CPI & Fed commentary may influence short-term volatility and liquidity grabs.
🧠 Conclusion:
USDJPY is presenting a high-probability buy setup as it revisits a strong confluence zone formed by FMFR + SR flip. Smart money often re-engages at these levels after liquidity hunts, especially within a bullish structure. Watch for confirmation on lower timeframes, and manage risk responsibly.
This trade idea is based on price action, structure, and institutional concepts, aiming for a trend continuation with clear invalidation levels.


USDJPY - Trade The Range!Hello TradingView Family / Fellow Traders. This is Richard, also known as theSignalyst.
📈USDJPY has been trading within a range between $140 and $150 round numbers and it is currently retesting the upper bound of the range.
📚 As per my trading style:
As #USDJPY is around the red circle zone, I will be looking for bearish reversal setups (like a double top pattern, trendline break , and so on...)
📚 Always follow your trading plan regarding entry, risk management, and trade management.
Good luck!
All Strategies Are Good; If Managed Properly!
~Rich
Disclosure: I am part of Trade Nation's Influencer program and receive a monthly fee for using their TradingView charts in my analysis.

USDJPY LONG & SHORT – DAILY FORECAST Q3 | D15 | W29 | Y25💼 USDJPY LONG & SHORT – DAILY FORECAST
Q3 | D15 | W29 | Y25
📊 MARKET STRUCTURE SNAPSHOT
USDJPY is currently reaching for a key higher time frame supply zone, looking for price action to show weakness at premium levels. Structure and momentum are now aligning for a short opportunity backed by multi-timeframe confluence.
🔍 Confluences to Watch 📝
✅ Daily Order Block (OB)
Looking for Strong reaction and early signs of distribution.
✅ 4H Order Block
Break of internal structure (iBoS) confirms a short-term bearish transition.
✅ 1H Order Block
📈 Risk Management Protocols
🔑 Core principles:
Max 1% risk per trade
Only execute at pre-identified levels
Use alerts, not emotion
Stick to your RR plan — minimum 1:2
🧠 You’re not paid for how many trades you take, you’re paid for how well you manage risk.
🧠 Weekly FRGNT Insight
"Trade what the market gives, not what your ego wants."
Stay mechanical. Stay focused. Let the probabilities work.
🏁 Final Thoughts from FRGNT
📌 The structure is clear.
The confluences are stacked.
Let execution follow discipline, not emotion.

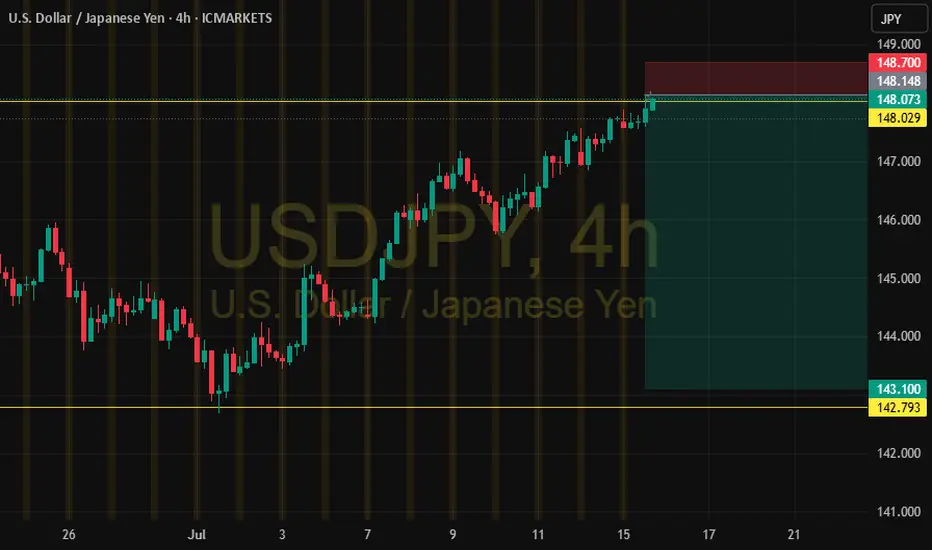
USD/JPY – Major Reversal Zone | Potential Top FormingUSD/JPY has entered a critical supply zone near 148.700 an area that has historically acted as strong resistance. The confluence of trendline rejection, overextended RSI, and multiple moving average rejections suggest a potential short-term top is forming.
🔍 Technical Breakdown:
Macro Pattern: Price is forming a broadening wedge with repeated rejections from the upper resistance trendline (multi-touch).
Supply Zone: The 148.400–148.700 range has acted as a liquidity grab zone historically — current reaction is showing early signs of exhaustion.
Bearish Confluence:
Price stalling below upper wedge resistance.
RSI sitting near overbought territory (68.75) with bearish divergence brewing.
200 SMA overhead and flattening, acting as dynamic resistance.
🎯 Trade Outlook (Short Bias):
Idea Triggered: If price fails to break and close above 148.700 with strong bullish volume, sellers are likely to step in.
Target 1: 144.200 (mid-wedge support)
Target 2: 139.000 (base of structure & ascending trendline)
Invalidation: Daily close above 148.70–149.00 — would indicate potential continuation to new highs.
🔔 Watch For:
Bearish engulfing or rising wedge breakdowns on lower timeframes (4H / 1H).
RSI divergence confirmation.
Volume drying out near resistance.
📌 Wright Way Insight:
This is a high-probability fade setup at a well-defined resistance zone. Unless bulls break structure convincingly, momentum is likely to shift down — favoring strategic short entries.
Let the chart speak. Don’t chase — trade the reversal, trade the Wright Way.

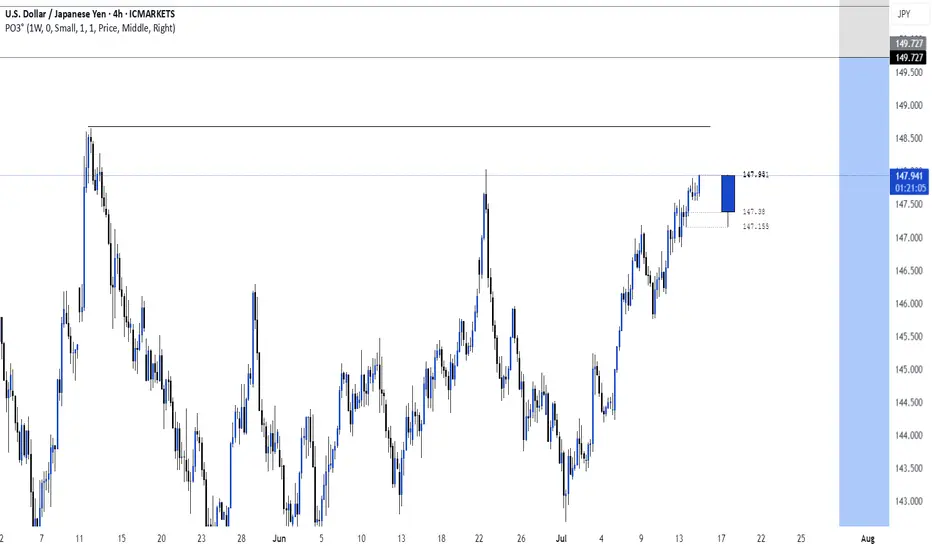
Now or after it breaks down from trend line - USDJPYThe blue dotted line represents the resistance level - 147.944. You can short now with a very tight SL OR wait for the price action to break down from the bullish trend line to establish your position.

USDJPY – Tactical Short in Weekly Supply or Bullish Breakout?COT & MACRO FLOW (Commitment of Traders)
USD INDEX
Non-commercials still biased short: Longs 16,208 vs Shorts 20,194 (slightly improved, but still negative).
Commercials remain net long, but the open interest is declining → no strong conviction from smart money.
JPY
Non-commercials added significantly to their short exposure (+6,751), while cutting longs (-4,432).
Commercials also cut long exposure heavily (-20,405).
The structure shows institutional bias is clearly bearish on JPY.
Conclusion: JPY weakness confirmed by both commercial and non-commercial flows. USD slightly weaker, but JPY is weaker → supports USDJPY bullish bias.
SEASONALITY (JULY)
USD/JPY tends to be weak in July across most historical averages (5y, 10y, 15y, 20y).
July is historically bearish for USDJPY, especially in the second half of the month.
This seasonality contrasts with COT flows → mixed bias.
RETAIL SENTIMENT
60% of retail traders are SHORT → supports contrarian long view.
Retail volume shows imbalance in positioning, another contrarian bullish signal.
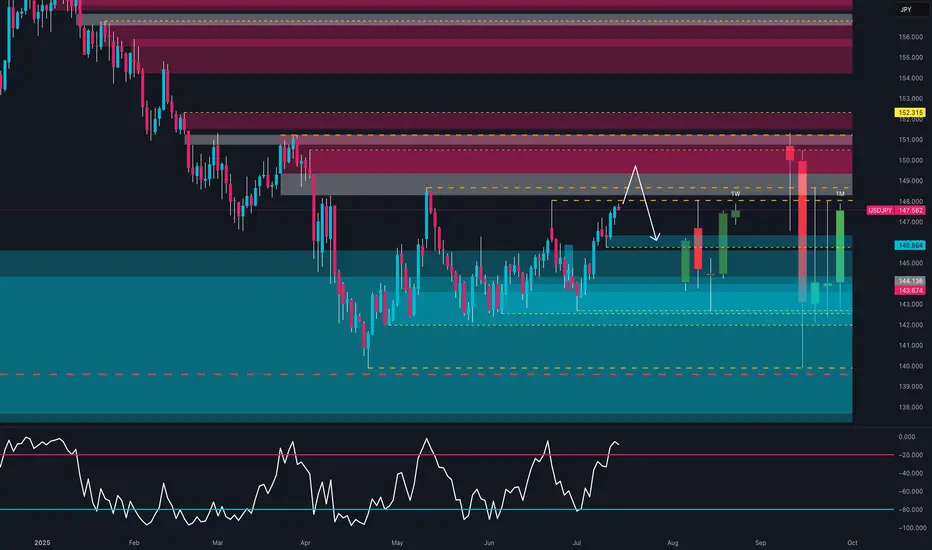
📈 TECHNICAL ANALYSIS (DAILY CHART)
Price is testing a key weekly FVG zone between 148.4 and 149.2.
RSI has re-entered the overbought region, suggesting potential exhaustion.
Price bounced from the monthly bullish order block (143.5–144.0).
A clear move above 149.50 could invalidate short setups.
🧩 TRADE IDEA (SETUP)
Watch for price to retest 148.4–149.50 zone and react.
RSI divergence + seasonality could offer a short opportunity with confirmation (e.g. engulfing on Daily/H4).
If price breaks above 149.5 with volume → look for continuation to 152.00.
✅ FINAL BIAS
Macro and institutional flows remain in favor of USDJPY longs, but:
Seasonality turns bearish in the second half of July
Price is reaching strong resistance
Retail sentiment supports the long thesis
→ Tactical Short from 149-150 only with confirmation. Otherwise, long continuation above 150.
If we dont reverse its most probable we may reach very hi levelss rejected with the pattern. we enter short as we wait for sniper entry at london open.

USD/JPY short: Clash of the TitansHello traders
I entered into a short GBP/JPY position last week after the contraction in GBP Industrial, manufacturing production and GDP. The United Kingdom is also struggling with their own version of the Big Beautiful Bill. The difference is of course that there is no Republican Congress there who is willing to throw their constituents under the bus by cutting Medicaid.
The technical side of USD/JPY is vanilla but the fundamental side is a whole other enchilada.
The sweeping tariffs from Liberation Day MAY become a moot market mover if the Federal Court of Appeals side with the International Trade Court after July 31st. It does not mean that all tariffs will become null and void. My previous IDEA elaborates a little on this.
The Israel/Gaza conflict is still simmering and has just been turned up a notch after an American/Palestinian was beaten to death by West bank settlers. Tragic.
There is no certainty how Iran may still retaliate against the USA after the nuclear site strikes.
The BIG one: President Donald J Trump is finally standing up to Vladimir Putin by announcing the shipment of Patriot missiles to Ukraine. This is a major milestone and turning point for President Trump who was previously under the impression that he can manage Foreign Policy by cozying up to the Russian and North Korean strongmen. Welcome to the real world. Putin, Xi Jinping and Kim Jong Un have been scheming behind your back to support the war against Ukraine.
This is the point where the fictional Dutch boy who used his finger to prevent a leaking dike to prevent a flood might be you, President Trump.
The safety and security of the entire Western World rests on your shoulders at this precise point in time. If Russia conquers Ukraine, it will only be a matter of time before the next European Sovereign country becomes a target. Should this happen, it will also serve as a proxy for the Chinese invasion of Taiwan. And North Korea invading South Korea. Bit of a stretch but not impossible.
Against this background, moving funds into the traditional safe havens of JPY, CHF and Gold make senses and I contend that BTC has joined the list.
Super long dated JPY 40Y bonds have also ticked up in anticipation of upcoming elections and conflicting policies.
The American people definitely do not have the desire or political will to enter into another war BUT it is maybe time for us to become the International Order Sheriff again. Towards this end, I am finally willing to call you my President and Commander in Chief, DJT.
Please be the Titan who does not pick on his own citizens and stand up to the real danger on our planet. Godspeed.

USDJPY Short: Completion of Triple Combination Sub-wave 2Hello everyone! Over in this video, I analyzed the USDJPY and go through how I counted the waves and go through the lower levels sub-wave counts. I believe that USDJPY has completed a triple combination with the Z wave as a 5-wave structure. I talk about how this final wave might not be ideal and propose how the waves might be viewed in a different perspective. However, I believe also that the price is now good enough to short and propose a scaling-in method to short USDJPY.
Eventually, I think that USDJPY will go down to the lower trendline and break it. However, we will have to revisit the chart again when it does to see how the waves unfolded and then decide how to trade it.
Finally, as always, keep your risk tight and Good luck!

USDJPY InsightHello to all subscribers,
Please feel free to share your personal thoughts in the comments. Don’t forget to like and subscribe!
Key Points
- U.S. President Trump raised tariff uncertainty by sending tariff letters to 25 countries, but mentioned that “negotiations remain open with major trading partners like the EU,” reigniting TACO trading sentiment.
- Trump warned that if Russia does not reach a ceasefire agreement with Ukraine within 50 days, the U.S. will impose “secondary tariffs” on Russia and any countries conducting trade with it.
- BOE Governor Andrew Bailey hinted that the Bank of England could cut interest rates more aggressively if needed.
Key Economic Events This Week
+ July 15: U.S. June Consumer Price Index (CPI)
+ July 16: U.K. June CPI, U.S. June Producer Price Index (PPI)
+ July 17: Eurozone June CPI
USDJPY Chart Analysis
The pair showed a mild upward trend near the 142 level and successfully rose to the 148 level. The direction is expected to shift around the 148 resistance. If it fails to break through, a decline back to 142 is likely. However, if it breaks above 148, a further rise toward the 151 level is expected.