Long trade
30sec TF entry
📍 Pair: USDJPY
📅 Date: Thursday, June 26, 2025
🕒 Time: 4:15 AM (London Session AM)
⏱ Time Frame: 15min
📈 Direction: Buyside
📊 Trade Breakdown:
Metric Value
Entry Price 143.803
Profit Level 144.825 (+0.71%)
Stop Loss 143.733 (−0.05%)
Risk-Reward
Ratio 14.6 : 1
🧠 Context / Trade Notes
🔄 15 Minute Structure Support:
The trade was based on a reactive low from the 5-minute TF, aligning with a buy-side imbalance zone formed on the 5-minute chart (Monday, 16th June, 10:00 AM).
📉 RSI in Low Region:
RSI was observed in an oversold condition on LTFs, providing additional confluence for a short-term reversal setup.
30sec TF entry overview
USDJPY trade ideas

Market next target ⚠️ Disruption & Counterpoints:
1. Premature Breakout Bias:
The chart shows price repeatedly rejecting the resistance zone (highlighted in red).
The arrow assumes a clean breakout without confirmation — this is speculative, as the price hasn’t closed convincingly above the resistance.
This could easily turn into a false breakout or double top if price fails again.
2. Volume Mismatch:
A breakout should be backed by strong bullish volume. However, the current volume is mixed and not showing a clear surge in buyer strength.
Lack of volume confirmation makes the breakout less reliable.
3. Ignoring Recent Rejections:
The red zone was tested multiple times in the last sessions without success. That typically signals strong supply or institutional selling.
Repeating this setup without accounting for historical failure adds downside risk.
4. Missing Bearish Scenario:
No alternate path is considered. A failed breakout could lead to a pullback toward 144.00 or lower, especially with U.S. news events (indicated by the flag).
A balanced analysis should always prepare for both breakout and rejection.
5. Macroeconomic Event Risk:
Similar to the GBP/USD chart, this one also shows an upcoming U.S. economic event. That could heavily move USD/JPY, and technical setups may become invalid fast.
The analysis ignores the need to wait for the news catalyst or confirmation after the release.

USDJPY Buy scalp analysis and sell swing analysisThis analysis is based on the daily and 4-hour timeframes and executed using reversal trading, trend formation, and supply and demand trading. Full explanation in the video!

Yen rises sharply, Tokyo Core CPI nextThe Japanese yen has edged higher on Friday. In the North American session, USD/JPY is trading at 144.57, up 0.16% on the day.
Tokyo Core CPI surprised on the downside in June, falling to 3.1% y/y. This was down sharply from the 3.6% gain in May and below the market estimate of 3.3%. This was the the first slowdown in Tokyo core inflation since February. The decline was largely driven by a renewal of fuel subsidies and a reduction in water charges.
Despite the drop, core inflation remains well above the Bank of Japan's 2% target, maintaining expectations for another rate hike in the second half of the year. BoJ Governor Ueda has signaled that the Bank will raise rates if it is confident that wage growth is sustained, which is critical to maintaining inflation at the 2% target. However, this week's BOJ Summary of Opinions showed that some members are more dovish, given global trade tensions and the bumpy US-Japan trade talks. Japan has said it will not agree to US tariffs of 25% on Japanese cars, and six rounds of talks in the past two months have failed to produce a deal.
The Core PCE Price Index, the Fed's preferred inflation indicator, accelerated in May and was higher than expected. The index rose 2.7% y/y up from an upwardly revised 2.6% in May and above the consensus of 2.6%. Monthly, the index rose 0.2%, up from 0.1% which was also the consensus. This was a three-month high and will boost the case for the Fed to leave interest rates unchanged at the July meeting.
USD/JPY faces resistance at 144.49 and 144.64
144.31 and 144.16 are the next support levels

USD/JPY Bearish Gartley Pattern Completion - SELL SETUP
📊 Trade Overview
Pair: USD/JPY
Pattern: Bearish Gartley
Timeframe: 15 minutes
Direction: SHORT
Setup Type: Harmonic Pattern Completion + FVG Confluence
🎯 Market Analysis
The price is evidently bearish according to market structure, currently in a retracement phase, and I expect a bearish continuation at the 61.8 Fibonacci level of the wave.
The harmonic pattern establishes an 88.6 Fibonacci ratio for bearish entry with a balanced and low-risk R/R of 1:1.82 (profit - risk).

Usdjpy D_TF, A symmetric triangle USD/JPY Daily Timeframe Analysis
A symmetrical triangle pattern has formed on the daily chart, indicating that a potential breakout could occur in either direction. If the pattern plays out, we should be looking for a breakout and retest of the trendline towards the downside.

SELL: USDJPY 144.75 Trade Recommendation – 1H Chart🎯 Trade Setup:
Sell Entry Zone: 144.75 – 144.78
Stop Loss (SL): 145.15
Take Profit (TP): 142.60
Risk:Reward Ratio (R:R): Approx. 1:4 → Excellent for swing or intraday setups
📊 Technical Analysis Breakdown:
1. Strong Resistance Zone – High Reversal Probability:
The 144.75–144.78 zone:
A clear historical resistance area with multiple rejections in the past
Converges with the SMA 89 (red line) → acts as a strong dynamic resistance
Price has consistently formed lower highs around this region → showing selling pressure is building
2. Volume Analysis – Distribution Signals:
Volume slightly increased as price approached the resistance but did not accompany a breakout
No “breakout volume” → Indicates possible distribution phase, not accumulation → Favoring SELL positions
3. Price Action & Pattern:
The structure is forming lower highs – a key sign of bearish momentum
After the sharp rejection from the 145.22 zone (June 26), the market has shifted toward a bearish correction cycle
4. Target Area – Key Support:
142.60 is a well-defined support level:
Matches a previous major low
Corresponds with a high-liquidity zone from prior trading sessions
Ideal area to take profit before any potential bounce
⚠️ Risk Management Notes:
Trade confirmation increases if you see bearish candlestick signals (e.g., bearish engulfing, pin bar) in the entry zone
Exit immediately if price breaks and closes above 145.15 with strong volume – that invalidates the bearish setup


USDJPY 15M BUY FRIDAY DELIGHT LOLEvery pips count Scalping 15m
Reason to buy
Strong SUPPORT 144.22
Lets hope we get PAID @ THIS LOVELY SUNNY LONDON :))))

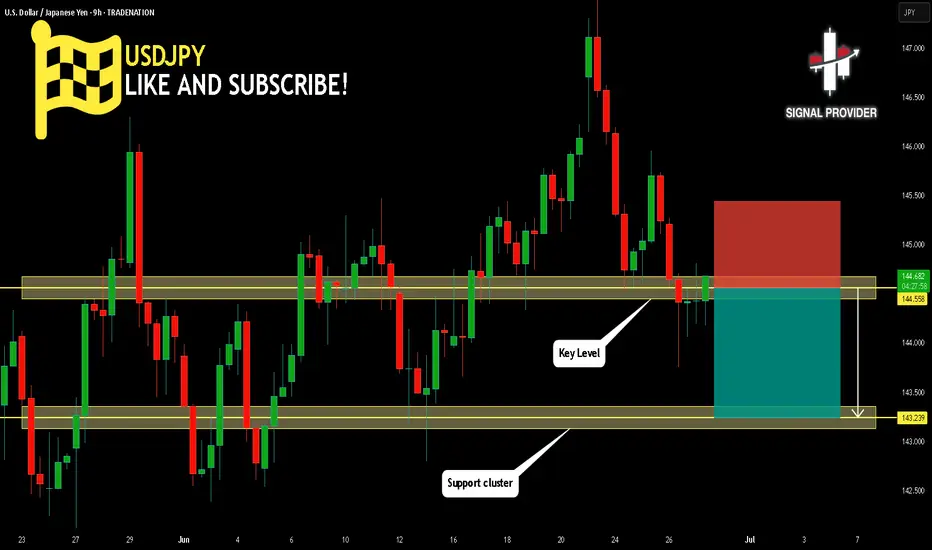
USDJPY Will Go Lower From Resistance! Sell!
Take a look at our analysis for USDJPY.
Time Frame: 9h
Current Trend: Bearish
Sentiment: Overbought (based on 7-period RSI)
Forecast: Bearish
The market is testing a major horizontal structure 144.558.
Taking into consideration the structure & trend analysis, I believe that the market will reach 143.239 level soon.
P.S
Overbought describes a period of time where there has been a significant and consistent upward move in price over a period of time without much pullback.
Disclosure: I am part of Trade Nation's Influencer program and receive a monthly fee for using their TradingView charts in my analysis.
Like and subscribe and comment my ideas if you enjoy them!

USD/JPY BEARS ARE GAINING STRENGTH|SHORT
Hello, Friends!
Bearish trend on USD/JPY, defined by the red colour of the last week candle combined with the fact the pair is overbought based on the BB upper band proximity, makes me expect a bearish rebound from the resistance line above and a retest of the local target below at 143.964.
Disclosure: I am part of Trade Nation's Influencer program and receive a monthly fee for using their TradingView charts in my analysis.
LIKE AND COMMENT MY IDEAS

USD/JPY Bearish Setup: Target 144.309USD/JPY Technical Analysis (30-Min Chart)
Current Price: 145.157
Chart Pattern: The chart shows a bearish structure forming after a sharp drop from the recent high near 147.9. The price is currently consolidating below a resistance zone.
Key Resistance Zone: ~145.70 – 146.00 (highlighted by the orange box)
Support Zone: ~144.30 (target area)
Bearish Outlook:
The price formed a lower high after the drop from the recent peak, indicating selling pressure.
A potential bearish flag or lower high rejection is forming.
The forecasted path suggests a downward move towards 144.309, aligning with the previous support area.
Conclusion:
The setup favors short positions if the price fails to break above the 145.70–146.00 resistance.
Target remains 144.309, with a break below that possibly opening the way to 143.50.
Watch for price action near the blue zone to confirm the downward continuation.

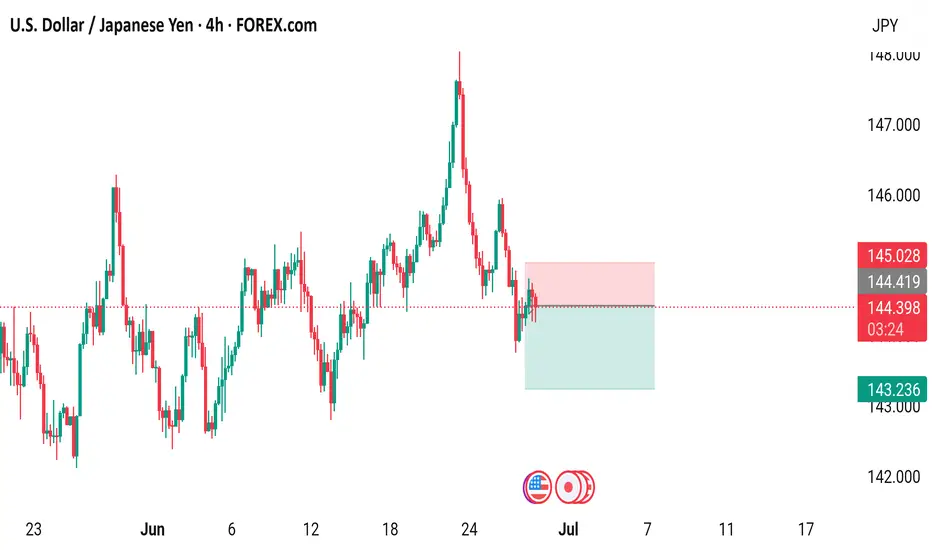
USD/JPY 4-Hour Forex Chart4-hour performance of the U.S. Dollar (USD) against the Japanese Yen (JPY) from FOREX.com, showing a current exchange rate of 144.351 with a slight decrease of 0.063 (-0.04%). The chart highlights a recent sharp upward movement followed by a decline, with key support and resistance levels marked around 144.419 and 145.028, respectively. The time frame spans from late June to early July 2025.
Bearish drop?USD/JPY is reacting off te pivot and could drop t the 1st support.
Pivot: 144.67
1st Support: 143.07
1st Resistance: 145.89
Risk Warning:
Trading Forex and CFDs carries a high level of risk to your capital and you should only trade with money you can afford to lose. Trading Forex and CFDs may not be suitable for all investors, so please ensure that you fully understand the risks involved and seek independent advice if necessary.
Disclaimer:
The above opinions given constitute general market commentary, and do not constitute the opinion or advice of IC Markets or any form of personal or investment advice.
Any opinions, news, research, analyses, prices, other information, or links to third-party sites contained on this website are provided on an "as-is" basis, are intended only to be informative, is not an advice nor a recommendation, nor research, or a record of our trading prices, or an offer of, or solicitation for a transaction in any financial instrument and thus should not be treated as such. The information provided does not involve any specific investment objectives, financial situation and needs of any specific person who may receive it. Please be aware, that past performance is not a reliable indicator of future performance and/or results. Past Performance or Forward-looking scenarios based upon the reasonable beliefs of the third-party provider are not a guarantee of future performance. Actual results may differ materially from those anticipated in forward-looking or past performance statements. IC Markets makes no representation or warranty and assumes no liability as to the accuracy or completeness of the information provided, nor any loss arising from any investment based on a recommendation, forecast or any information supplied by any third-party.

Bullish 15min confirmed chochBullish CHoCH Confirmed on 15min
Structure has shifted — price just broke the previous lower high, confirming a bullish change of character. Watching for a clean retest or continuation setup. Momentum building. 📈🔥

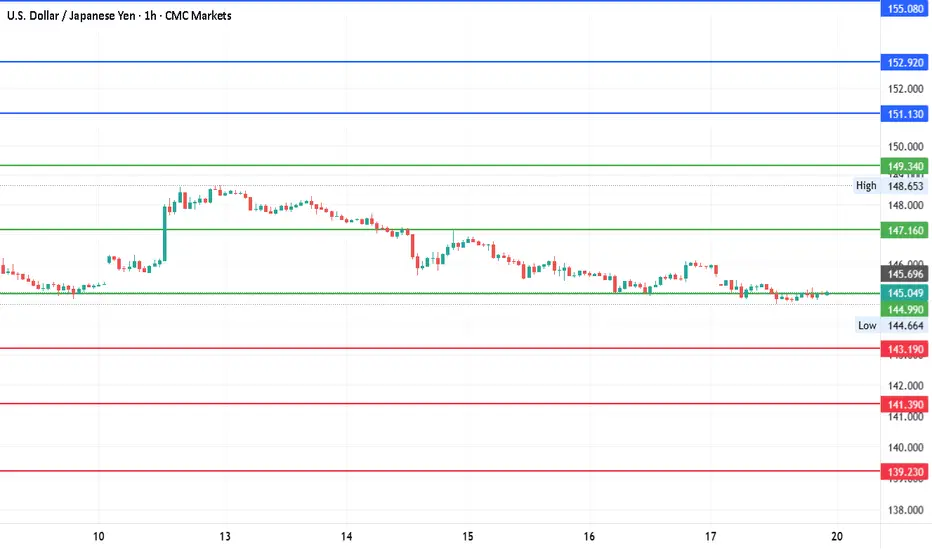
#USDJPY - 8 Points? |157.24 or 137.07?Date: 19-05-2025
#USDJPY Current Price: 145.03
Mid-Point: 147.16
Upside Targets: 151.13, 152.92, 155.08 and 157.24
Downside Targets: 143.19, 141.39, 139.23 and 137.07
Support: 144.99
Resistance: 149.34
#USDJPY
Can PCE data rescue the dollar? JPY, EUR, GBP setup in playThe latest U.S. PCE report is set for release at 8:30am EDT, with both headline and core inflation expected at 0.1% month-on-month.
As the Fed’s preferred inflation measure, today’s figures could influence interest rate expectations. A stronger print may reduce the case for a July rate cut, while a softer result could add pressure on the U.S. dollar.
The dollar has already weakened this week amid speculation over central bank independence (trump is reportedly considering nominating Fed chair Jerome Powell’s successor earlier than normal in order to undermine the current chair).
Pairs to watch include, EUR/USD, GBP/USD, USD/JPY with symmetrical triangle formations suggesting breakout potential in either direction for all once the data hits.

Is USDJPY in a Downtrend?USDJPY is supported by the trendline and the price is facing the resistance zone of 144.500. If the candle cannot close above this resistance zone, the sellers can push the price to break the trendline and head towards the support zone of 142.700. This support zone plays an important role in shaping the trend if broken the downtrend can be extended and no support zone can be strong enough to push the price of the pair until 140.300.
There is still a high possibility of a reaction so the BUY strategy at the support zone of 142.700 is still ready
On the other hand, if the candle closes above the resistance zone of 144.500, the uptrend is still maintained and heading towards this week's peak around 147.500. Pay attention to the price reaction at 146.000.

UJ correlating with the dollar?We see price creating LL's and LH's heading to the downside. Structure retested at a LH with a perfect bearish engulfing printing right after the retest of support which turned resistance! Counter trend line was broken. I was also looking at multiple brokers & it looks like the 4hr bearish engulfing only printed on a select few brokers . . Although we did align on a 15 min which is lower time frame. Trade management is key, we shall see what happens next!

USDJPY is ready to go down to 143.834USDJPY is ready to follow my strategy and is already going down to 143.834

The trend is more important than the exact high to shortCatching the precise high to short is a tough game. I prefer to leave this to the expert. In the day chart, we have a nice bearish candle and here in the 1H chart, you can see my short position is more than halfway from the exact fall (coz I really can't predict the market movement).
So, I have two targets for those keen to short, the 2nd one upon breaking down from the bullish trend line.
Again, I stressed the volatility of this pair so if you cannot stomach it, it is better to go for my EURUSD pair. See next chart.

USDJPY Analysis (prediction)Hi everyone sorry I am sick so just have to bear with me. Please note this is not financial advice and for my own educational purposes. happy trading evertone
