USD/JPY) bearish Trand analysis Read The captionSMC trading point update
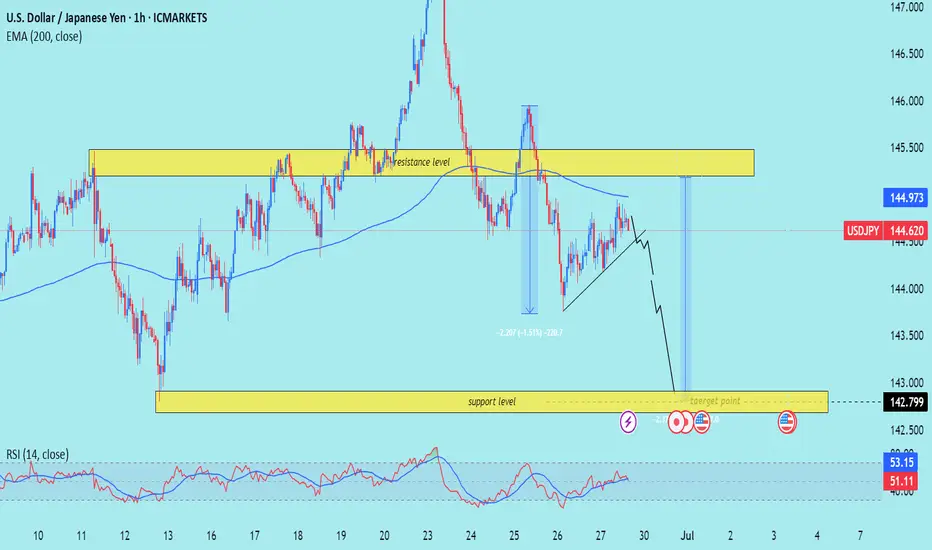
Technical analysis of USD/JPY (U.S. Dollar vs Japanese Yen) on the 1-hour timeframe. Here's a clear breakdown of the idea presented:
---
Overview of the Setup
Current Price: 144.620
EMA 200 (Blue Line): 144.973 – price is trading below the EMA, indicating bearish momentum.
Resistance Zone: Around 145.000 – 145.500
Support/Target Zone: Around 142.799
RSI Indicator: ~51.11 – neutral zone (not overbought or oversold)
---
Interpretation of Chart Structure
1. Resistance Level:
Price tested the resistance zone and sharply rejected it.
This zone has held multiple times historically, making it strong.
2. EMA 200 as Resistance:
Price rejected just under the EMA, further confirming downside pressure.
3. Bearish Flag / Rising Wedge Breakdown:
There is a visible bearish continuation pattern (likely a rising wedge or bear flag).
Price is projected to break down from this pattern, continuing the downtrend.
4. Measured Move Projection:
Previous drop of ~230 pips (-1.5%) is mirrored for the next expected move.
The same size move projects the price to reach the target zone around 142.799.
5. Support/Target Zone:
Marked as the final take-profit zone.
Corresponds with historical demand and likely buyer interest.
---
Trade Idea Summary
Bias: Bearish
Entry Idea: After breakdown confirmation below wedge structure or rejection from resistance zone.
Target: 142.799
Stop-Loss Consideration: Above the resistance zone (~145.500) or just above the recent swing high.
Confirmation: Breakdown of rising wedge + below EMA + repeated resistance rejections.
Mr SMC Trading point
---
Key Considerations
Upcoming News Events (Three Icons):
These symbols signal potential USD or JPY volatility, so watch out for data releases that could disrupt the pattern.
RSI Neutral:
RSI is not yet oversold, allowing room for more downside before hitting exhaustion levels.
False Breakouts Possible:
Price may fake a break upward before continuing lower – wait for strong candle confirmation if entering a trade.
plesse support boost 🚀 this analysis)
USDJPY trade ideas
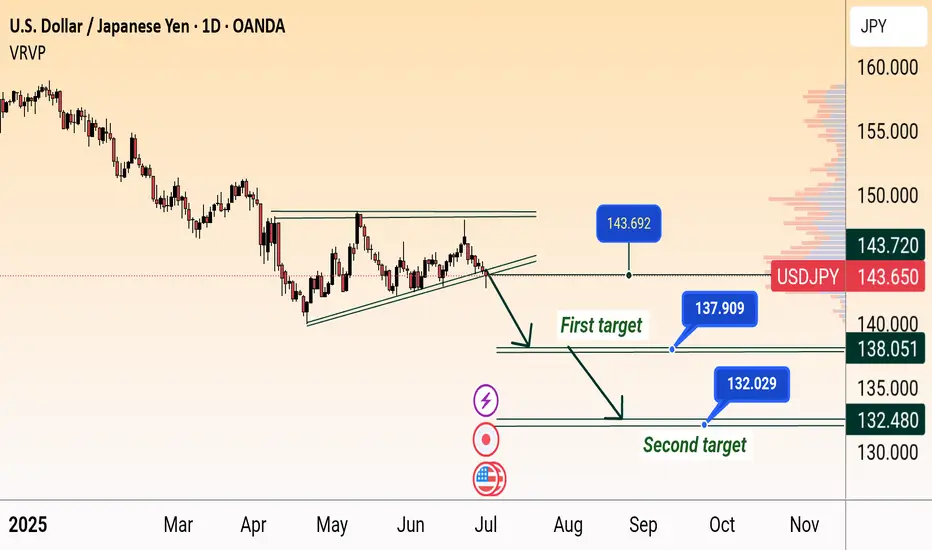
USD/JPY Bearish Breakdown Targets 138 & 132USD/JPY Bearish Breakdown Setup (Daily Chart)
USD/JPY breaks below rising wedge support near 144, signaling potential downside. Price targets are marked at 138.051 (first target) and 132.480 (second target), indicating possible continued weakness if the bearish momentum holds.
Wednesday 2 July: USD to recover short term? The general market mood remains positive, and particularly sentiment for the USD remains in the douldrums. All of a sudden, there is talk of three FED cuts by the end of the year (although I think that's a bit ambitious). A soft NFP report could cement multi year USD weakness.
But pre (Thursday's) NFP I suspect we could see some dollar profit taking.
Currently, I see 'risk on' short JPY (or CHF) as very viable, the risk to a trade would be USD liquidity if the dollar continues to weaken.
Recommended trade: AUD JPY long

USDJPY: Strong Bullish Price Action 🇺🇸🇯🇵
I see 2 strong bullish confirmation on USDJPY after a test of a key daily
support cluster.
The price violated a trend line of a falling channel and a neckline of
an inverted head & shoulders pattern with one single strong bullish candle.
The pair may rise more and reach 144.45 level soon.
❤️Please, support my work with like, thank you!❤️
I am part of Trade Nation's Influencer program and receive a monthly fee for using their TradingView charts in my analysis.

USDJPY: Pullback From SupportI believe that 📈USDJPY could bounce up from the highlighted intraday support.
I see 2 bullish breakout confirmations:
bullish breakouts of a neckline of a cup and handle pattern and a resistance line of a falling wedge pattern.
Goal - 144.67

UJ, will we see a bearish leg today?USDJPY looks quite interesting after the wick rejection from key level 144.000. Will this area be respected and give us a bearish leg. Hmm, let's see how price unfolds for this pair today.
Regards,
Aman | SMC Wolf FX
1-1 student onboarding is currently open (website in my signature & profile)
DeGRAM | USDJPY correction 📊 Technical Analysis
● Monday's rebound above the 4-month falling trend line was quickly repelled, leaving a “false breakdown” candle; price has returned under the line and is now retesting it as resistance around 144.65.
● The rebound also stopped at the top of the triangle and a small bearish flag formed; the height of the pattern points to the 142.80 support band and the broader channel to 139.90 as continuation.
💡 Fundamental analysis
● Softer U.S. core GDP data drove 2-year Treasury yields to two-week lows, reducing the rate differential that favored the dollar.
Meanwhile, Japanese officials again warned that they “do not rule out any measures” against excessive yen weakening, raising the risk of intervention and discouraging new long USD/JPY positions.
Summary
Short 144.4 - 144.65; break below 143.8 targets 142.8 -> 139.9. Bearish view loses strength with a 4-hour close above 145.30.
-------------------
Share your opinion in the comments and support the idea with like. Thanks for your support!

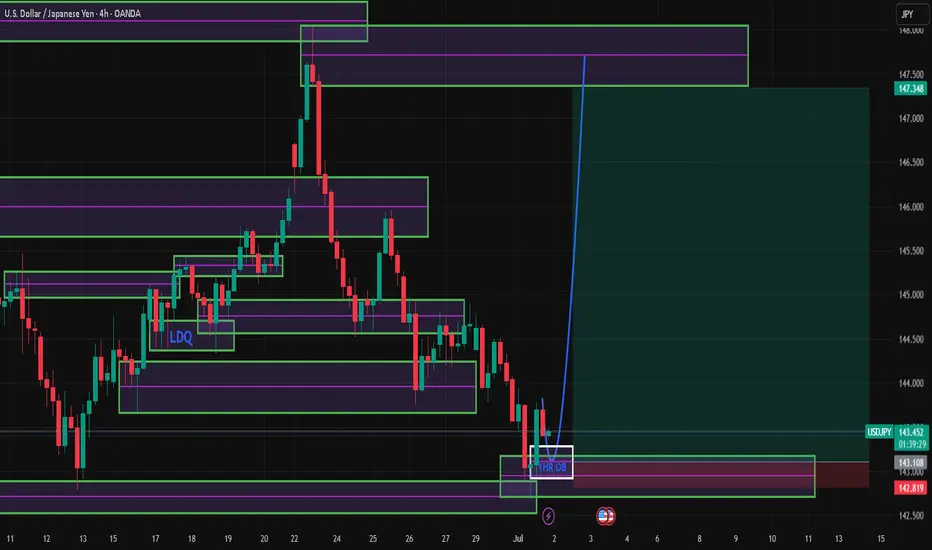
Buy limit order at $143.400 after a retest confirms supportAnalyzing the USD/JPY across multiple timeframes, we observe a consistent pattern of price recovery after a significant drop, indicating a potential phase of accumulation by institutional players. The daily chart shows a recent decline followed by a stabilization and slight upward movement, suggesting a possible change of character (CHoCH) from bearish to bullish momentum. The 4-hour and 1-hour charts confirm this with a series of higher lows and higher highs, indicative of a shift towards bullish sentiment.
The 15-minute, 5-minute, and 1-minute charts display more granular price action, with recent bullish candles suggesting an ongoing push for higher prices. This could be a response to retail selling pressure being absorbed by institutional buying, a common scenario during early stages of a bullish reversal.
INSTITUTIONAL THESIS:
Institutions appear to be in the early stages of an accumulation phase, targeting liquidity above recent highs to trigger stop losses and fuel further upward movement. The presence of unmitigated order blocks (OB) on the 1-hour chart around 143.400 provides a potential area for re-entry, suggesting that price may revisit this zone to balance before continuing upwards.
LEARNING POINT:
"1H Order Block mitigation after liquidity sweep" - This scenario highlights how institutions often retest key levels where significant orders were previously placed, confirming their commitment to driving the price in the intended direction.
SIGNAL: BUY
SYMBOL: USDJPY
ENTRY PRICE: $143.400
STOP LOSS: $143.200
TARGET PRICE: $144.000
CONDITION: Buy limit order at $143.400 after a retest confirms support.
RATIONALE: The setup aligns with a bullish CHoCH on multiple timeframes, presence of a 1H OB, and the anticipation of a liquidity sweep above recent highs.
STRATEGIES USED: 1H OB Mitigation, Liquidity Sweep Above Recent Highs
URGENCY: MEDIUM
TIMEFRAME: Short-term
CONFIDENCE SCORE: 85%
RISK/REWARD RATIO: Risk=$0.20, Reward=$0.60, Ratio=1:3.0
CRITICAL RULES:
The analysis strictly adheres to Smart Money Concepts, avoiding traditional retail indicators.
The decision is based on visible price action and institutional logic, ensuring a high probability of success.
The risk/reward ratio exceeds the minimum requirement of 2:1, enhancing the trade's viability.

Potential bullish continuation?USD/JPY has bounced off the pivot and could rise to the 1st resistance, which aligns with the 78.6% Fibonacci retracement.
Pivot: 143.37
1st Support: 142.78
1st Resistance: 144.50
Risk Warning:
Trading Forex and CFDs carries a high level of risk to your capital and you should only trade with money you can afford to lose. Trading Forex and CFDs may not be suitable for all investors, so please ensure that you fully understand the risks involved and seek independent advice if necessary.
Disclaimer:
The above opinions given constitute general market commentary, and do not constitute the opinion or advice of IC Markets or any form of personal or investment advice.
Any opinions, news, research, analyses, prices, other information, or links to third-party sites contained on this website are provided on an "as-is" basis, are intended only to be informative, is not an advice nor a recommendation, nor research, or a record of our trading prices, or an offer of, or solicitation for a transaction in any financial instrument and thus should not be treated as such. The information provided does not involve any specific investment objectives, financial situation and needs of any specific person who may receive it. Please be aware, that past performance is not a reliable indicator of future performance and/or results. Past Performance or Forward-looking scenarios based upon the reasonable beliefs of the third-party provider are not a guarantee of future performance. Actual results may differ materially from those anticipated in forward-looking or past performance statements. IC Markets makes no representation or warranty and assumes no liability as to the accuracy or completeness of the information provided, nor any loss arising from any investment based on a recommendation, forecast or any information supplied by any third-party.

USDJPY H1 I Bearish ReversalBased on the H1 chart, the price is rising toward our sell entry level at 144.15, a pullback resistance that aligns with the 78.6% Fib retracement.
Our take profit is set at 143.48, an overlap support.
The stop loss is set at 144.67, an overlap resistance.
High Risk Investment Warning
Trading Forex/CFDs on margin carries a high level of risk and may not be suitable for all investors. Leverage can work against you.
Stratos Markets Limited (tradu.com ):
CFDs are complex instruments and come with a high risk of losing money rapidly due to leverage. 63% of retail investor accounts lose money when trading CFDs with this provider. You should consider whether you understand how CFDs work and whether you can afford to take the high risk of losing your money.
Stratos Europe Ltd (tradu.com ):
CFDs are complex instruments and come with a high risk of losing money rapidly due to leverage. 63% of retail investor accounts lose money when trading CFDs with this provider. You should consider whether you understand how CFDs work and whether you can afford to take the high risk of losing your money.
Stratos Global LLC (tradu.com ):
Losses can exceed deposits.
Please be advised that the information presented on TradingView is provided to Tradu (‘Company’, ‘we’) by a third-party provider (‘TFA Global Pte Ltd’). Please be reminded that you are solely responsible for the trading decisions on your account. There is a very high degree of risk involved in trading. Any information and/or content is intended entirely for research, educational and informational purposes only and does not constitute investment or consultation advice or investment strategy. The information is not tailored to the investment needs of any specific person and therefore does not involve a consideration of any of the investment objectives, financial situation or needs of any viewer that may receive it. Kindly also note that past performance is not a reliable indicator of future results. Actual results may differ materially from those anticipated in forward-looking or past performance statements. We assume no liability as to the accuracy or completeness of any of the information and/or content provided herein and the Company cannot be held responsible for any omission, mistake nor for any loss or damage including without limitation to any loss of profit which may arise from reliance on any information supplied by TFA Global Pte Ltd.
The speaker(s) is neither an employee, agent nor representative of Tradu and is therefore acting independently. The opinions given are their own, constitute general market commentary, and do not constitute the opinion or advice of Tradu or any form of personal or investment advice. Tradu neither endorses nor guarantees offerings of third-party speakers, nor is Tradu responsible for the content, veracity or opinions of third-party speakers, presenters or participants.

Waiting to sell USDJPYWait for price to retest the trendline/resisitence zone then watch for an engulfing bearish candle on 15min or 30 minute chart
USDJPY Analysis – Bullish Continuation After Minor PullbackUSDJPY is currently trading around 143.340, and I anticipate a minor pullback into the 143.296 zone, which aligns with a possible bullish order block and discount zone on the H1/H4 timeframe.
This short-term dip could serve as a liquidity sweep or mitigation before price resumes its bullish trend, targeting the 147.381 level — a key area of interest tied to previous highs and potential liquidity above.
I’ll be watching for bullish confirmation (e.g., clean W-pattern, bullish engulfing candle, or break of internal structure) from the 143.296 zone before taking long entries.
🔻 Short-term expectation: Pullback to 143.296
🔼 Primary bias: Bullish continuation
🎯 Upside target: 147.381
📍 Current price: 143.340
📌 Risk Management Reminder: This is not financial advice. Always apply proper risk management:
✔️ Use a minimum of 1:2 RR setups
✔️ Risk no more than 1–2% of your capital per trade
✔️ Wait for clear confirmation before entering
✔️ Protect your account — preservation over prediction
what will be the next move for usdjpy price has been going down for the bast few days , so we will see the price going up for the next day

USDJPY| - Weekky OutlookBias: Bullish
HTF Overview (4H):
Price has shown bullish intent by breaching a major internal high and taking out significant sell-side liquidity (SSL) before mitigating the 4H order block below. This suggests a bullish narrative is forming, even though the 4H swing high hasn’t been taken yet.
LTF Confirmation (30M):
Currently showing bearish momentum. I’ll wait for a clean CHoCH to confirm shift in intent. Once price sweeps liquidity and mitigates a valid 30M OB, I’ll look for entries.
Entry Zone:
After liquidity sweep + OB mitigation on 30M (or refinement on 5M), I’ll execute the setup.
Targets:
• Scalp: 5M structure highs
• Short-Term Hold: 30M structure highs
• Extended Hold: 4H structure highs (if price action is strong)
Mindset Note:
Structure tells the story, but price action confirms whether it’s worth riding. Even when structure looks awkward, respect is often still given—so stay fluid, but focused.
Bless Trading!

Bullish bounce off pullback support?USD/JPY has bounced off the support level which is a pullback support and could potentially rise from this level to our take profit.
Entry: 142.63
Why we like it:
There is a pullback support.
Stop loss: 141.91
Why we like it:
There is a pullback support.
Take profit: 144.68
Why we like it:
There is an overlap resistance that lines up with the 38.2% Fibonacci retracement.
Enjoying your TradingView experience? Review us!
Please be advised that the information presented on TradingView is provided to Vantage (‘Vantage Global Limited’, ‘we’) by a third-party provider (‘Everest Fortune Group’). Please be reminded that you are solely responsible for the trading decisions on your account. There is a very high degree of risk involved in trading. Any information and/or content is intended entirely for research, educational and informational purposes only and does not constitute investment or consultation advice or investment strategy. The information is not tailored to the investment needs of any specific person and therefore does not involve a consideration of any of the investment objectives, financial situation or needs of any viewer that may receive it. Kindly also note that past performance is not a reliable indicator of future results. Actual results may differ materially from those anticipated in forward-looking or past performance statements. We assume no liability as to the accuracy or completeness of any of the information and/or content provided herein and the Company cannot be held responsible for any omission, mistake nor for any loss or damage including without limitation to any loss of profit which may arise from reliance on any information supplied by Everest Fortune Group.

USD/JPY weekly Analysis for June 30th - July 4th sell order
Weekly target 141.55
it is a possible chance to see 140.78 this week as well
stay cool calm collect and don't over leverage.

usdjpy will fallguys this isnt promising but i guess with proper risk management and flexible stop loss you can take this trade tbh


Usdjpy 4Hr chart Analaysis The USD/JPY pair appears to be forming a potential reversal pattern, suggesting a shift from bullish to bearish momentum. The key level of 148.55 is anticipated to act as a turning point, with price potentially heading down toward the 141.647 support area in the near term.

USDJPY FXAN & Heikin Ashi exampleIn this video, I’ll be sharing my analysis of USDJPY, using FXAN's proprietary algo indicators with my unique Heikin Ashi strategy. I’ll walk you through the reasoning behind my trade setup and highlight key areas where I’m anticipating potential opportunities.
I’m always happy to receive any feedback.
Like, share and comment! ❤️
Thank you for watching my videos! 🙏

USD/JPY (4H timeframe) shows a clear break 0ut.USD/JPY (4H timeframe) shows a clear break below the ascending trendline and Ichimoku cloud support, suggesting a bearish continuation.
Key Bearish Targets (Based on the chart):
1. First Target Zone:
📉 140.88
This level aligns with previous structure support and is marked as the initial target on the chart.
2. Second Target Zone:
📉 138.85 – 139.00
This is a deeper support zone and is indicated as the next bearish leg if price momentum continues downward.
Summary:
Current Price: ~142.74
Trend: Bearish (Breakdown from trendline + Ichimoku bearish signals)
Target 1: 140.88
Target 2: 138.85
Let me know if you want SL (stop-loss) or entry suggestions.

Quantitative Trading Models in Forex: A Deep DiveQuantitative Trading Models in Forex: A Deep Dive
Quantitative trading in forex harnesses advanced algorithms and statistical models to decode market dynamics, offering traders a sophisticated approach to currency trading. This article delves into the various quantitative trading models, their implementation, and their challenges, providing insights for traders looking to navigate the forex market with a data-driven approach.
Understanding Quantitative Trading in Forex
Quantitative trading, also known as quant trading, in the forex market involves using sophisticated quantitative trading systems that leverage complex mathematical and statistical methods to analyse market data and execute trades. These systems are designed to identify patterns, trends, and potential opportunities in currency movements that might be invisible to the naked eye.
At the heart of these systems are quantitative trading strategies and models, which are algorithmic procedures developed to determine market behaviour and make informed decisions. These strategies incorporate a variety of approaches, from historical data analysis to predictive modelling, which should ensure a comprehensive assessment of market dynamics. Notably, in quantitative trading, Python and similar data-oriented programming languages are often used to build models.
In essence, quantitative systems help decipher the intricate relationships between different currency pairs, economic indicators, and global events, potentially enabling traders to execute trades with higher precision and efficiency.
Key Types of Quantitative Models
Quantitative trading, spanning diverse markets such as forex, stocks, and cryptocurrencies*, utilises complex quantitative trading algorithms to make informed decisions. While it's prominently applied in quantitative stock trading, its principles and models are particularly significant in the forex market. These models are underpinned by quantitative analysis, derivative modelling, and trading strategies, which involve mathematical analysis of market movements and risk assessment to potentially optimise trading outcomes.
Trend Following Models
Trend-following systems are designed to identify and capitalise on market trends. Using historical price data, they may determine the direction and strength of market movements, helping traders to align themselves with the prevailing upward or downward trend. Indicators like the Average Directional Index or Parabolic SAR can assist in developing trend-following models.
Mean Reversion Models
Operating on the principle that prices eventually move back towards their mean or average, mean reversion systems look for overextended price movements in the forex market. Traders use mean reversion strategies to determine when a currency pair is likely to revert to its historical average.
High-Frequency Trading (HFT) Models
Involving the execution of a large number of orders at breakneck speeds, HFT models are used to capitalise on tiny price movements. They’re less about determining market direction and more about exploiting market inefficiencies at micro-level time frames.
Sentiment Analysis Models
These models analyse market sentiment data, such as news headlines, social media buzz, and economic reports, to gauge the market's mood. This information can be pivotal in defining short-term movements in the forex market, though this model is becoming increasingly popular for quantitative trading in crypto*.
Machine Learning Models
These systems continuously learn and adapt to new market data by incorporating AI and machine learning, identifying complex patterns and relationships that might elude traditional models. They are particularly adept at processing large volumes of data and making predictive analyses.
Hypothesis-Based Models
These models test specific hypotheses about market behaviour. For example, a theory might posit that certain economic indicators lead to predictable responses in currency markets. They’re then backtested and refined based on historical data to validate or refute the hypotheses.
Each model offers a unique lens through which forex traders can analyse the market, offering diverse approaches to tackle the complexities of currency trading.
Quantitative vs Algorithmic Trading
While quant and algorithmic trading are often used interchangeably and do overlap, there are notable differences between the two approaches.
Algorithmic Trading
Focus: Emphasises automating processes, often using technical indicators for decision-making.
Methodology: Relies on predefined rules based on historical data, often without the depth of quantitative analysis.
Execution: Prioritises automated execution of trades, often at high speed.
Application: Used widely for efficiency in executing repetitive, rule-based tasks.
Quantitative Trading
Focus: Utilises advanced mathematical and statistical models to determine market movements.
Methodology: Involves complex computations and data analysis and often incorporates economic theories.
Execution: May or may not automate trade execution; focuses on strategy formulation.
Application: Common in risk management and strategic trade planning.
Implementation and Challenges
Implementing quantitative models in forex begins with the development of a robust strategy involving the selection of appropriate models and algorithms. This phase includes rigorous backtesting against historical data to validate their effectiveness. Following this, traders often engage in forward testing in live market conditions to evaluate real-world performance.
Challenges in this realm are multifaceted. Key among them is the quality and relevance of the data used. Models can be rendered ineffective if based on inaccurate or outdated data. Overfitting remains a significant concern, where systems too closely tailored to historical data may fail to adapt to evolving market dynamics. Another challenge is the constant need to monitor and update models to keep pace with market changes, requiring a blend of technical expertise and market acumen.
The Bottom Line
In this deep dive into quantitative trading in forex, we've uncovered the potency of diverse models, each tailored to navigate the complex currency markets with precision. These strategies, rooted in data-driven analysis, may offer traders an edge in decision-making.
*Important: At FXOpen UK, Cryptocurrency trading via CFDs is only available to our Professional clients. They are not available for trading by Retail clients. To find out more information about how this may affect you, please get in touch with our team.
This article represents the opinion of the Companies operating under the FXOpen brand only. It is not to be construed as an offer, solicitation, or recommendation with respect to products and services provided by the Companies operating under the FXOpen brand, nor is it to be considered financial advice.

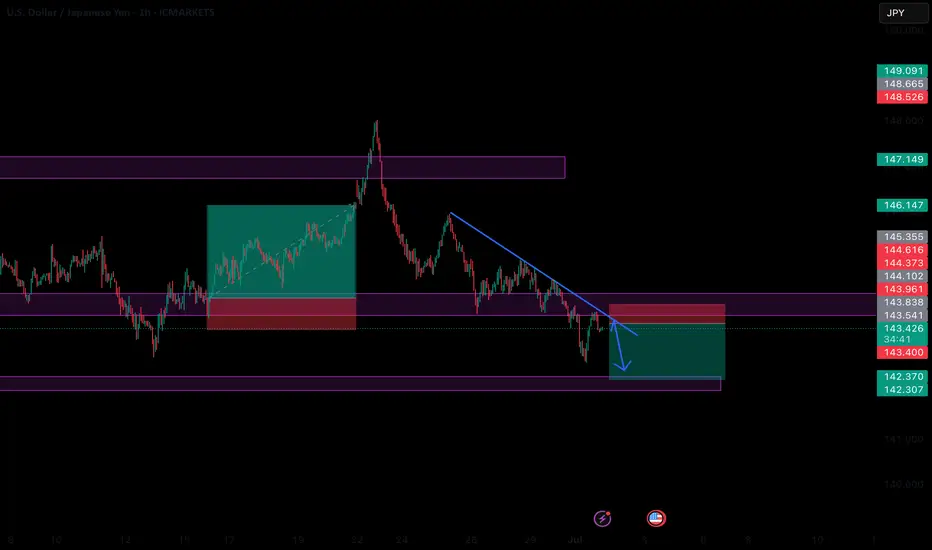
Critical Channel Watch Begins on the 1-Hour Chart of USDJPY.Hey everyone,
📉 My Latest USDJPY Analysis:
USDJPY is currently moving within a downtrend. If the price breaks below the lower boundary of the parallel channel, our first target level will be 142.910. The most crucial factor here is the downward breakout of that channel—don’t overlook it.
Also, keep a close eye on key economic data releases on the fundamental side, as they could significantly influence your strategy.
I meticulously prepare these analyses for you, and I sincerely appreciate your support through likes. Every like from you is my biggest motivation to continue sharing my analyses.
I’m truly grateful for each of you—love to all my followers💙💙💙
