USDJPY: Bearish Trend Remains in ControlUSDJPY continues to follow a clear downtrend on the H4 chart, respecting a descending trendline and forming consistent lower highs. The strong rejection at 144.800 and the presence of multiple FVGs further reinforce the bearish structure.
Price is currently retracing to test the FVG zone. If rejection occurs here, the downtrend could resume towards the 141.900 support level.
Trade Setup:
Sell near 144.700
TP: 141.900
SL: above 145.300
Supporting News:
"Risk-on" sentiment is back after strong manufacturing data from China and rising expectations that U.S. interest rates may soon peak, weakening the USD against the JPY.
Are you watching for a short setup like I am?
USDJPY trade ideas

USDJPY - placed reasonable high? What's next??#USDJPY.. market placed 144.20-25 day high in yesterday and that is a very reasonable high.
If market hold it in that case we can expect drop from here.
Don't be lazy here.
Good luck
Trade wisely
USDJPY is showing an historical patternThe USDJPY is forming a head and shoulders pattern and has a very clear support line at 140.
If the price goes below this line, we could see a big drop in the pair, with the first easy target at 130 and a second, more difficult target at 120. The risk is very low, and also, currency pairs allow you to use leverage to earn much higher profits.

USDJPY 15M BULLS START TO SHOW THERE MUSCLES :))))As we can see we have been rejected @ a VERY STRONG SUPPORT AREA, and small time frame give us good BULLISH FORMATION (Creating LL/HL with DIVERGANCE)
Im looking to hold at list 1 lot, as i believe this could be a bottom for a START OF MASSIVE BULL RUN (ONLY TIME WILL TELL)
As usual will update everything here
Thanks

Bullish bouncer off pullback support?USD/JPY is falling towards the pivot and could bounce to the 1st resistance which acts as a pullback resistance.
Pivot: 143.37
1st Support: 142.71
1st Resistance: 144.50
Risk Warning:
Trading Forex and CFDs carries a high level of risk to your capital and you should only trade with money you can afford to lose. Trading Forex and CFDs may not be suitable for all investors, so please ensure that you fully understand the risks involved and seek independent advice if necessary.
Disclaimer:
The above opinions given constitute general market commentary, and do not constitute the opinion or advice of IC Markets or any form of personal or investment advice.
Any opinions, news, research, analyses, prices, other information, or links to third-party sites contained on this website are provided on an "as-is" basis, are intended only to be informative, is not an advice nor a recommendation, nor research, or a record of our trading prices, or an offer of, or solicitation for a transaction in any financial instrument and thus should not be treated as such. The information provided does not involve any specific investment objectives, financial situation and needs of any specific person who may receive it. Please be aware, that past performance is not a reliable indicator of future performance and/or results. Past Performance or Forward-looking scenarios based upon the reasonable beliefs of the third-party provider are not a guarantee of future performance. Actual results may differ materially from those anticipated in forward-looking or past performance statements. IC Markets makes no representation or warranty and assumes no liability as to the accuracy or completeness of the information provided, nor any loss arising from any investment based on a recommendation, forecast or any information supplied by any third-party.

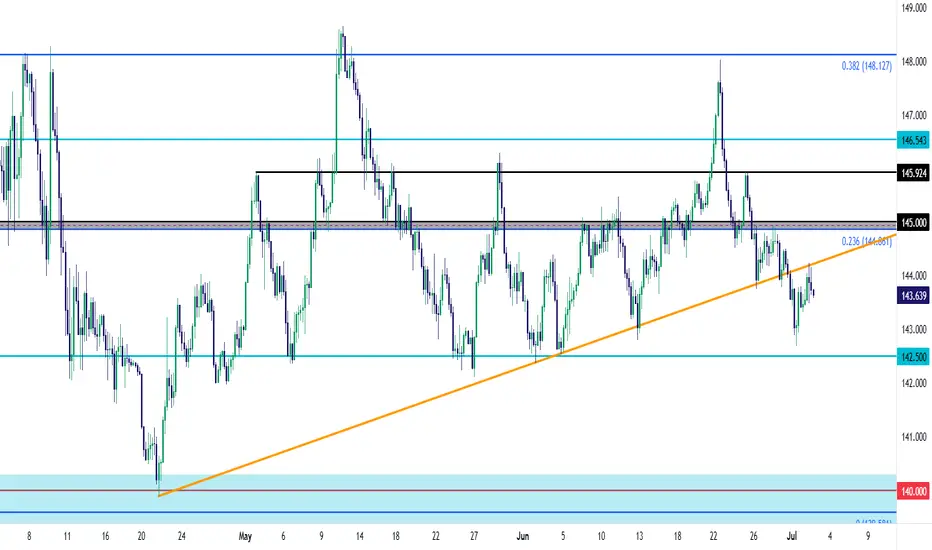
USD/JPY Trendline Now as ResistanceDespite the massive move of weakness in USD in Q2, USD/JPY has held up relatively well, especially over the past two months.
The 140.00 level held the lows in April and then it was the 142.50 level. The bullish trendline connecting those two points had some additional higher-low context.
But as looked at last week, the 145.00 zone was now set up as possible lower-high resistance and that last bounce from the trendline found sellers there, leading to a breach earlier this week.
Now that trendline is showing up as resistance potential. Notably bears were unable to stretch down for re-test of 142.50, and if we do end up with a larger short squeeze in the USD, the pair could become interesting on the long side again. For that, the 145.00 level remains key and buyers will first need to take that out to exhibit some element of control on a shorter-term basis. - js
Potential bearish drop?USD/JPY is reacting off the resistance level which is an overlap resistance and could drop from this level too ur take profit.
Entry: 143.79
Why we like it:
There is a pullback resistance level.
Stop loss: 144.52
Why we like it:
There is a pullback resistance that is slightly below the 61.8% Fibonacci retracement.
Take profit: 142.79
Why we like it:
There is a pullback support level.
Enjoying your TradingView experience? Review us!
Please be advised that the information presented on TradingView is provided to Vantage (‘Vantage Global Limited’, ‘we’) by a third-party provider (‘Everest Fortune Group’). Please be reminded that you are solely responsible for the trading decisions on your account. There is a very high degree of risk involved in trading. Any information and/or content is intended entirely for research, educational and informational purposes only and does not constitute investment or consultation advice or investment strategy. The information is not tailored to the investment needs of any specific person and therefore does not involve a consideration of any of the investment objectives, financial situation or needs of any viewer that may receive it. Kindly also note that past performance is not a reliable indicator of future results. Actual results may differ materially from those anticipated in forward-looking or past performance statements. We assume no liability as to the accuracy or completeness of any of the information and/or content provided herein and the Company cannot be held responsible for any omission, mistake nor for any loss or damage including without limitation to any loss of profit which may arise from reliance on any information supplied by Everest Fortune Group.

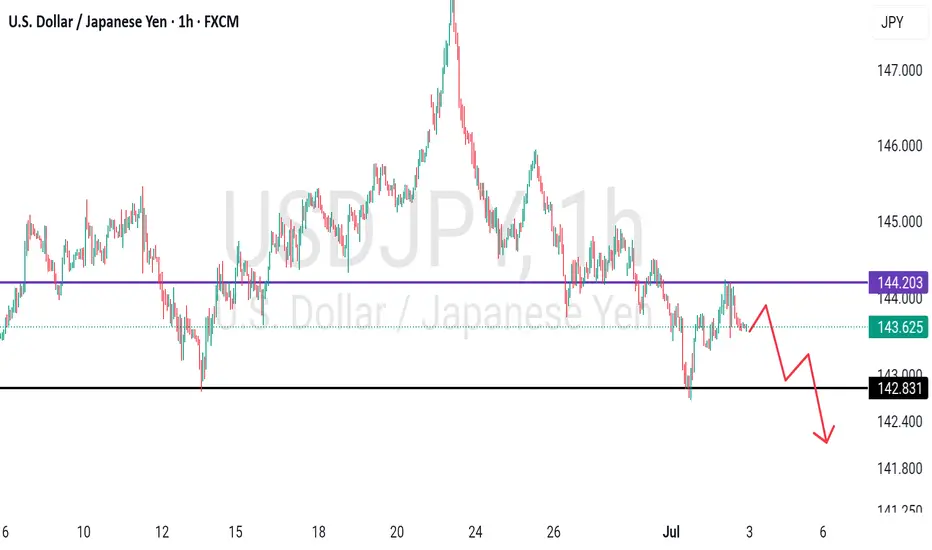
USDJPY Potential DownsidesHey Traders, in today's trading session we are monitoring USDJPY for a selling opportunity around 144.200 zone, USDJPY is trading in a downtrend and currently is in a correction phase in which it is approaching the trend at 144.200 support and resistance area.
Trade safe, Joe.
Strong bearish candles indicate seller dominance. No bullish structure has formed; instead, it looks like a **continuation of the bearish trend**.

4H ORDER BLOCK UNMITIGATED STRATEGY📉 USDJPY – Short Bias Below Supply Zone (4H Mitigated OB Bearish)
Timeframe: 30m
Bias: Bearish
Type: Intraday / Swing Setup
📌 Key Observations:
Price recently tapped into a 4H Mitigated Order Block (OB) around 144.360 – 144.049 and showed rejection with strong bearish wicks.
This zone aligns with a previous supply area and is marked by confluence from the McGinley Dynamic 50 & 200 EMA.
A short was executed at 144.162, with a stop above the OB at 144.476.
Target is set at 142.500, near previous demand structure and liquidity sweep.
🧠 Trade Rationale:
The 4H bearish OB was mitigated during the Tokyo session with low momentum, followed by a London and NY session rejection.
The pair formed a lower high and is now trading below key moving averages, indicating a possible continuation to the downside.
Multiple sessions show rejection from the same OB area – reinforcing its strength.
Increased volume on the down candle confirms institutional presence.
🎯 Trade Details:
Entry: 144.162
Stop Loss: 144.476
Take Profit: 142.500
RRR: 5.9:1
Position Size: 228,000
Current PnL: +606.12 USD (Floating)
🔍 Next Steps:
Monitor for any signs of bullish order blocks forming around 143.200 or 142.900 as partial TP zones.
Move SL to breakeven once price breaks 143.400.

Trump threatens tariff on Japan as deadline looms, yen dipsThe Japanese yen is negative ground on Thursday. In the North American session, USD/JPY is trading at 144.06, up 0.47%.
The US and Japan are racing to reach a trade deal before a deadline of July 9. There are some serious roadblocks to a deal, including the current US tariff of 25% on Japanese cars and opening Japan's agricultural sector, particularly rice. President Trump has insisted that Japan import American-grown rice, but the Japanese government says that is unacceptable.
Japan's Economy Minister Ryosei Akawaza said earlier this week that Japan would not "sacrifice the agricultural sector", while Farm Minister Shinjiro Koizumi said that foreign rice imports would threaten Japan's food security.
It's a shortened week in the US due to the Fourth of July holiday on Friday. The US will release the June employment report on Thursday, with all eyes on nonfarm payrolls.
Nonfarm payrolls eased slightly in May to 137 thousand from 147 thousand and the downward trend is expected to continue, with a consensus of 110 thousand for June. This would mark the weakest pace of job growth since 2020, with the exception of a meltdown in job growth in Oct. 2024.
The Federal Reserve will also be monitoring the nonfarm payroll report. The US labor market has been weakening and the Fed is concerned that the jobs market could show a sharp deterioration. Currently, the most likely date for the next Fed rare cut is September, but a soft NFP reading south of 90 thousand would boost the case for a cut at the July 30 meeting.
The Fed has maintained a wait-and-see stance since Nov. 2024 but that is expected to change in the fourth quarter, where we could see up three rate cuts.

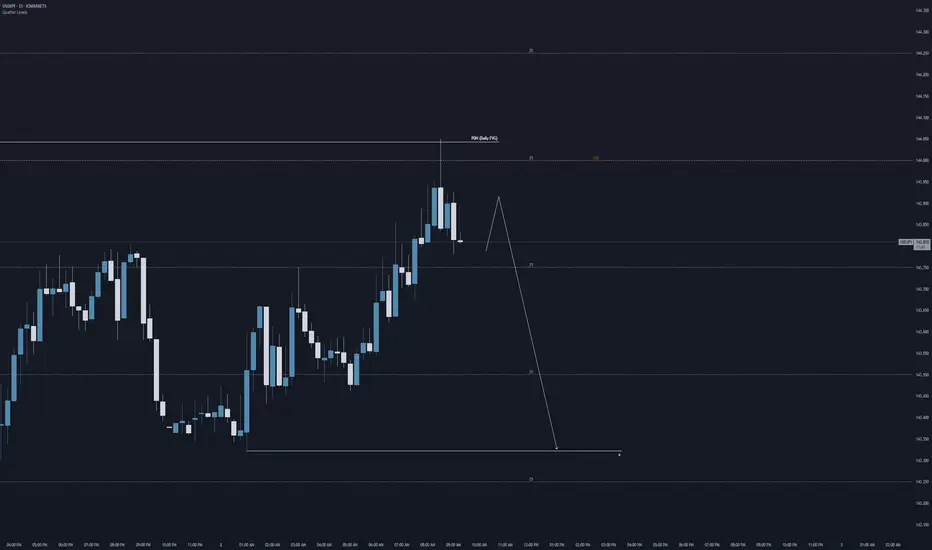
USDJPY SELLBy utilizing levels, historical patterns, , we can formulate a hypothesis that the market might follow a similar trajectory if bearish sentiment prevails.
USD/JPY) Back support level Read The captionSMC trading point update
Technical analysis of USD/JPY pair using a combination of price action, resistance/support levels, and indicators. Here's a breakdown of the idea behind the analysis:
---
Chart Breakdown (2H - USD/JPY)
1. Key Zones:
Resistance Level (Yellow Box at Top):
Price has previously been rejected from this zone multiple times.
Recent bearish wicks and aggressive sell-offs are marked by red arrows—showing strong seller interest.
Support Level / Target Point (Bottom Yellow Box):
Price has found strong buying interest around 142.142.
This zone is the anticipated downside target if the bearish scenario plays out.
2. Bearish Bias Justification:
Liquidity Grab / Fakeout (labeled “fug”):
The price briefly broke above the smaller resistance block but quickly reversed.
This "fake breakout" often traps buyers, strengthening the bearish case.
EMA 200 (Blue Line):
Price is currently near or slightly under the 200 EMA (144.553), suggesting a potential rejection area aligning with resistance.
RSI Indicator:
RSI shows divergence and has not confirmed a bullish breakout.
The values (56.77 and 42.82) indicate loss of bullish momentum.
3. Projection (Black Lines):
The black zig-zag lines represent a forecasted drop to the support level.
Suggests a short setup near 144.50–145.00 with targets near 142.14.
Mr SMC Trading point
---
Summary:
Bias: Bearish
Entry Zone: Near resistance area (144.50–145.00)
Target: 142.142 (support zone)
Invalidation: Strong break above 145.00 and hold
Confirmation: Rejection from resistance with bearish candle pattern
---
Please support boost 🚀 this analysis)

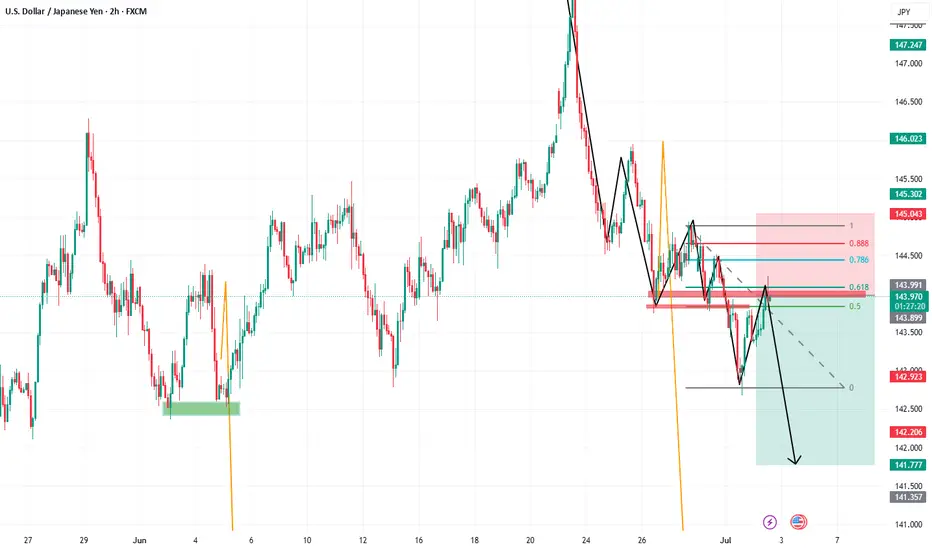
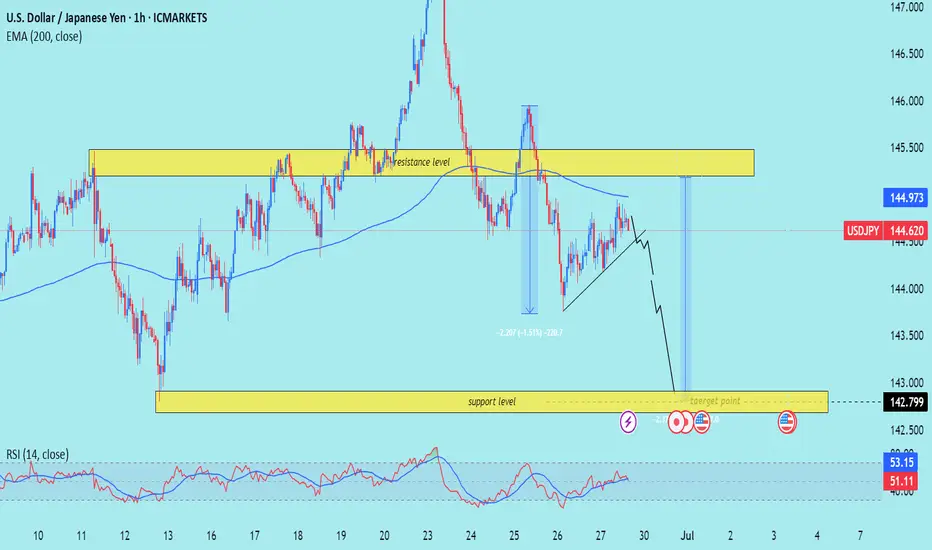
USD/JPY) bearish Trand analysis Read The captionSMC trading point update
Technical analysis of USD/JPY (U.S. Dollar vs Japanese Yen) on the 1-hour timeframe. Here's a clear breakdown of the idea presented:
---
Overview of the Setup
Current Price: 144.620
EMA 200 (Blue Line): 144.973 – price is trading below the EMA, indicating bearish momentum.
Resistance Zone: Around 145.000 – 145.500
Support/Target Zone: Around 142.799
RSI Indicator: ~51.11 – neutral zone (not overbought or oversold)
---
Interpretation of Chart Structure
1. Resistance Level:
Price tested the resistance zone and sharply rejected it.
This zone has held multiple times historically, making it strong.
2. EMA 200 as Resistance:
Price rejected just under the EMA, further confirming downside pressure.
3. Bearish Flag / Rising Wedge Breakdown:
There is a visible bearish continuation pattern (likely a rising wedge or bear flag).
Price is projected to break down from this pattern, continuing the downtrend.
4. Measured Move Projection:
Previous drop of ~230 pips (-1.5%) is mirrored for the next expected move.
The same size move projects the price to reach the target zone around 142.799.
5. Support/Target Zone:
Marked as the final take-profit zone.
Corresponds with historical demand and likely buyer interest.
---
Trade Idea Summary
Bias: Bearish
Entry Idea: After breakdown confirmation below wedge structure or rejection from resistance zone.
Target: 142.799
Stop-Loss Consideration: Above the resistance zone (~145.500) or just above the recent swing high.
Confirmation: Breakdown of rising wedge + below EMA + repeated resistance rejections.
Mr SMC Trading point
---
Key Considerations
Upcoming News Events (Three Icons):
These symbols signal potential USD or JPY volatility, so watch out for data releases that could disrupt the pattern.
RSI Neutral:
RSI is not yet oversold, allowing room for more downside before hitting exhaustion levels.
False Breakouts Possible:
Price may fake a break upward before continuing lower – wait for strong candle confirmation if entering a trade.
plesse support boost 🚀 this analysis)
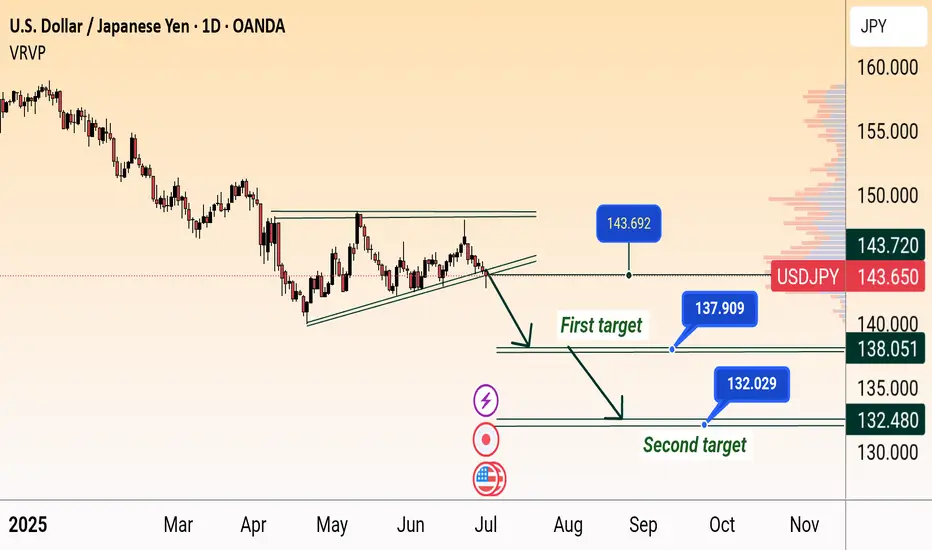
USD/JPY Bearish Breakdown Targets 138 & 132USD/JPY Bearish Breakdown Setup (Daily Chart)
USD/JPY breaks below rising wedge support near 144, signaling potential downside. Price targets are marked at 138.051 (first target) and 132.480 (second target), indicating possible continued weakness if the bearish momentum holds.
Wednesday 2 July: USD to recover short term? The general market mood remains positive, and particularly sentiment for the USD remains in the douldrums. All of a sudden, there is talk of three FED cuts by the end of the year (although I think that's a bit ambitious). A soft NFP report could cement multi year USD weakness.
But pre (Thursday's) NFP I suspect we could see some dollar profit taking.
Currently, I see 'risk on' short JPY (or CHF) as very viable, the risk to a trade would be USD liquidity if the dollar continues to weaken.
Recommended trade: AUD JPY long

USDJPY: Strong Bullish Price Action 🇺🇸🇯🇵
I see 2 strong bullish confirmation on USDJPY after a test of a key daily
support cluster.
The price violated a trend line of a falling channel and a neckline of
an inverted head & shoulders pattern with one single strong bullish candle.
The pair may rise more and reach 144.45 level soon.
❤️Please, support my work with like, thank you!❤️
I am part of Trade Nation's Influencer program and receive a monthly fee for using their TradingView charts in my analysis.

USDJPY: Pullback From SupportI believe that 📈USDJPY could bounce up from the highlighted intraday support.
I see 2 bullish breakout confirmations:
bullish breakouts of a neckline of a cup and handle pattern and a resistance line of a falling wedge pattern.
Goal - 144.67

UJ, will we see a bearish leg today?USDJPY looks quite interesting after the wick rejection from key level 144.000. Will this area be respected and give us a bearish leg. Hmm, let's see how price unfolds for this pair today.
Regards,
Aman | SMC Wolf FX
1-1 student onboarding is currently open (website in my signature & profile)
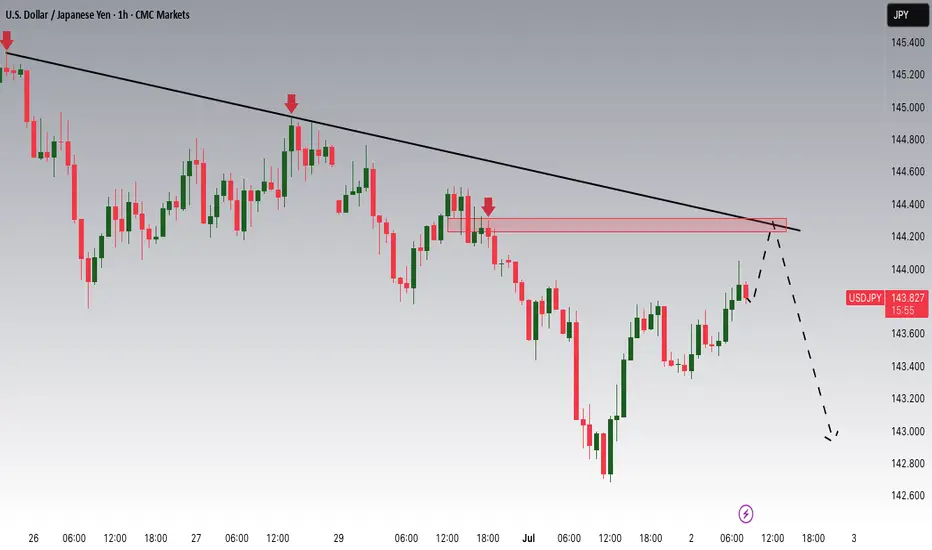
DeGRAM | USDJPY correction 📊 Technical Analysis
● Monday's rebound above the 4-month falling trend line was quickly repelled, leaving a “false breakdown” candle; price has returned under the line and is now retesting it as resistance around 144.65.
● The rebound also stopped at the top of the triangle and a small bearish flag formed; the height of the pattern points to the 142.80 support band and the broader channel to 139.90 as continuation.
💡 Fundamental analysis
● Softer U.S. core GDP data drove 2-year Treasury yields to two-week lows, reducing the rate differential that favored the dollar.
Meanwhile, Japanese officials again warned that they “do not rule out any measures” against excessive yen weakening, raising the risk of intervention and discouraging new long USD/JPY positions.
Summary
Short 144.4 - 144.65; break below 143.8 targets 142.8 -> 139.9. Bearish view loses strength with a 4-hour close above 145.30.
-------------------
Share your opinion in the comments and support the idea with like. Thanks for your support!

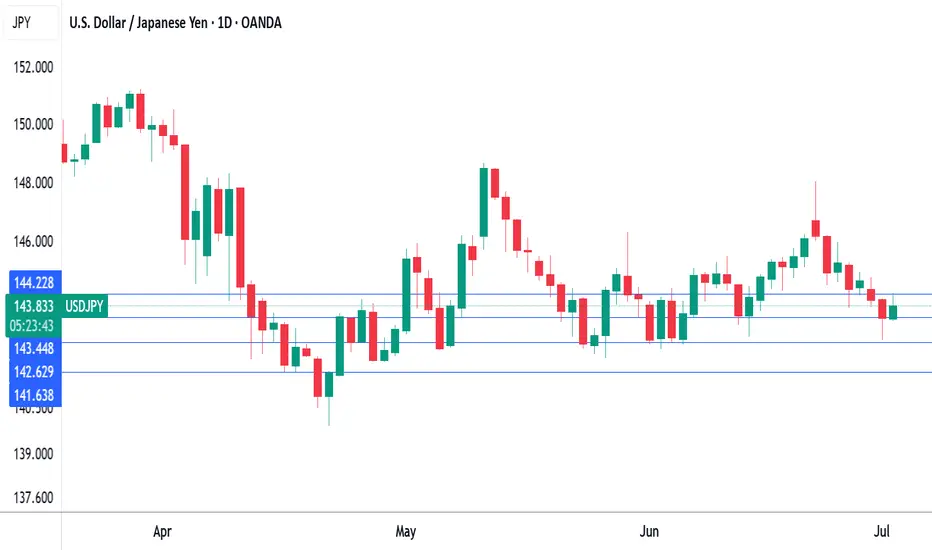
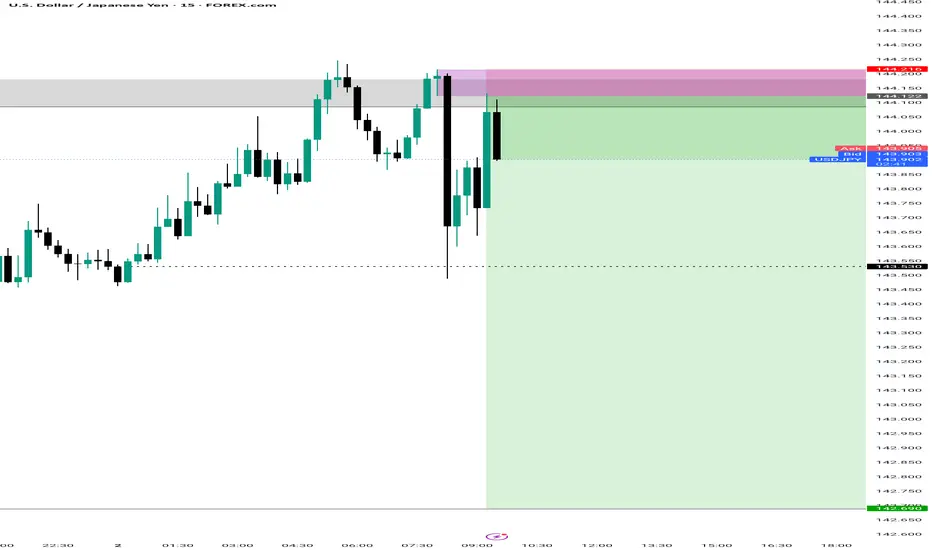
Buy limit order at $143.400 after a retest confirms supportAnalyzing the USD/JPY across multiple timeframes, we observe a consistent pattern of price recovery after a significant drop, indicating a potential phase of accumulation by institutional players. The daily chart shows a recent decline followed by a stabilization and slight upward movement, suggesting a possible change of character (CHoCH) from bearish to bullish momentum. The 4-hour and 1-hour charts confirm this with a series of higher lows and higher highs, indicative of a shift towards bullish sentiment.
The 15-minute, 5-minute, and 1-minute charts display more granular price action, with recent bullish candles suggesting an ongoing push for higher prices. This could be a response to retail selling pressure being absorbed by institutional buying, a common scenario during early stages of a bullish reversal.
INSTITUTIONAL THESIS:
Institutions appear to be in the early stages of an accumulation phase, targeting liquidity above recent highs to trigger stop losses and fuel further upward movement. The presence of unmitigated order blocks (OB) on the 1-hour chart around 143.400 provides a potential area for re-entry, suggesting that price may revisit this zone to balance before continuing upwards.
LEARNING POINT:
"1H Order Block mitigation after liquidity sweep" - This scenario highlights how institutions often retest key levels where significant orders were previously placed, confirming their commitment to driving the price in the intended direction.
SIGNAL: BUY
SYMBOL: USDJPY
ENTRY PRICE: $143.400
STOP LOSS: $143.200
TARGET PRICE: $144.000
CONDITION: Buy limit order at $143.400 after a retest confirms support.
RATIONALE: The setup aligns with a bullish CHoCH on multiple timeframes, presence of a 1H OB, and the anticipation of a liquidity sweep above recent highs.
STRATEGIES USED: 1H OB Mitigation, Liquidity Sweep Above Recent Highs
URGENCY: MEDIUM
TIMEFRAME: Short-term
CONFIDENCE SCORE: 85%
RISK/REWARD RATIO: Risk=$0.20, Reward=$0.60, Ratio=1:3.0
CRITICAL RULES:
The analysis strictly adheres to Smart Money Concepts, avoiding traditional retail indicators.
The decision is based on visible price action and institutional logic, ensuring a high probability of success.
The risk/reward ratio exceeds the minimum requirement of 2:1, enhancing the trade's viability.
