The Yen the cause of the next decline?The yen strengthening is what preceded the last market selloff and it looks like it could also be the cause of the next one.
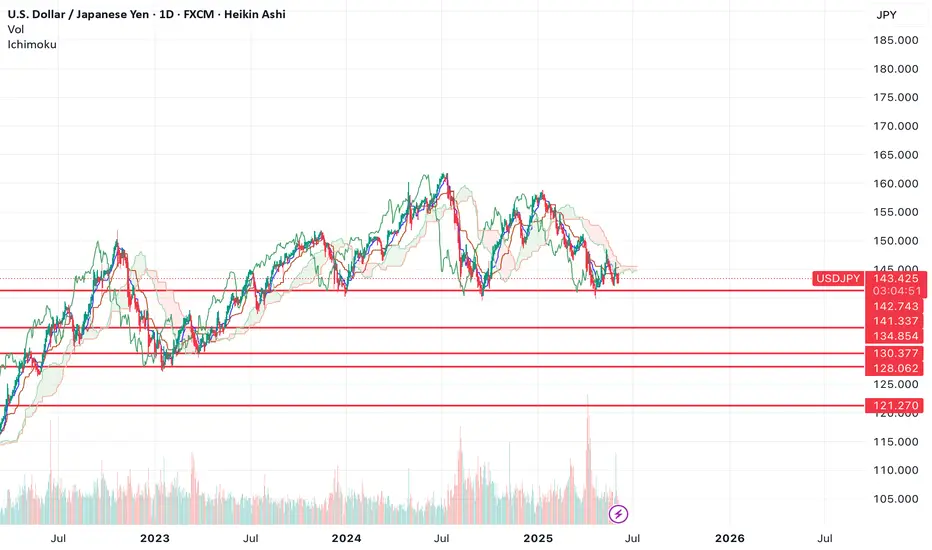
If we look at the chart, it seems like we've now formed a massive top.
If USDJPY breaks through support at 141.33 that should be the initial trigger for a short. Below $139, under the wicks would be the safer play.
I could see the move going all the way down to the lower support levels.
Let's see how it plays out.
USDJPY trade ideas
USD/JPY back at neckline as soft US data narrows yield spreadToday's soft US data releases weighed on US yields, which helped to further narrow the US-Japan spreads on the long dated bond yields. In turn, the USD/JPY gave up its entire gains from the day before when it was boosted by the JOLTS data. Next move could be defendant on the nonfarm payrolls report on Friday.
From a technical point of view, this is text book stuff. Price is testing a key area of support at the time of writing, between 142.00 to 142.70, as marked in grey on the chart. This zone has provided strong support on multiple occasions, preventing rates from sliding towards 140.00 zone. Now the more a level or an area is tested, the more likely it will break down. Will we see a break here in the next few days? Or will support continue to hold, as improving risk appetite gives US dollar some breathing space?
Well, the pair is down quite a lot on the session, so i wouldn't rule out a bounce here heading into US close. But the trend direction is clear: bearish.
By Fawad Razaqzada, market analyst with FOREX.com

USD/JPY(20250604)Today's AnalysisMarket news:
Fed Logan: We should focus on achieving the 2% inflation target rather than trying to make up for past inflation shortfalls; Bostic: We still think there may be a rate cut this year.
Technical analysis:
Today's buying and selling boundaries:
143.47
Support and resistance levels:
145.19
144.55
144.13
142.81
142.39
141.75
Trading strategy:
If the price breaks through 144.13, consider buying in, with the first target price of 144.55
If the price breaks through 143.47, consider selling in, with the first target price of 142.81

USDJPY Sell analysis/ideaThis analysis is based on the daily and 4-hour timeframes and is executed based on trend formation, reversal trading, and breakouts. Complete explanation in the video!

USD_JPY RISKY LONG|
✅USD_JPY will soon retest a key support level of 142.000
So I think that the pair will make a rebound
And go up to retest the supply level above at 143.180
LONG🚀
✅Like and subscribe to never miss a new idea!✅
Disclosure: I am part of Trade Nation's Influencer program and receive a monthly fee for using their TradingView charts in my analysis.

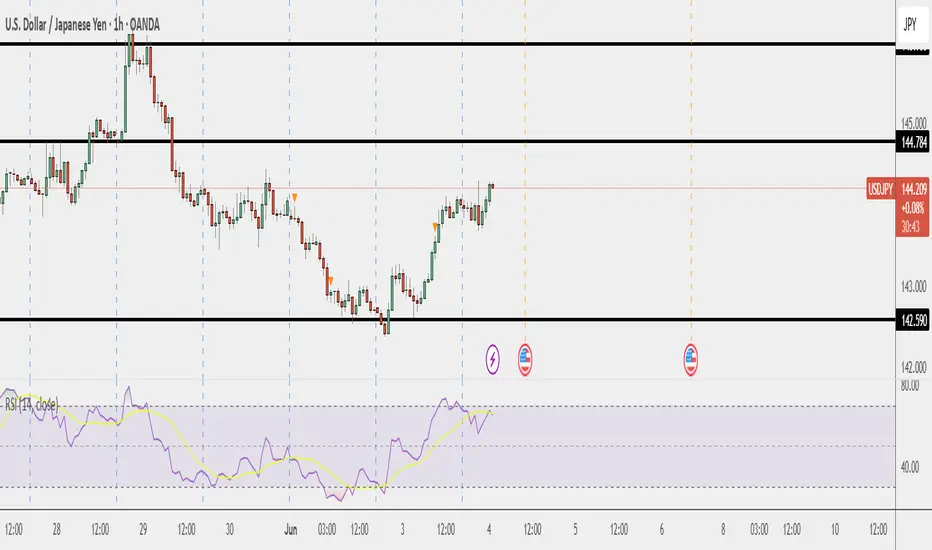
Is the 144 level becoming a key battleground for positioning?The USD/JPY exchange rate has staged a mild rebound for the second consecutive day, though it remained capped below the 144.00 level during the European session. Despite short-term signs of stabilization, the pair remains broadly pressured by a dual combination of fundamental expectations and technical resistance. Persistently constrained by selling pressure above 144.00 and failing to achieve a volume-supported breakout, the exchange rate is expected to continue trading within a range-bound consolidation between 142.00 and 144.80. Focus remains on the multi-empty battles in the 143.40 and 142.30 zones.
Humans need to breathe, and perfect trading is like breathing—maintaining flexibility without needing to trade every market swing. The secret to profitable trading lies in implementing simple rules: repeating simple tasks consistently and enforcing them strictly over the long term.

USDJPY Tests Channel Support After ADP Shock — Rebound Ahead?In the last hour's candle after the ADP Non-Farm Employment Change Index was released, USDJPY ( FX:USDJPY ) started to fall, but considering the position of this pair, I think we can have a good Risk-To-Reward even if the Stop Loss (SL) is touched.
USDJPY is trading near the lower line of the ascending channel and the Support zone(143.870 JPY-143.430 JPY) .
From an Elliott Wave perspective , USDJPY appears to be completing a corrective pattern .
I expect USDJPY to rise at least to the Potential Reversal Zone(PRZ) .
Note: Stop Loss = 143.220 JPY
Please respect each other's ideas and express them politely if you agree or disagree.
U.S. Dollar/Japanese Yen Analyze (USDJPY), 1-hour time frame.
Be sure to follow the updated ideas.
Do not forget to put a Stop loss for your positions (For every position you want to open).
Please follow your strategy and updates; this is just my Idea, and I will gladly see your ideas in this post.
Please do not forget the ✅' like '✅ button 🙏😊 & Share it with your friends; thanks, and Trade safe.

USDJPY MULTI TIME FRAME ANALYSISHello traders , here is the full multi time frame analysis for this pair, let me know in the comment section below if you have any questions , the entry will be taken only if all rules of the strategies will be satisfied. wait for more price action to develop before taking any position. I suggest you keep this pair on your watchlist and see if the rules of your strategy are satisfied.
🧠💡 Share your unique analysis, thoughts, and ideas in the comments section below. I'm excited to hear your perspective on this pair .
💭🔍 Don't hesitate to comment if you have any questions or queries regarding this analysis.


USDJPY 15M READY SELL PAYOUT :))We have retest to last week 4h BROKEN SUPPORT (WHICH ACT WELL AS RESISTANCE TODAY)
We have form RISING WEDGE 15M (AS YOU CAN SEE ITS BROKEN)
I went in with few TP TARGET (SAFE ENTRY BELOW 143.85)
TP1 142.93
TP2 142.43
TP2 140.86
Let see :)

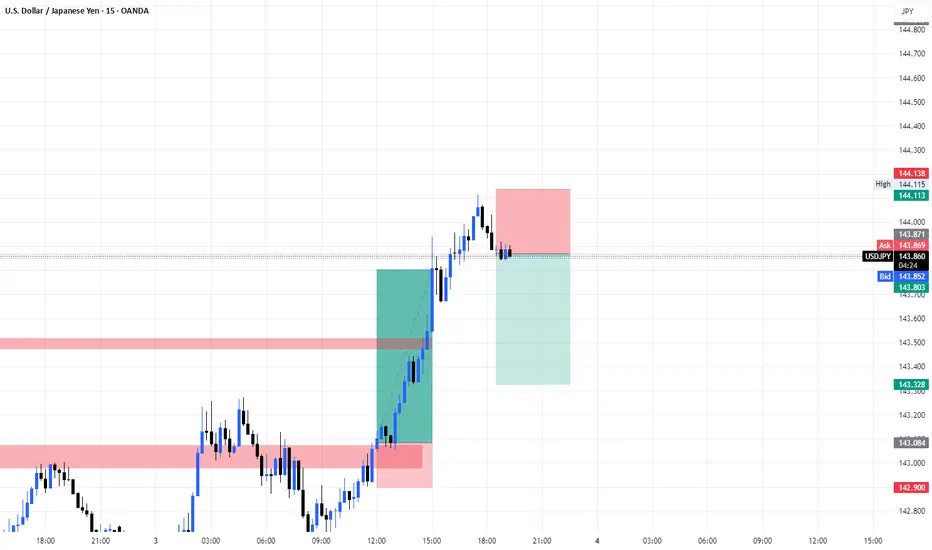
Usdjpy 03/06/2025After a bullish trade in the morning, we anticipated that the price might reach an Order Block (OB) — which it did. Now, we're seeing a rejection from the OB, so we'll be looking to enter a short position.
USDJPY Will Go Higher From Support! Buy!
Take a look at our analysis for USDJPY.
Time Frame: 2h
Current Trend: Bullish
Sentiment: Oversold (based on 7-period RSI)
Forecast: Bullish
The market is on a crucial zone of demand 143.192.
The oversold market condition in a combination with key structure gives us a relatively strong bullish signal with goal 144.216 level.
P.S
We determine oversold/overbought condition with RSI indicator.
When it drops below 30 - the market is considered to be oversold.
When it bounces above 70 - the market is considered to be overbought.
Disclosure: I am part of Trade Nation's Influencer program and receive a monthly fee for using their TradingView charts in my analysis.
Like and subscribe and comment my ideas if you enjoy them!

BULLISH?I think the USD/JPY might go up to the 161.670 zone before it falls down and gain more downwad momentum... we shall see,,

USDJPYCurrently, the price seems to be forming corrective wave (b), with a potential upward move toward the 144.78 – 145.45 area as wave (c). After that, a new bearish wave (wave 3) may begin, with targets around 141.36 and 139.03 . This analysis is based on Elliott Wave structure and Fibonacci retracement levels.

USDJPY M15 Support & Resistance Levels🚀 Here are some key zones I've identified on the 15m timeframe.
These zones are based on real-time data analysis performed by a custom software I personally developed.
The tool is designed to scan the market continuously and highlight potential areas of interest based on price action behavior and volume dynamics.
Your feedback is welcome!

Dollar-yen could settle into a rangeThe Bank of Japan’s Governor Kazuo Ueda commented again on 3 June that the BoJ is ready to continue raising rates if economic data are generally in line with forecasts, but there remains some intrigue whether the next hike could be as early as next month or have to wait until September. The Fed meanwhile is unlikely to cave to on-and-off pressure from the American government to cut rates given uncertainties over trade and tariffs’ potentially larger impact on inflation.
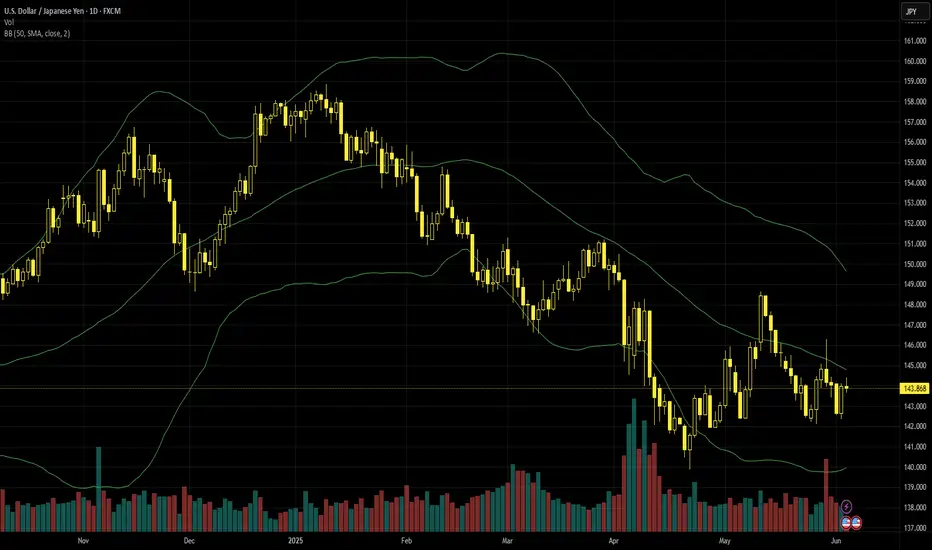
Buying demand for dollar-yen seems to be quite limited, with volume having dropped significantly since the peak in the first half of April, similar to several other major forex pairs. ¥140 remains a potentially strong support but the price is unlikely to retest there seriously in the near future unless the NFP and next week’s inflation are significantly lower than expected.
¥142 is a possible short-term support while the main initial resistance is around ¥146. A range between these areas seems on the whole more likely than a new directional trend unless upcoming data deliver notable surprises or trade issues intensify significantly.
This is my personal opinion, not the opinion of Exness. This is not a recommendation to trade.

USDJPY likely bounce from the support RSI turning upward from near 40 → bullish reversal signal. MACD histogram is reducing red bars — showing bearish momentum weakening. MACD lines are close to crossing again — early bullish crossover setup

Fundamental Market Analysis for June 4, 2025 USDJPYEvents to pay attention today:
17:00 EET. USD - ISM Services Business Activity Index
15:15 EET. USD - ADP Employment Change
USDJPY:
The Japanese yen (JPY) is attracting some intraday buyers after falling against the US dollar during the Asian session, and, at least for now, it seems that its pullback from the weekly high reached yesterday has paused. An upward revision of Japan's services business activity index, as well as expectations that wage growth will lead to faster inflation, leave open the possibility of another interest rate hike by the Bank of Japan (BoJ) in 2025. In addition, ongoing geopolitical risks and trade uncertainty are key factors supporting the JPY.
Meanwhile, cautious statements by BoJ Governor Kazuo Ueda on Tuesday sparked speculation that the next interest rate hike will not happen anytime soon. However, this still differs significantly from expectations that the Federal Reserve (Fed) will cut rates by at least 25 basis points (bps) by the end of this year. This, along with concerns about the US budget, is causing a new wave of selling of the US dollar (USD) after Tuesday's decent rebound from a six-week low and is putting some pressure on the USD/JPY pair during the Asian session.
Trading recommendation: SELL 144.20, SL 144.40, TP 143.20

June 4th Update Reports: ISM Non-Manufacturing Purchasing Managers' Index (PMI)
This is a monthly report by the institute for Supply Management (ISM)
Basically, provides a look into economic health of the U.S services sector, which includes industries such as finance, healthcare, retail, and professional services.
The four key subcomponents are Business activity, new orders, employment, and supplier deliveries.
We are looking for a score over 50 which represents expansion in the services sector, and you guessed it below 50 indicates contraction.
The last report was 51.6 up from 50.8 in March that shows modest expansion in services sector.
How does it relate to USD/JPY:
This significantly influences this currency pair due to it being a leading indicator of U.S. economic health
A score above 51.6 would show more expansion the forecast is currently 52 there is a possibility this could make the dollar more attractive to investors compared to yen and increase price.
Why? If yields on U.S. Treasuries increase, it could make the dollar more attractive to investors compared to yen
A score above 50 but lower than 51.6 concerns me
Targets:
Buy: 144.780 (open and close above)
Sell: 143.655 (open and close below)
If you took the call from yesterday and are still in trade, be sure to protect your position anything can happen, and we want to lock in profits.
USDJPY H4 I Bullish Bounce Off Based on the H4 chart analysis, the price is trading near our buy entry level at 143.99, a pullback support
Our take profit is set at 145.06, a pullback resistance.
The stop loss is placed at 142.49, a swing low support.
High Risk Investment Warning
Trading Forex/CFDs on margin carries a high level of risk and may not be suitable for all investors. Leverage can work against you.
Stratos Markets Limited (tradu.com ):
CFDs are complex instruments and come with a high risk of losing money rapidly due to leverage. 63% of retail investor accounts lose money when trading CFDs with this provider. You should consider whether you understand how CFDs work and whether you can afford to take the high risk of losing your money.
Stratos Europe Ltd (tradu.com ):
CFDs are complex instruments and come with a high risk of losing money rapidly due to leverage. 63% of retail investor accounts lose money when trading CFDs with this provider. You should consider whether you understand how CFDs work and whether you can afford to take the high risk of losing your money.
Stratos Global LLC (tradu.com ):
Losses can exceed deposits.
Please be advised that the information presented on TradingView is provided to Tradu (‘Company’, ‘we’) by a third-party provider (‘TFA Global Pte Ltd’). Please be reminded that you are solely responsible for the trading decisions on your account. There is a very high degree of risk involved in trading. Any information and/or content is intended entirely for research, educational and informational purposes only and does not constitute investment or consultation advice or investment strategy. The information is not tailored to the investment needs of any specific person and therefore does not involve a consideration of any of the investment objectives, financial situation or needs of any viewer that may receive it. Kindly also note that past performance is not a reliable indicator of future results. Actual results may differ materially from those anticipated in forward-looking or past performance statements. We assume no liability as to the accuracy or completeness of any of the information and/or content provided herein and the Company cannot be held responsible for any omission, mistake nor for any loss or damage including without limitation to any loss of profit which may arise from reliance on any information supplied by TFA Global Pte Ltd.
The speaker(s) is neither an employee, agent nor representative of Tradu and is therefore acting independently. The opinions given are their own, constitute general market commentary, and do not constitute the opinion or advice of Tradu or any form of personal or investment advice. Tradu neither endorses nor guarantees offerings of third-party speakers, nor is Tradu responsible for the content, veracity or opinions of third-party speakers, presenters or participants.

USDJPY InsightWelcome, everyone!
Please share your personal opinions in the comments. Don't forget to hit the booster and subscribe!
Key Points
- Japanese local media, including Kyodo News, reported that the U.S. and Japan are likely to hold the 5th round of high-level tariff negotiations later this week in the U.S.
- The Eurozone’s preliminary Consumer Price Index (CPI) for May rose by 1.9% YoY, slightly below the market forecast of 2.0%. The ECB is expected to cut interest rates this Thursday, and further stimulus measures are anticipated through the end of the year.
- Caroline Leavitt, White House Press Secretary, stated that “dialogue between the U.S. and China will take place soon,” reaffirming that communication between President Trump and President Xi Jinping remains valid and active.
- The U.S. job openings in April stood at 7.39 million, exceeding the market expectation of 7.10 million, suggesting continued strength in the U.S. labor market.
This Week’s Major Economic Events
+ June 4: Bank of Canada Interest Rate Decision
+ June 5: ECB Interest Rate Decision
+ June 6: U.S. Nonfarm Payrolls for May, U.S. May Unemployment Rate
USDJPY Chart Analysis
The pair has recently shown significant movement around the 144 level. The downtrend has been completely broken, and in the short term, USDJPY is expected to fluctuate within the 140–149 range. Due to resistance at higher levels, there's a strong chance the price could fall back to the 140 support zone. However, if the pair turns upward, a rise toward the 149 level is also likely.

USDJPY Sell tradeSell opportunity on USDJPY
Entry: 144.000
Stoploss: 144.100
Take Profit: 142:150
Comment your opinion pls.
Follow me on X @shajudeakinoba1 for update and Account management
