USDJPY (daily analysis) 1/8hi everyone hope everyone had a great week and have a great weekend happy trading as always
USDJPY trade ideas

USDJPY M15 Pending SELL Setup 🧭 1. Market Structure (15M + Higher TF Context)
Recent Shift: Bullish structure broke down with an aggressive bearish move (clear BOS).
Consolidation Zone (~147.45–148.17): Price accumulated after the impulsive drop.
Now: Currently trading just above 147.00, testing intraday support.
✅ Structure:
Prev. Highs swept (liquidity grab at top), followed by impulsive drop.
Price formed a bearish flag, broke down, and is now retesting the lower zone.
🗃️ 2. Liquidity Zones
🔴 Buy-side Liquidity Grab: Fakeout to the upside just before the dump — textbook inducement.
🔵 Sell-side Liquidity: Now building under 147.00, with lows being swept but no follow-through (yet) → potential liquidity engineering.
⚠️ If price closes below 146.90, sellers may step in with conviction.
🕯️ 3. Candlestick Behavior
Inside the consolidation box, candles show:
Weak bullish momentum
No strong engulfing or continuation
On the breakout, large bearish candles with follow-through, showing institutional intent
Now: Wicks on both sides → market indecision, likely accumulation before expansion
🔍 4. Chart Patterns Identified
🏁 Bear Flag: Formed after breakdown → continuation pattern
📦 Consolidation box (~147.0–148.15): Liquidity build-up
📉 Descending Triangle Potential: Multiple touches at support (~147.00) with lower highs — bearish pressure building
🔢 5. Fibonacci Reference (Swing High ~149.10 to Swing Low ~146.90)
Level Price Notes
0.382 ~147.70 Rejected here
0.5 ~148.00 Mid-consolidation box
0.618 ~148.25 Price failed to touch
📉 Bias stays bearish unless 148.25 is breached & closed above with volume.
📌 6. Trade Setup
📍 Pending Sell Setup
🔄 Alternative Scenario
📍 Invalidation & Buy Scenario
Only if strong bullish candle closes above 148.20
That would flip structure bullish
But current order flow does not favor this yet.
🧠 Final Notes:
Wait for clear breakout and candle close below 146.90 — no impulse entries inside the range.
Use 1M/5M price action to fine-tune entries once breakout occurs (look for break of structure + BOS on LTF).
Watch Tokyo/London open for real volume to kick in.

USDJPY - NEW BREAKOUT !Hello Traders !
The USDJPY broke the resistance level (148.831 - 149.185).
This key level becomes new support!
So, I expect a bullish move🚀
_______________
TARGET: 150.605🎯

USDJPY - Long 152.90USDJPY Expected to longer. The pair will see 152.90 levels. The Pair is expected to retrace to the levels of 145.24 before flying high.

USDJPY swing bull trade - 4.8.25We are in bullish trend 4H and 1H timeframe. On 15 min we have bullish divergence. Trade is already on BE. Lets see, what market can give us.

AUDUSD – SHORT POSITION TRADE BREAKDOWN Q3 | W32 | D6 | Y25📊 AUDUSD – SHORT POSITION TRADE BREAKDOWN
Q3 | W32 | D6 | Y25
Daily Forecast 🔍📅
Here’s a short diagnosis of the current chart setup 🧠📈
Higher time frame order blocks have been identified — these are our patient points of interest 🎯🧭.
It’s crucial to wait for a confirmed break of structure 🧱✅ before forming a directional bias.
This keeps us disciplined and aligned with what price action is truly telling us.
📈 Risk Management Protocols
🔑 Core principles:
Max 1% risk per trade
Only execute at pre-identified levels
Use alerts, not emotion
Stick to your RR plan — minimum 1:2
🧠 You’re not paid for how many trades you take, you’re paid for how well you manage risk.
🧠 Weekly FRGNT Insight
"Trade what the market gives, not what your ego wants."
Stay mechanical. Stay focused. Let the probabilities work.

USDJPY-BUY strategy 3 hourly chart Reg.ChannelThe pair is slightly oversold and in fact trailing below the channel. Downward pressure is still valid for now, so we would seek to BUY somewhere lower 146.50 area.
Strategy BUY @ 146.58 area and take profit near 148.37 for now.,
USD/JPY(20250804)Today's AnalysisMarket News:
① The US non-farm payrolls rose by 73,000 jobs in July, far below the expected 110,000; the previous two months saw a significant downward revision of 258,000 jobs, prompting traders to fully price in two Fed rate cuts before the end of the year.
② The US ISM Manufacturing PMI for July unexpectedly fell to 48, below the expected 49.5 and the lowest level since October 2024.
③ The University of Michigan Consumer Confidence Index for July reached a five-month high.
Technical Analysis:
Today's Buy/Sell Levels:
148.53
Support and Resistance Levels:
152.12
150.78
149.91
147.15
146.28
144.94
Trading Strategy:
If it breaks above 148.53, consider entering a buy position, with the first target price being 149.91. If it breaks below 147.15, consider entering a sell position, with the first target price being 146.28.

USDJPY InsightWelcome, subscribers!
Please share your personal opinions in the comments. Don’t forget to like and subscribe!
Key Points
- U.S. President Donald Trump announced a plan to impose a high tariff of 39% on Switzerland. In response, the Swiss side expressed willingness to revise the existing negotiation terms.
- Following the employment shock in the U.S., a rate cut by the Fed in September is now considered a given. Market expectations have shifted from 1–2 rate cuts this year to potentially 3. Investors are interpreting the Fed’s move as a precautionary cut to prevent economic cooling.
- On July 31, the Bank of Japan (BOJ) held rates steady. Although Governor Kazuo Ueda’s press conference was seen as showing caution toward future rate hikes, many economists expect a rate hike in October due to the BOJ raising its inflation outlook more than anticipated and adjusting its risk balance to neutral.
Key Economic Events This Week
+ August 7: Bank of England (BOE) interest rate decision
USDJPY Chart Analysis
After falling to the 146 level, the USD/JPY rose to 151, showing a movement in line with expectations. After reaching 151, the price encountered resistance and experienced a pullback. Currently, it is forming around the 147 level.
If it finds support here and rebounds, a breakout above the 151 level is likely. However, if it breaks down through the 147–146 zone, there is a possibility of a retreat to the 144 level.

USDJPY Is Very Bearish! Sell!
Here is our detailed technical review for USDJPY.
Time Frame: 9h
Current Trend: Bearish
Sentiment: Overbought (based on 7-period RSI)
Forecast: Bearish
The market is on a crucial zone of supply 150.492.
The above-mentioned technicals clearly indicate the dominance of sellers on the market. I recommend shorting the instrument, aiming at 148.583 level.
P.S
We determine oversold/overbought condition with RSI indicator.
When it drops below 30 - the market is considered to be oversold.
When it bounces above 70 - the market is considered to be overbought.
Disclosure: I am part of Trade Nation's Influencer program and receive a monthly fee for using their TradingView charts in my analysis.
Like and subscribe and comment my ideas if you enjoy them!

USDJPY SELL LIMIT ENTRIES. week of 8/4/25 BEARISH USD BIASthis USDJPY SELL MODEL is exactly the opposite of the XXXUSD pairs.

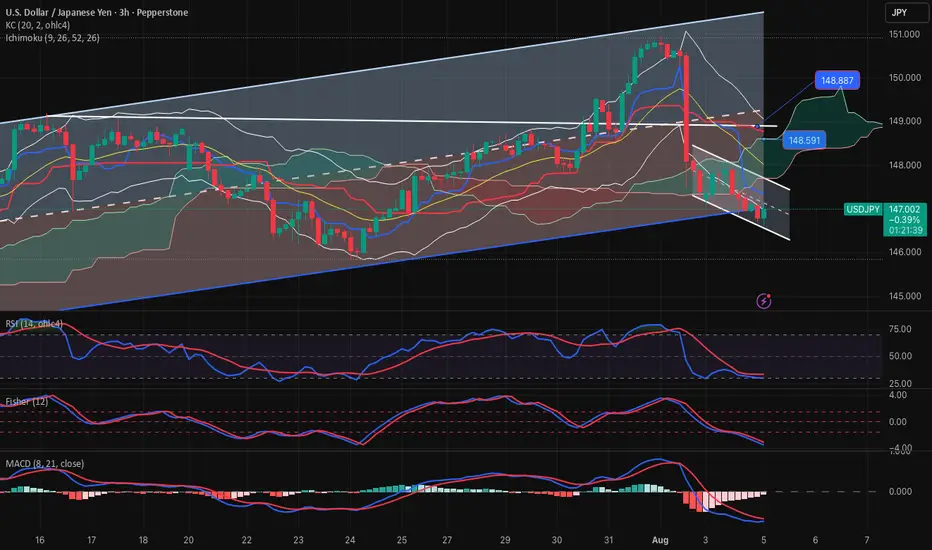
USDJPY - on the way to somewhere...USDJPY has always had a reputation of a very "technical" instrument. Certainly it is not anymore.
Somewhat weird policy of the BOJ during pandemic changed a lot.
Now it creates something like THAS (two heads and shoulders :) or Modified Wyckoff Distribution pattern :)
Anyway, what I can see is the following:
- price respected the Support level at FR 61.8 of the uptrend impulse (Jan '23 - Jul '24) and reverted there three times
- Now is approaching the Resistance cluster in between 148.68 and 151.52. Perhaps it will respect it - but who knows?
Just my humble opinion

THE RISE: Technical Analysis: USD/JPY vs. DXY
Upon reviewing the DXY (U.S. Dollar Index) in correlation with USD/JPY (UJ), current price action suggests a potential continuation toward new highs in USD/JPY. The strength in the DXY supports a bullish outlook, indicating sustained dollar momentum. Price structure on the USD/JPY chart aligns with this narrative, showing a clear uptrend with higher highs and higher lows, and no immediate signs of reversal. Overall, the technical setup appears favorable for further upside in USD/JPY.

usdjpy buyGlobal equities rose on Thursday, with Japanese shares hitting a record high, as tech-led gains on Wall Street, upbeat earnings, growing hopes for a ceasefire in Ukraine and expectations for U.S. rate cuts boosted sentiment.

Bearish correcion move 15minbig bearish momentum, move a break of this low will confirm the drop. Price is currently making a corrective move upward within a broader bearish structure. The 15-minute chart shows lower highs and lower lows (LHLs), and the current push up is tapping into previous demand turned supply zones. Liquidity is being swept above minor highs, indicating a likely distribution phase before the next leg down.

USDJPY – DAILY FORECAST Q3 | W32 | D7 | Y25📊 USDJPY – DAILY FORECAST
Q3 | W32 | D7 | Y25
Daily Forecast 🔍📅
Here’s a short diagnosis of the current chart setup 🧠📈
Higher time frame order blocks have been identified — these are our patient points of interest 🎯🧭.
It’s crucial to wait for a confirmed break of structure 🧱✅ before forming a directional bias.
This keeps us disciplined and aligned with what price action is truly telling us.
📈 Risk Management Protocols
🔑 Core principles:
Max 1% risk per trade
Only execute at pre-identified levels
Use alerts, not emotion
Stick to your RR plan — minimum 1:2
🧠 You’re not paid for how many trades you take, you’re paid for how well you manage risk.
🧠 Weekly FRGNT Insight
"Trade what the market gives, not what your ego wants."
Stay mechanical. Stay focused. Let the probabilities work.
FX:USDJPY

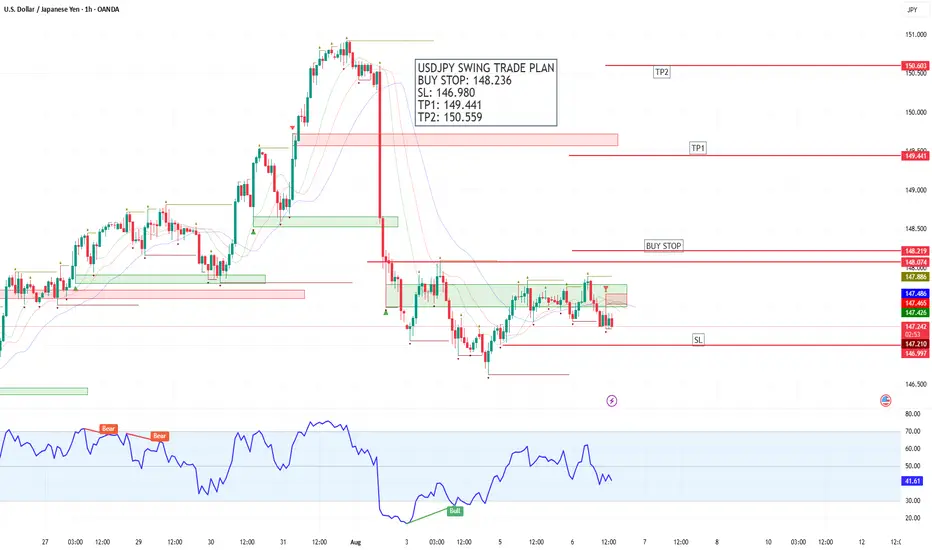
GBPJPY Trade Plan – 1H Chart Technical SetupA bullish breakout setup is forming on GBPJPY, presenting a potential swing trade opportunity:
🔹 Buy Stop: 197.122
🔹 Stop Loss (SL): 196.001
🔹 Take Profit 1 (TP1): 198.206
🔹 Take Profit 2 (TP2): 199.297
Price is consolidating just below the 197.122 resistance zone, which aligns with a supply area. A breakout above this could signal trend continuation, targeting the previous imbalance zones.
📉 The RSI is currently at 61, with recent bullish divergence, indicating strong buying momentum building up.
Key Points
Buy Zone: Marked above current range with entry upon breakout
TP1: Near previous order block and resistance rejection area
TP2: Approaching the next major supply zone
SL: Placed below the last valid demand zone for structure protection
🚨 Trade remains pending until price breaks and closes above 197.122. Risk-to-reward is favorable if confirmed.
💬 Wait for breakout confirmation — be patient, let the market come to you. Manage risk. Stay consistent. Trade smart!
USDJPY: Long Trade Explained
USDJPY
- Classic bullish formation
- Our team expects growth
SUGGESTED TRADE:
Swing Trade
Buy USDJPY
Entry Level - 147.26
Sl - 147.12
Tp - 147.53
Our Risk - 1%
Start protection of your profits from lower levels
Disclosure: I am part of Trade Nation's Influencer program and receive a monthly fee for using their TradingView charts in my analysis.
❤️ Please, support our work with like & comment! ❤️

USDJPY key trading level at 148.90The USDJPY pair is currently trading with a bearish bias, aligned with the broader downward trend. Recent price action shows a retest of the falling resistance, suggesting a temporary relief rally within the downtrend.
Key resistance is located at 148.90, a prior consolidation zone. This level will be critical in determining the next directional move.
A bearish rejection from 148.90 could confirm the resumption of the downtrend, targeting the next support levels at 146.10, followed by 145.40 and 144.60 over a longer timeframe.
Conversely, a decisive breakout and daily close above 148.90 would invalidate the current bearish setup, shifting sentiment to bullish and potentially triggering a move towards 149.75, then 150.20.
Conclusion:
The short-term outlook remains bearish unless the pair breaks and holds above 148.90. Traders should watch for price action signals around this key level to confirm direction. A rejection favours fresh downside continuation, while a breakout signals a potential trend reversal or deeper correction.
This communication is for informational purposes only and should not be viewed as any form of recommendation as to a particular course of action or as investment advice. It is not intended as an offer or solicitation for the purchase or sale of any financial instrument or as an official confirmation of any transaction. Opinions, estimates and assumptions expressed herein are made as of the date of this communication and are subject to change without notice. This communication has been prepared based upon information, including market prices, data and other information, believed to be reliable; however, Trade Nation does not warrant its completeness or accuracy. All market prices and market data contained in or attached to this communication are indicative and subject to change without notice.

Bullish returndaily shows break of channe resistance trend line, choch and bos REVERSE HEAD AND SHOULDER

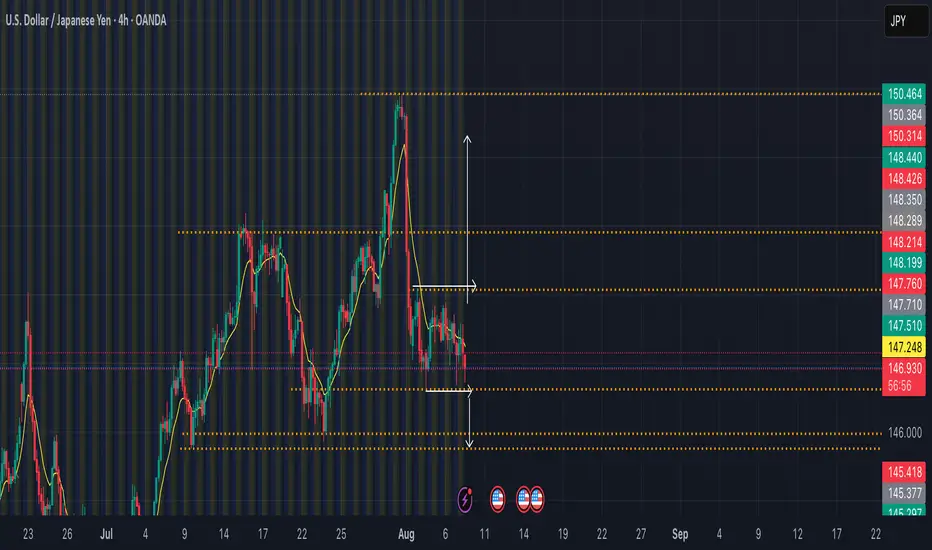
Trade Idea: Aug 7 - Asian Session - Possible both directionsHTF: D/4Hr - The daily looks like an uptrend, however on the 4h we are seeing lows being target which would be equal to previous lows, hinting a range market possibility.
MTF: 30m - Using the key levels from the HTF, we spot break of structure areas for trade entries on the range being formed. We identified targets for price to go.
ETF: 5m - Place the limit orders on the outside of the break of structure with a stoploss in areas we feel should act as resistance or support to the target direction.
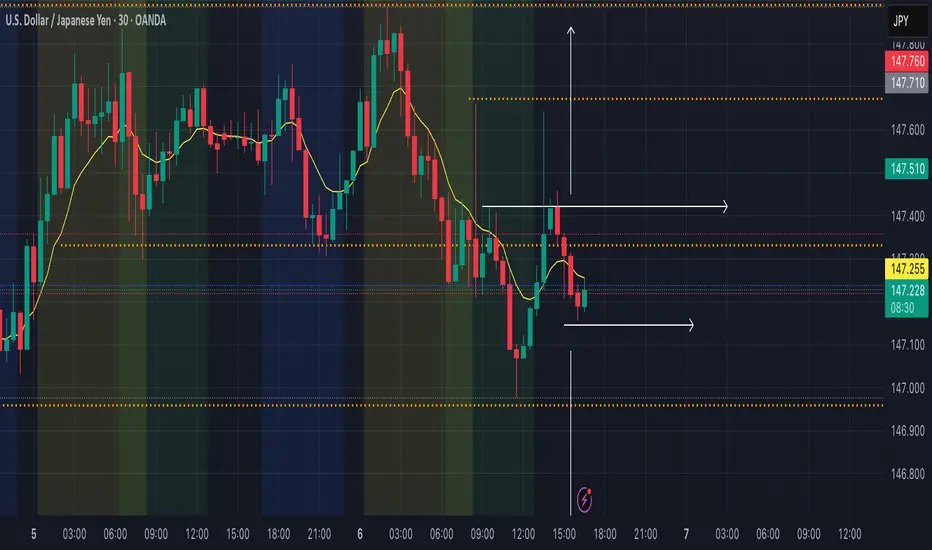
Trade Idea: Aug 6 - USDJPY - Both DirectionsHTF: D / 4HR - Seems to be in a consolidation, I feel I should just sit on the side line, but trying it out.
MTF: 30m - Identified key areas of support and resistance
ENT 5 - Enter on breaks of structure, manage risk dynamically
UsdjpyUsd weak against jpy
As you see bearish momentum is started and we can see gold also rising so
As per my analysis usfjpy should fall it to next support level that is 141.07
