U.S. Dollar / Japanese Yen forum
be adding. JXY is fishy, DXY on uptrend. Do not lose focus on 148.800. I was worried about gaining a share on the run to 150s, didn’t realize how soon that would be. We need bullish momentum on the 1 hr MACD for the next trading session to curve the 4hr MACD to rally bullish
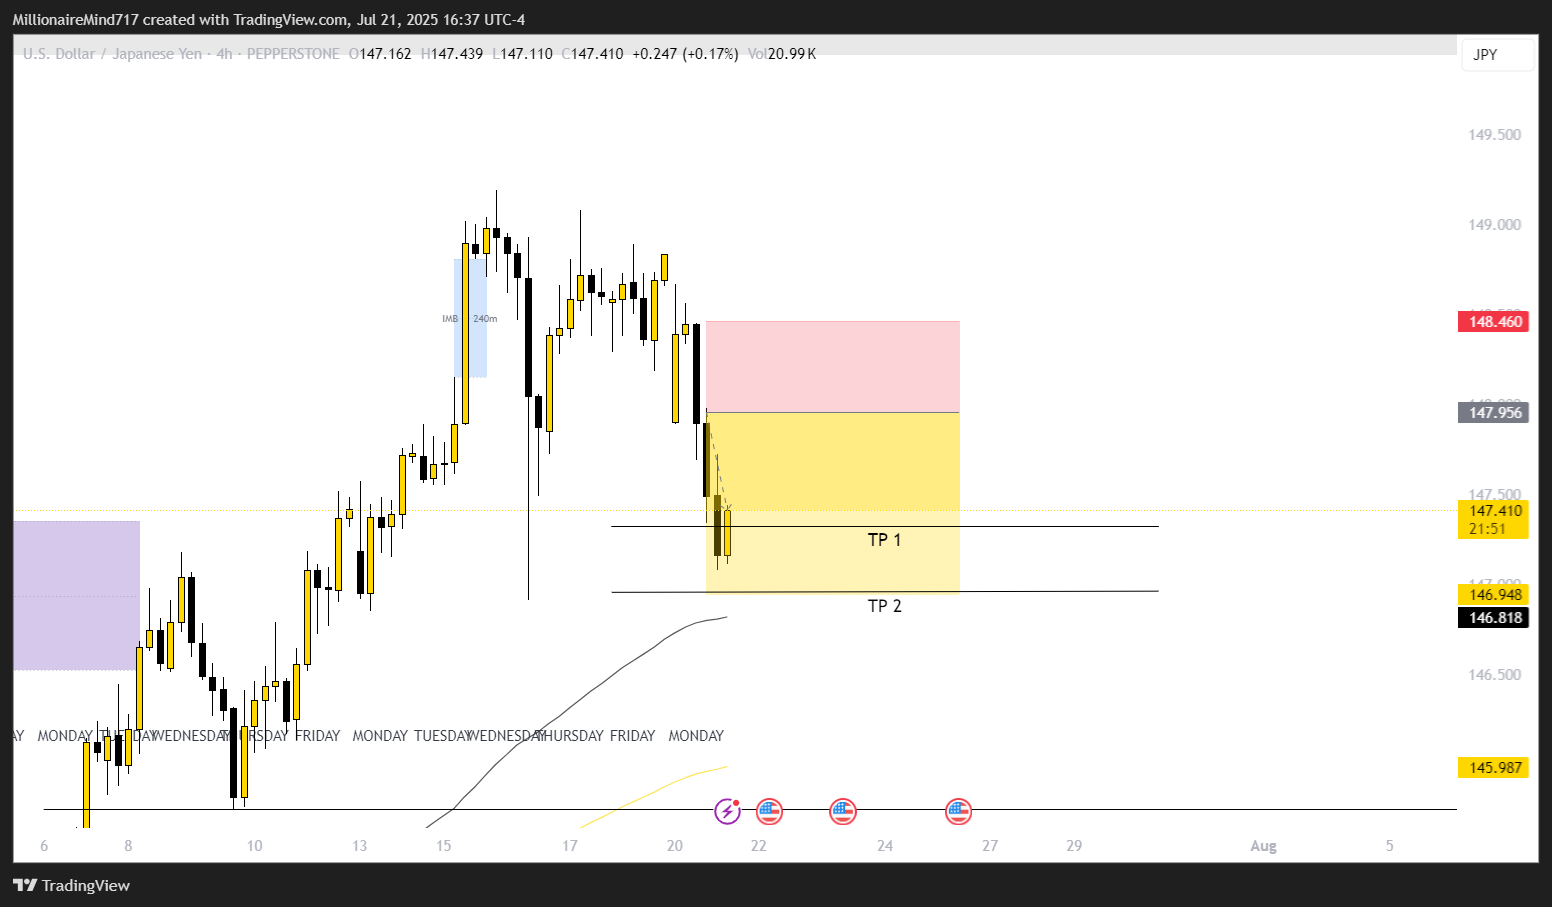
if you are short
147.890 is the area to short from.
If you are long wait until the weekly FVG 146.860 or a daily FVG 145.760.
As always happy trading
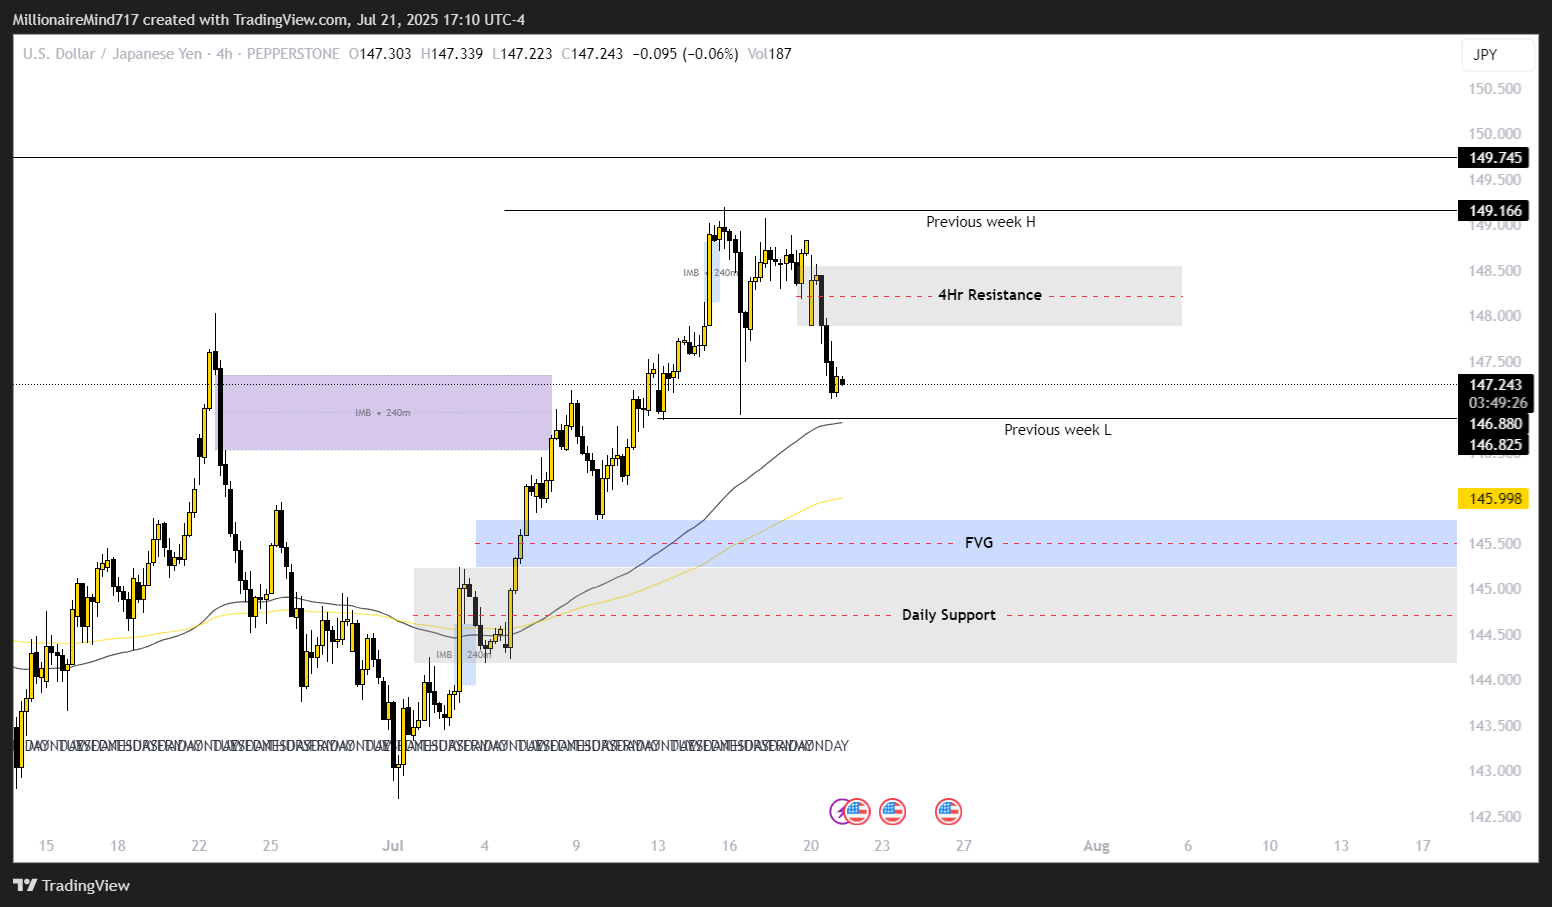
Idea: USDJPY (Weekly analysis) 22/07