USD/MYR (Ringgit) Monthly Update (27 Mar 2017)Look likes it is going to make a pull back.
It can go down to 4.30 as immediate swing level.
Let's see
S0nic
USDMYR trade ideas

USD/MYR Update (12 Mar 2017) *Uptrend Still IntactIt is for sure USD/MYR is in position swapping mode for now yet we are still seeing position is still intact as long as 4.30 level is supported well..
For any short position, you may have to TP around 4.30 region.
Trade Safe,
S0nic


USDMYR is hitting the ceiling?From the daily chart, it looks like USD is slightly losing its grip against Ringgit, having some hard time breaking out 4.5 zone. Also indicated from movement index that uptrend slight losing its power. But this doesn't necessary mean a good news to Ringgit too. Although Ringgit is starting to get take control since 5th January, we can still see obvious rejection to push the price even lower (Box 1).
Also EMA(130) hasn't been retested for quite some times. There may be a potential consolidation in the 4.4 - 4.5 area once the price fall below current EMA(130) and it hits the 4.4 support line, as the current uptrend (Box 2) has similar candlestick pattern structure from 25th May - 7th October 2015 (Box 3).
I still believe the price may hit 4.4, but probably may need huge effort from Ringgit side to make it happen.


USDMYR continue to rally higherUSDMYR:
USD continue to rally against MYR. The rally is strong as it stay above Daily EMA20 since 2 months ago. The first sign of recovery if it break below EMA20
- Major event ahead in US is Election on Nov 8th, 2016, and possibility of rate hiking in Dec2016.
- Msia just announced Budget for 2017. Total spending increase from last budget, significant an increase in potential spending next year. However, market does not respond positive/negatively over the news. It could be due to low trading volume as budget announced post-market time. Another reason is due to expected budget by market. Take note also on possible General Election in 2017, instead of 2018 due.

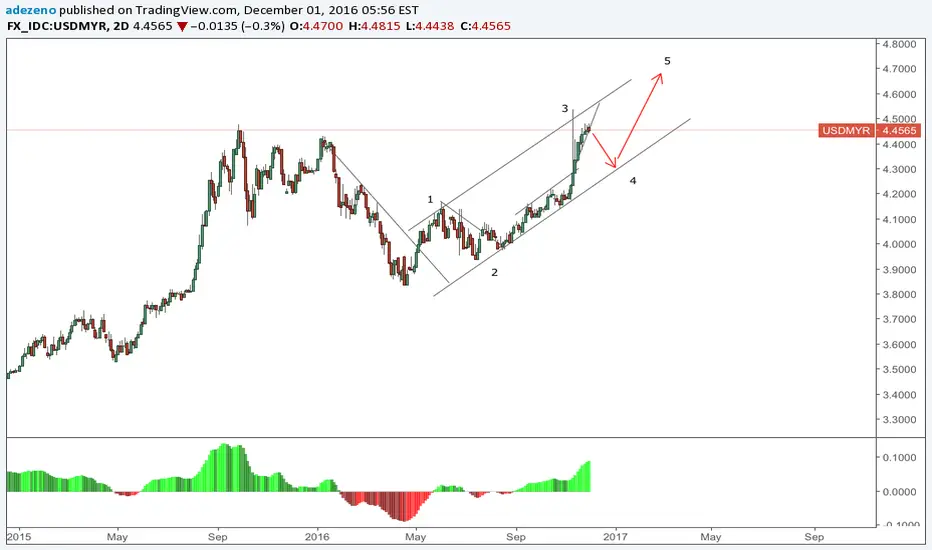
USDMYR first short then long This is my country currency. I belive wave 3 just completed, now as price break out from the small upward trendline, i will consider this a formation of wave 4 to complete within the channel itself.
USDMYR: MYR get hit ?!?!?!? USDMYR:
USD spike up since Trump elected as US President. The rally is strong and broke above up trend line.
- “Global investors are favoring conditions in the U.S. market
- Offshore investors pulled money out of emerging Asia into U.S. Treasury, regional currencies were walloped. Malaysian ringgit dove 2.7%, according to FactSet.
- There are significant near-term uncertainties in the first few weeks after the election, as markets are waiting for President-elect Trump to lay out his policy directions.
- Understand Trump. Trump anti-Islam, anti-globalization, and anti-green. Pro- business, pro-American.
- The falling MYR is not an attack to Ringgit (based on current findings). Basically, emerging country will get hit as Trump favor in reduce tax, boost bank sector (loan). Offshore investment money flow to US.
- Malaysia point of view, MYR is very weak fundamentally, and is vulnerable to news. Thus, it get hit badly. Depreciated more than 12% in one day.!! But recover a bit shortly.

USD/MYR Malaysia Daily Update (11 Nov 2016)It just broke 4.46x main region with STRONG momentum. (Breaking wall with Bulldozer)
Once it is broken strongly UP.. More UPside ahead for this pair..
IMO, Malaysia economy is free fall with bad policy and with the depressed oil price.
Trade Safe,
s0nic


USDMYR Continue to Rally AgainA quick update on MYR. USD start to rally despite no rate hiking in Sept. Technically MYR have moved out from consolidate zone, and start depreciate further against USD. I foresee a slight and quick pull back on USDMYR, and then continue to rally. Next target of resistance will be around 4.2. To breakout from uptrend channel, USDMYR need to fall below 4.05 to form a Lower Low.


Weekly Trading View, USDMYR (4th July 2016)USDMYR 3.9552 is a strong Daily Support, Let's see how market movement in this few days. Happy Trading Day !!!


USD/MYR forecastFundamental :
-USD "consider " to hike rate
Technical :
-Heading to North ( $4.40 ) to form FTR setup .
-If want to long at mid term , can long at minor structure b currently .
Just my forecast based on Supply & Demand , Elliot Wave and others tecnical knowledge .
My view is my risk
TQ

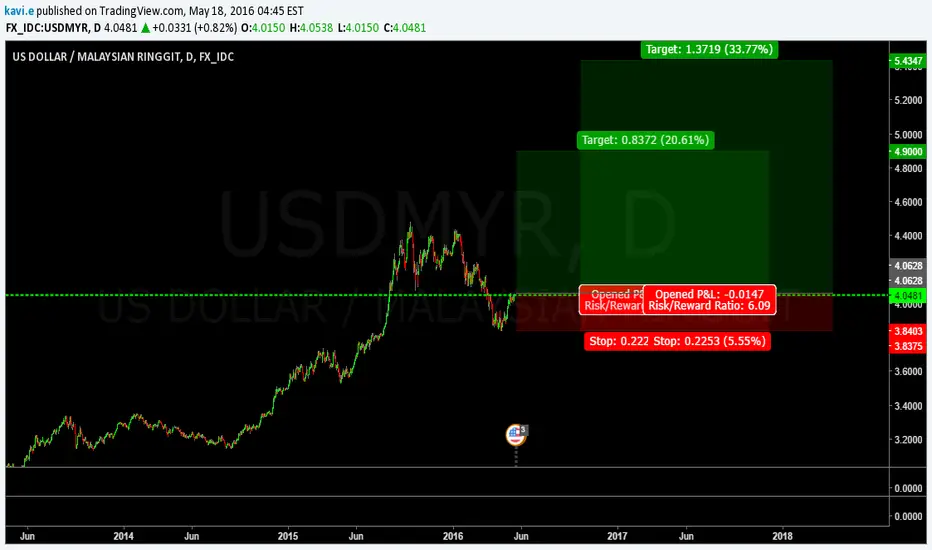
LONG IN USDMYRAFTER FOMC MEETING, IT IS LIKELY THAT THE FED WILL INCREASE THE FED FUNDS RATE IN JUNE, WHETHER OR NOT THE FOMC WILL ACTUALLY DO, THE MARKET'S EXPECTATION IS THAT IT IS HIGHER CHANCE FOR THE FED TO RAISE THE RATES, SO BUY LOW COULD BE AN OPTIMAL CHOICE, AT LEAST UNTIL EARLY OF JUNE, THEN WE COULD WAIT AND SEE THE OUTCOME OF FOMC MEETINGS.
MOREOVER, IF THERE IS SOME RESISTANCE OF WTI OIL PRICE AT THE LEVEL OF 50 USD / BARREL, THEN THE PERFORMANCE OF MYR WILL ALSO BE NOT SO GOOD.
TRADE IDEA:
BUY AT NEAR 4.0596
SL NEAR 4.02
TP1 4.1624
TP2 4.2414

USDMYR Wave 4 of Wave CWave 4 of Wave c will be completed around 4.1257 and Wave 5 of Wave C will be completed around 3.9911. Then new wave start.

USDMYR RetracementUSDMYR is at retracement place. Will it be retrace to 61.8% or 76.4%?
Wait for W12345 to complete.

USDMYR, DUSDMYR is at the retracement. But price resistance at 4.399 to 4.435 and support at 4.098 and 4.102. Price action is at flat, no major. We see the trend when price action break the resistance and support line. However MACD (18,30,15) shows signal lines are crossed and histogram is positive. Price action has change to move up few hundred pips. Then price action will move down again.
