USDNOKOn the monthly charts we have a confirmed bearish trend with a bullish correction in play.
On the weekly charts we have a shift in order flow confirming our bearish bias though its a long term view. We have an impulsive bearish move that has necessitated a bullish correction to clear previous disequilibrium.
The break in daily structure confirms shift in order flow from bullish to bearish. Presently we are bearish, in consonance with our monthly and weekly view.
USDNOK trade ideas

USD/NOK- Bullish Reversal- Double Bottom -Week 5USD/NOK- Bullish Reversal- Double Bottom -Week 5
Pair: USD/NOK
🟢 Technical Pattern: Double Bottom
🟢 Confirmation Signal: Bullish Divergence (on RSI/MACD)
🟢 Market Bias: Trend Reversal – Bearish ➡ Bullish

USDNOK - US Dollar / Norwegian Krone (Daily chart, OANDA)USDNOK - United States Dollar / Norwegian Krone (Daily chart, OANDA) - Short Position; Short-term research idea.
Risk assessment: Medium {support structure integrity risk}
Risk/Reward ratio ~ 2
Current Market Price (CMP) ~ 10.31500
Entry limit ~ 10.30000 on May 06, 2025
Target limit ~ 10.50000 (+1.94%)
Stop order limit ~ 10.18000 (-1.17%)
Disclaimer: Investments in securities markets are subject to market risks. All information presented in this group is strictly for reference and personal study purposes only and is not a recommendation and/or a solicitation to act upon under any interpretation of the letter.
LEGEND:
{curly brackets} = observations
= important updates
(parentheses) = information
~ tilde/approximation = variable value
-hyphen = fixed value

It's Nokkie time !The Norweigan krona is T'ing up a major long term breakout vs the US dollar
NOK/USD (Nokkie) broke out but saw a sharp whipsaw lower
Now it's back re-testing the highs
Thoughts?

usdnoki will like to see incoming of buyers, price has reacted to my expected zone, and give confirmation to buy. so any opportunity to join the buy again. i will do buy

usdnok short position trade outlookgoing based off support and resistance, trends , harmonic pterns. it looks what seems to be going to the downside. chart is disected from 3moonth to 1 month to 1 week. what do you guys see?

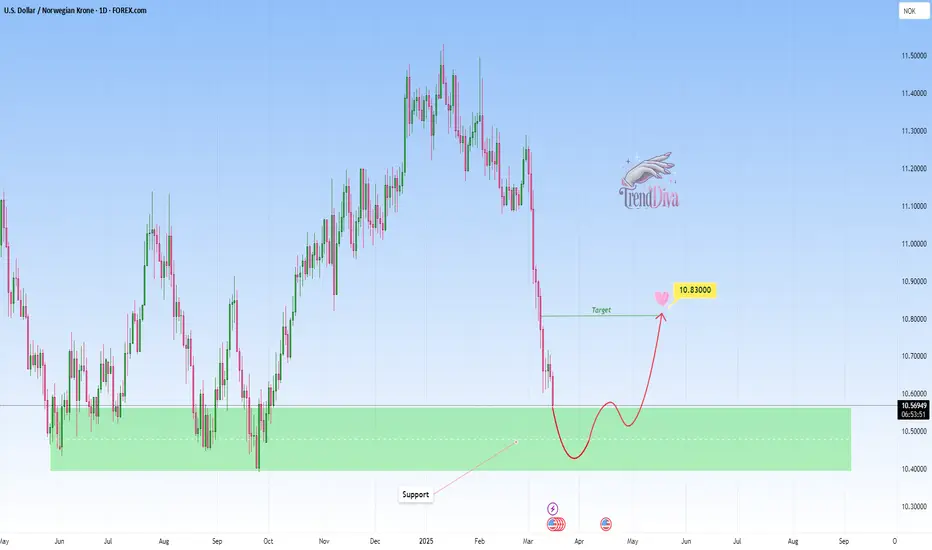
USDNOK - Buy opportunity towards 10,8300?OANDA:USDNOK is testing a clear support area, marked by previous bullish reversals and strong buyer interest. The recent bearish move into this zone suggests a potential buying opportunity if buyers confirm control.
If bullish signals, such as strong rejection wicks or bullish candlestick patterns, emerge, I anticipate an upward move toward 10,8300. If the support fails to hold however, further downside could be expected.
Remember, always confirm your setups and trade with solid risk management.
USD/NOK Long Trade Idea –Potential Reversal from Channel SupportOverview
This analysis presents a long trade setup for the USD/NOK currency pair based on the price action within an ascending parallel channel on the daily timeframe. The market is currently testing the lower boundary of the channel, suggesting a potential buying opportunity for a reversal towards higher levels.
Technical Analysis
1. Price Channel & Key Levels
The USD/NOK pair has been trending upwards within a rising channel, forming consistent higher highs and higher lows.
Current price: 10.6387, nearing the lower trendline support of the channel.
The upper resistance of the channel aligns near 11.17, making it a potential price target.
A stop-loss level is placed below the channel at 10.43, limiting downside risk.
2. Indicators Confirm Oversold Conditions
Stochastic Momentum Index (SMI): The SMI shows a sharp decline, entering an oversold region, indicating potential bullish momentum soon.
Relative Strength Index (RSI): The RSI is at 21.93, an extremely oversold level, suggesting a possible reversal in the coming sessions.
Trade Plan
Entry: Around 10.63, near the lower boundary of the channel.
Target (Take Profit - TP): 11.17, aligned with the upper trendline.
Stop-Loss (SL): 10.43, below recent lows.
Risk-Reward Ratio: Approximately 2:1, making this a favorable setup.
Conclusion
USD/NOK is currently at a key support level within a well-defined ascending trend channel. Oversold indicators and strong historical price action at this level suggest a bullish reversal is likely. This long position setup provides an excellent opportunity for traders looking to capture the next move towards 11.17, with a defined risk at 10.43.


USDNOKHello guys its been a while since i made a post. This is my first post in 2025. i hope it finds you well. I have compiled a long term analysis for wave 1 to 5. Now we are in wave 5, the last lag to the upside.


usdnok go longOANDA:USDNOK
conclusion
monthly -down
weakly- down
daily - retracenent entry
only confirmation entry.no blindly entry confirm stoploss hit

Market Outlook: Bullish Flag and Bearish Shark Patterns in FocusPEPPERSTONE:USDNOK
Key Technical Levels for USDNOK
Weekly Fractal Resistance: 11.47
Daily Fractal Support: 11.21
Monthly Fractal Support: 10.38 (formed in late September)
Breakout Resistance (December 2024): 11.13
These levels have been pivotal in guiding the pair’s movements, and it’s essential to keep an eye on them for future developments.
Bullish Flag Pattern in Play
One of the more notable formations in the current chart is the bullish flag pattern. This pattern suggests that the pair could see further upward movement, in line with the broader positive trend that has been in place since the formation of the monthly fractal support at 10.38 back in September.
The bullish flag pattern typically indicates that the market is taking a breather before continuing in the direction of the prior trend. In this case, the recent pullback to 11.21 (daily fractal support) could be setting the stage for a further rise toward the 11.47 resistance level, or even beyond it, if momentum continues to build.
Bearish Shark Pattern Projection
While the bullish outlook is present, traders should also be cautious of the emerging bearish shark pattern. This pattern, which began taking shape after the breakout above the monthly fractal resistance at 11.13 in December, projects a potential reversal at the 11.56 level, which coincides with the 224% Fibonacci extension.
Bearish Shark Pattern Implications
If the price reaches 11.56, this could signal a reversal and the start of a downward move.
A pullback could occur, testing the monthly fractal resistance at 11.13 or possibly even moving lower to 10.97, which is considered the default target for the bearish shark pattern.
Given the current position of the pair and the technical levels in play, it's important to be prepared for both bullish and bearish scenarios in the near term.
Happy Trading,
André

$USDNOK hitting 12 in 2025?Will the recent breakout in USDNOK give one final thrust to 12 in the coming year?

usdnokUSDNOK closed above its downtrend for the first time since May 2023. It also broke the downtrend channel it had been holding since April. I expect a serious rise after the retest.

USDNOK false breakout leading to breakdown?Intraday Update: The USDNOK slammed back to the 10.90's as the Norges CB kept rates unchanged today. As other central banks (like the BOE just minutes ago cutting rates) this has allowed the USDNOK to break back below 11.00. The 11.1500 is shaping up as key resistance and stops below the 10.9000 should be building.

USDNOK at key resistance today Intraday Update: End of month flows has take the USDNOK back above the 11.00 level, but in order to get above triangle resistance we will need to get past the elections, or perhaps a blowout NFP tomorrow. Bulls should take note of this long term triangle resistance.

Why Nailing the Perfect Entry Won't Make You a Winning TraderWhen I first started trading, I spent an absurd amount of time obsessing over the “perfect entry.” I believed if I could just pinpoint the exact right moment to enter, my trades would take off like clockwork. I’d spot my pattern, line up my indicators, and wait for that split-second trigger. But as my journey evolved, I found that success in trading hinges far more on how you exit than on the entry itself.
Aggressive Entries: Simple and Straightforward
Let’s be clear—there is no “perfect entry,” no mythical timing trick that’ll guarantee success. Aggressive entries, for example, are straightforward: you spot the trigger candle, recognize the pattern, and take action at the close. That’s it. No endless analysis or hesitation, just decisive entry. This type of entry is powerful because it’s intentional, capturing the setup in real time rather than waiting for confirmation that could lead to a delayed entry.
While aggressive entries get you in at an ideal price, focusing on entry alone doesn’t cover the full picture of trade management. Without a plan for managing the trade after entry, you’re just hoping the market follows through—and hope is not a strategy.
Exits Matter More Than the Entry
Successful traders don’t just focus on getting in; they put more thought into getting out. If the goal is to grow and protect capital, then exits are the difference between locking in profit or watching it evaporate. After countless hours in the market, I learned that getting the exit right, or at least having a disciplined exit plan, is what shapes your profit curve.
For example, some traders aim for a certain percentage of profit or wait for the price to hit a key level. Others may use stop-loss strategies to protect gains by trailing the stop along the way. The exit strategy you choose is personal, but having one at all is non-negotiable. Think of it this way: without a solid exit plan, even a perfect entry is likely to unravel at some point.
Practical Tips for Developing a Strong Exit Strategy
Define Your Exit Before You Enter: Every trade should begin with a clearly defined exit plan. Before you even click “buy,” know exactly where you’ll exit for both a win and a loss. Setting realistic profit targets and stop losses not only protects you from over-trading but also keeps you focused on executing your plan.
Set Alerts and Automate: Using tools like TradingView’s alert feature is a lifesaver. Alerts allow you to step away from the charts without stressing over every price movement. Let’s be real—the market can be a hypnotic place, and constantly watching it can lead to impulsive decisions. Set your alerts and detach; you don’t need to be glued to your screen for every tick.
Use Incremental Exits: Instead of going all in or all out, consider taking partial profits at different stages of the move. For instance, you might exit half your position at a certain level and let the rest ride to maximize your gains. This approach allows you to capture profit while giving the remaining position room to potentially yield a larger win.
Review and Refine Your Exits: One of the best ways to improve your exit strategy is to backtest it. Use TradingView’s replay feature to “replay” past market conditions and test out various exit strategies. This is invaluable as it gives you a chance to fine-tune your approach based on actual data, not just theoretical setups.
Create Realistic Expectations: The reality of trading is that the market doesn’t always move according to plan. Stay flexible. Some trades might require a quick exit, while others might reward you for holding on. Don’t be afraid to adapt based on the conditions and price action unfolding in front of you.
Why Traders Fail Without an Exit Plan
For many traders, focusing solely on entries becomes a crutch. They mistakenly believe that if they just find the right entry, the trade will manage itself. But the market is unpredictable. Even the best entry can’t secure a win if the trader doesn’t know how to get out.
The hard truth is, obsessing over entries often masks a lack of strategy or confidence in the bigger picture. I’ve seen traders who hit excellent entries repeatedly, but without disciplined exits, they end up handing their profits back to the market. Don’t let your gains evaporate because you didn’t think about your way out.
Trading Success Is Built on Execution, Not Perfection
In the end, what separates successful traders from the rest isn’t a “perfect entry.” It’s a systematic approach to execution. The best traders don’t need flawless timing—they need consistency, discipline, and a clear plan that includes both entries and exits.
So, next time you’re studying a chart, ask yourself not just “Where would I enter?” but also, “Where and how would I exit?” It’s the exit, not the entry, that ultimately decides how much you keep—or give back—to the market.
So, how do you handle exits? Are you still chasing perfect entries, or have you found a balance? Share your strategy below—your insights might be just what another trader needs.

USDNOK-NEUTRAL SELL 6-hourly chart Heikin AshiThe pair is quiet and narrow ranges. The overall picture looks towards moving south, even though we have positive SMI and stochastic, but a slightly overbought RSI.
Strategy SELL @ 10.6500-10.6950 and take profit below 10.5350 for now. SL based on personal risk appetite.

USD BULLS are back and buying. Buy USDNOK
This Daily Chart of USD NOK shows the turnaround today of more buying of the Greenback across the currency's.
1HR Chart below:

USDNOK Very strong buy signal medium-term.The USDNOK has been consistently giving us excellent signals on this 2-year pattern with the last one (July 10, see chart below) being a buy that hit the 11.0000 Target:
This time the pair is again inside the 2-year Higher Lows Zone, while holding Support 1. The previous High was rejected on Resistance 1, so the Triangle may be transitioning into a Rectangle medium-term.
In any case, this low price is a buy opportunity with our Target being slightly below the Lower Highs trend-line at 10.9500.
-------------------------------------------------------------------------------
** Please LIKE 👍, FOLLOW ✅, SHARE 🙌 and COMMENT ✍ if you enjoy this idea! Also share your ideas and charts in the comments section below! This is best way to keep it relevant, support us, keep the content here free and allow the idea to reach as many people as possible. **
-------------------------------------------------------------------------------
💸💸💸💸💸💸
👇 👇 👇 👇 👇 👇

Trade Signal: USDNOK Movement PredictionDirection: Sell
Enter Price: 10.4871
Take Profit: 10.40032667
Stop Loss: 10.61061667
We recommend entering a sell position for the USDNOK currency pair at 10.4871. The target take profit is set at 10.40032667, with a stop loss at 10.61061667.
This forecast is made utilizing the EASY Quantum Ai strategy, which evaluates market conditions based on several critical factors:
1. Technical Analysis: The pair has been showing downward momentum as indicated by the moving averages and RSI data. This downward trend presents an opportunity to capitalize on further declines.
2. Macroeconomic Factors: Recent economic data from the United States shows weaker-than-expected growth, while Norway’s economic fundamentals remain stable, thus exerting downward pressure on USDNOK.
3. Sentiment Analysis: Market sentiment currently favors the Norwegian Krone, and investor confidence in the USD appears to be waning, contributing to the anticipated further decline.
4. Geopolitical Factors: Any potential geopolitical tensions impacting the USD could further intensify the downward movement of the USDNOK currency pair.
Based on these factors, our EASY Quantum Ai strategy strongly suggests a sell position. Always remember to monitor the trade and adjust stop loss and take profit levels as needed to manage risk effectively.
Happy Trading!
