LNG and Weather Factors: We Expect Moderate Storage IncreaseThe natural gas market enters Week 31 with a sense of equilibrium, as prices hold steady and storage levels continue to climb. The expiration of Contract Q aligned with the 15-year median, while Contract U trades near the median, and 2025 fall contracts remain within the interquartile range, slightly above median levels. However, Winter 2026-27 contracts persist above the upper quartile, hinting at lingering supply and weather concerns. A projected 39 BCF storage increase for Week 30 (July 21-27) keeps inventories above the five-year median, supported by robust injection rates. Yet, a sharp rise in the supply-demand differential, driven by increased power generation and industrial consumption, signals evolving market dynamics as LNG exports dip. Weather stabilization and regional trends further shape this outlook, which we explore in detail below.
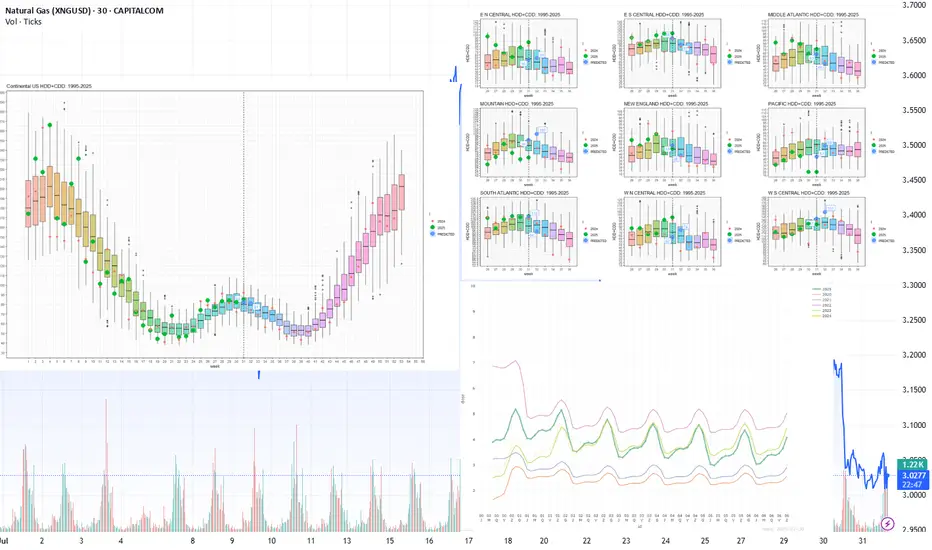
Current prices compared to price dispersion 10 days before expiration by month since 2010
The expiration of contract Q was in line with the median for the last 15 years. Contract U is trading close to the median. The prices of subsequent contracts have not changed significantly. The 2025 fall contracts are trading slightly above the median values on the expiration date, while remaining within the interquartile range. The 2026 and 2027 winter contracts continue to be above the upper quartile.
Forward curve compared to 2020-2024
(Lower graph on the right)
Despite the fact that prices for 2025 contracts with delivery in three years have approached the levels of similar contracts for 2023 and 2024, there remains a pronounced skew in the forward curve in segments with the nearest (1–2 years) and most distant (5–6 years) deliveries.
Current stocks and forecast for next week compared to 2019-2024
For week 30 (July 21-27), we expect an increase in storage of 39 BCF. The fill rate remains firmly above the median for the previous five years. Injection rates are maintaining positive momentum. If the current supply and demand conditions remain unchanged, peak levels similar to those seen in 2024 are possible. Weather and seasonal phenomena in the second half of summer and early fall remain a limiting factor.
Weekly HDD+CDD total based on current NOAA data and forecast for the next two weeks compared to 1994-2024
In the current week 31, despite expectations of HDD+CDD growth, the weather stabilized and reached the 30-year median. The following week (32) is forecast to be at the median level. The seasonal peak in weather has practically passed, and a decrease in HDD+CDD values is expected going forward.
(The graph on the left)
Explanation of the graph: the candles represent quantiles for 30 years from 1994 to 2024. Red dots represent 2024, green dots represent 2025, and blue dots represent the 2025 forecast.
Weekly HDD+CDD total based on current NOAA data and forecast for the next two weeks compared to 1994-2024 by region
(The graph at top right)
Looking at the regional breakdown, we can see moderate HDD+CDD levels in weeks 31-32 in virtually all regions except WS CENTRAL and MOUNTAIN.
Weekly total supply/demand difference compared to 2014-2024
In the current 31st week, the difference between supply and demand rose sharply above the median. With a slight decline in LNG exports, consumption for power generation and industrial production rose sharply.
USDNTG trade ideas
XNGUSD CONTINUES ITS DOWNWARD TREND. FOR HOW LONG?XNGUSD CONTINUES ITS DOWNWARD TREND. FOR HOW LONG?
Recent bearish impulse started at the beginning of this week may come to an end soon. Yesterday the U.S. Natural Gas Storage report came out. Numbers appeared to be lower than expected and lower than previous. (23b vs 28b vs 46b). This is bullish signal for the market participants. Minutes after the report came out, market reacted bullish, however, soon price went sideways.
Right now gas prices continue to decline. Still, the opportunity for short-sellers here is quite limited. Not so far below there is a level of 3.0000, form where I expect the price to rebound, supposedly to a 3.3000.
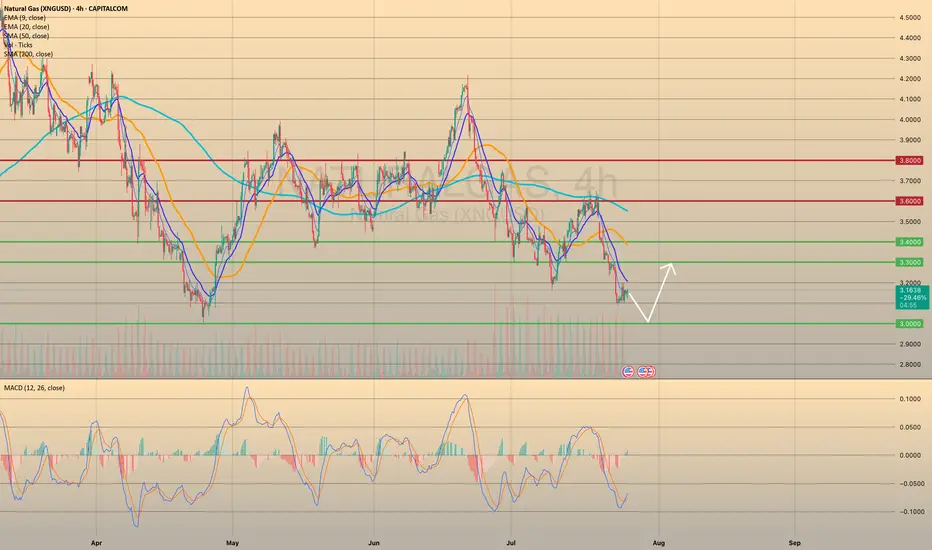
NATURAL GAS REACHED THE KEY SUPPORT LEVEL. WHERE TO GO NEXT?NATURAL GAS REACHED THE KEY SUPPORT LEVEL. WHERE TO GO NEXT?
XNGUSD has come to a crucial support level of 3.0000. Although the sentiment here stays as quite bearish (seasonally, August is not the perfect month for natgas buyers), we expect the price to rebound from the level of 3.0000 towards 3.3000 first. Afterwards, the continuation of bearish trend is expected with final target of 2.6000 before cold season beginning.

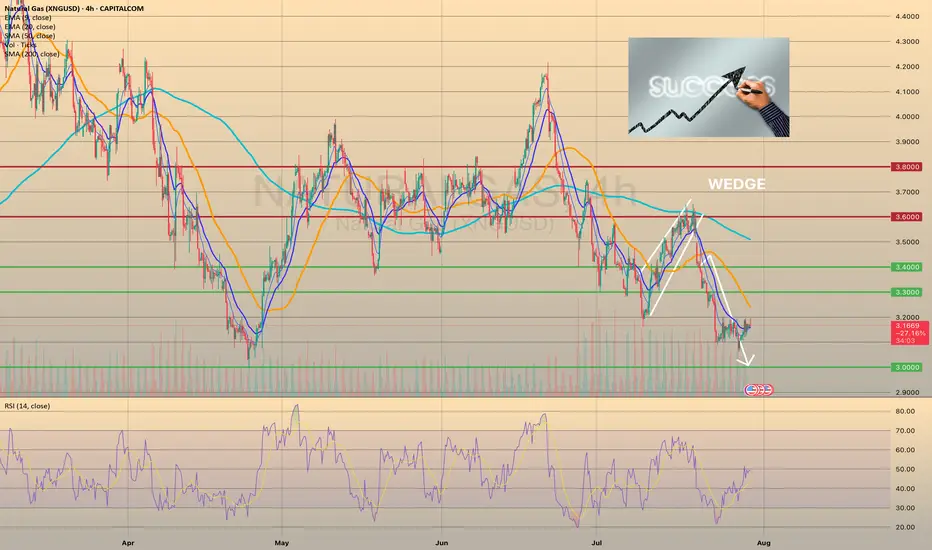
Wedge Pattern — A Key to Trend Movements📐 Wedge Pattern — A Key to Trend Movements 📈
🔍 Introduction
The Wedge is a chart pattern that represents a phase of directional consolidation following a trending move. It can act as a continuation 🔄 or a reversal 🔃 signal, depending on the context. The structure consists of two converging trendlines, both sloping in the same direction.
🧩 Pattern Description
Unlike the Flag pattern 🚩, the Wedge has no flagpole and doesn’t depend on the direction of the previous move. The direction of the wedge body determines its type:
A falling wedge ⬇️ is bullish 🟢 (buy signal)
A rising wedge ⬆️ is bearish 🔴 (sell signal)
The breakout is the key point to watch. The two trendlines slope in the same direction but at different angles, causing them to converge. This reflects a loss of momentum ⚠️ and typically indicates that buyers or sellers are preparing to take control.
This pattern can act as:
A continuation signal 🧭 — appearing at the end of a correction
A reversal signal 🔄 — forming at the end of a strong trend
📉 Volume is usually low during the wedge and rises on breakout. A low-volume breakout increases the risk of a false breakout ❗. Often, price retests the breakout level 🔁, giving traders a second chance to enter.
🎯 Entry & Stop-Loss Strategy
📥 Entry: On breakout confirmation
🛑 Stop-loss: Below the pattern’s low (bullish) or above its high (bearish), or under/above the most recent local swing point
🎯 Target: Project the height of the widest part of the wedge from the breakout point. Alternatively, use key price levels 📊 or a trailing stop 🔂 to lock in profits.
💡 My Pro Tips for Trading the Wedge
✅ Pattern Criteria
Two converging trendlines ➡️➕➡️
Clearly defined structure ✏️
Prior trending move before the wedge 🚀
Low volume within the wedge 📉, high volume on breakout 📈
Retest of breakout level = confirmation 🔁
🔥 Factors That Strengthen the Signal
Breakout on strong volume 📊💥
Appears after an extended trend 🧭📉📈
More touches = stronger pattern ✍️
Breakout occurs close to the apex 🎯
⚠️ Factors That Weaken the Signal
Low volume on breakout 😐
Poorly defined trendlines 🫥
Few touches on lines
Early breakout (too far from apex) ⏱️
No prior trend / appears in a range-bound market 📏
✅ Examples of My Successful Wedge Trades
📸
❌Examples of Failed Wedge Overview
💥
💬 Do you use the wedge pattern in your trading?
It’s a powerful pattern, especially when confirmed by volume and market structure. Share your favorite wedge setups or ask questions below 👇👇
Natural Gas is in the Buying DirectionHello Traders
In This Chart NATGAS HOURLY Forex Forecast By FOREX PLANET
today NATGAS analysis 👆
🟢This Chart includes_ (NATGAS market update)
🟢What is The Next Opportunity on NATGAS Market
🟢how to Enter to the Valid Entry With Assurance Profit
This CHART is For Trader's that Want to Improve Their Technical Analysis Skills and Their Trading By Understanding How To Analyze The Market Using Multiple Timeframes and Understanding The Bigger Picture on the Charts

NATGAS: When Triangles Go FlatGAZ is acting up again! Had to bail and re-enter. Just playing the trend and indicators.
Instead of forming a clean wedge, it’s just chopping sideways now. Though the wedge pattern could still play out.
LNG Outlook: Supply-Demand Differential Dropped Below the MedianThis analysis was prepared by Dr. Igor Isaev in cooperation with Anastasia Volkova, LSE analyst.
Current prices vs. price spread 10 days before expiration by month since 2010
(The top left graph)
Contract U is trading at the same level as the average price 10 days before expiration for all expired contracts over the previous 15 years. The futures prices of the Fall 2025 contracts are trading even closer to the median values on the expiration date, while remaining within the interquartile range. Prices of the 2026 and 2027 Winter contracts are declining but have not yet broken through the upper quartile values.
Current forward curve vs. 2020-2024
(The top graph in the middle)
Although the 3-year delivery contract prices as of 2025 have approached the levels of similar 2023 and 2024 contracts, a pronounced forward curve skew remains in the near-term (1-2 years) and distant (5-6 years) delivery segments.
Current inventory and forecast for next week compared to 2019-2024
(The top right graph)
For week 31 (July 28 —August 03), we expect a +16 BCF gain in storage. The fill rate is confidently holding above the median for the preceding 5 years. Injection rates maintain positive dynamics. If the current supply and demand balance stabilizes, reaching levels similar to 2024 peak values is possible. The weather and seasonal phenomena of late summer — early fall remain a restraining factor.
Weekly HDD+CDD total from current NOAA data and forecast for the next two weeks comparing 1994-2024
(The lower left graph)
In the current, 32nd week, the weather is holding steady, reflecting the average values from observations over the past 30 years. Although the seasonal peak HDD+CDD has almost passed, next week (33) is forecast to have significantly above average HDD+CDD values.
Explanation of the chart: candles represent quantiles for 30 years from 1994 to 2024. Red dots 2024, green 2025, blue prediction 2025.
Weekly HDD+CDD total from current NOAA data and forecast for the next two weeks compared to 1994-2024 by region
(The lower graph in the middle)
Looking by region, we see elevated HDD+CDD at week 33 in almost all regions.
Weekly cumulative supply/demand differentials compared to 2014-2024
(The lower right graph)
In the current 32nd week, the supply-demand differential has fallen below the median, almost to the edge of the lower interquartile range. On the demand side, we see a strong decline in consumption by power generation and a recovery in LNG exports. On the supply side, production continues to grow, but imports from Canada have dropped.

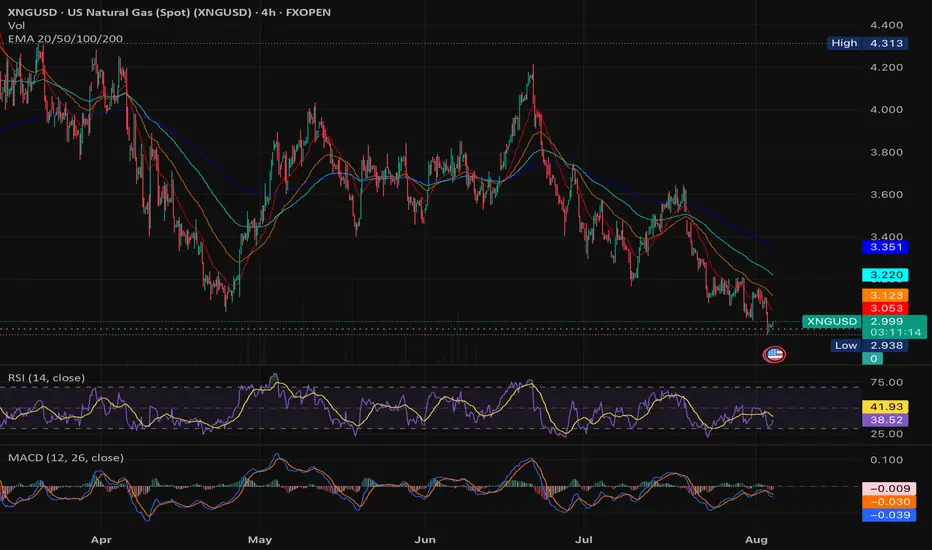
Supply surplus pressure XNG price despite demand increaseFundamental:
Natural gas (XNGUSD) continued its decline, driven by high storage levels and surplus supply. Despite a 6.8% increase in demand for the week ending 30 Jul, the daily average supply surplus remained at 3.6 bln cubic feet, boosting underground working storage capacity to near the five-year average high. The persistent supply surplus could exert further downward pressure on natural gas prices.
Technical:
The price remains within the descending channel. Unless broken decisively, trend favors lower prices.
If the RSI hits oversold and the price breaks $2.91, the next target could be testing the long-term support at $1.85.
Reversal would require a break and close above the descending channel and above clustered EMAs, ideally crossing $3.07 (EMA50) and $3.16 (EMA100).
MACD bullish cross with RSI rising above 50 would confirm a potential upward momentum.
Price may oscillate between current support ($2.91) and resistance ($3.16-$3.30) if volume and volatility remain low, consolidating before the next major move.
Bearish forcast On Naturalgas Keypoints -
1. +48 Bcf EIA storage build beat forecasts and the 5-year average, signaling excess supply
2.U.S. dry gas production hit 108.1 Bcf/day
3.The next major downside level will be at $2.574. With fundamentals pointing to an oversupplied market and only short-term weather demand offering support, near-term sentiment remains bearish.

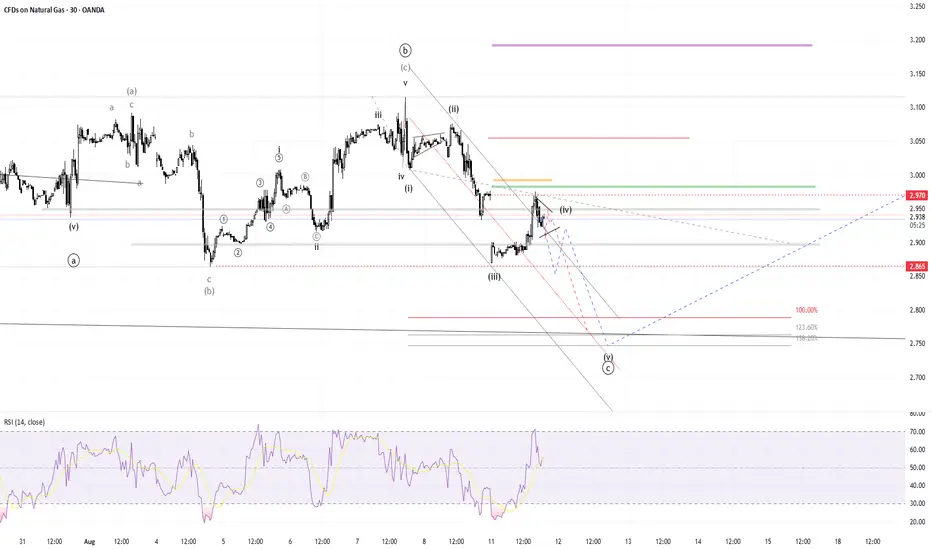
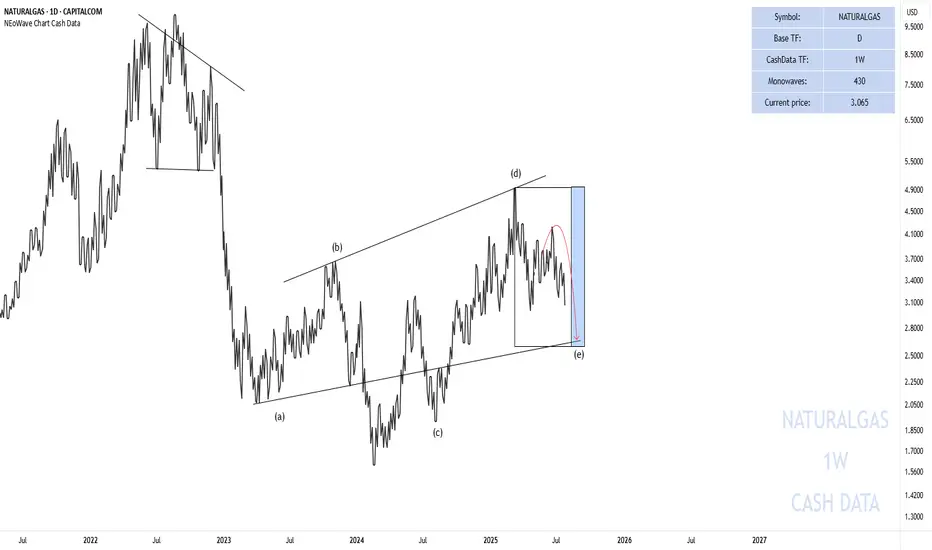
End of the Wave-(e) Natural Gas
In the previous analysis I said that:
Currently, wave-(e) is forming and I do not expect a strong upward movement until August 12-September 12 and this wave can take time until the time range I specified for it.
In the picture you can see that the price has started to decline again exactly from where we specified and has fallen by 27% so far. The price is not necessarily going to fall to 2.66 but time must pass and the price must enter the specified time range.
Good luck
NEoWave Chart
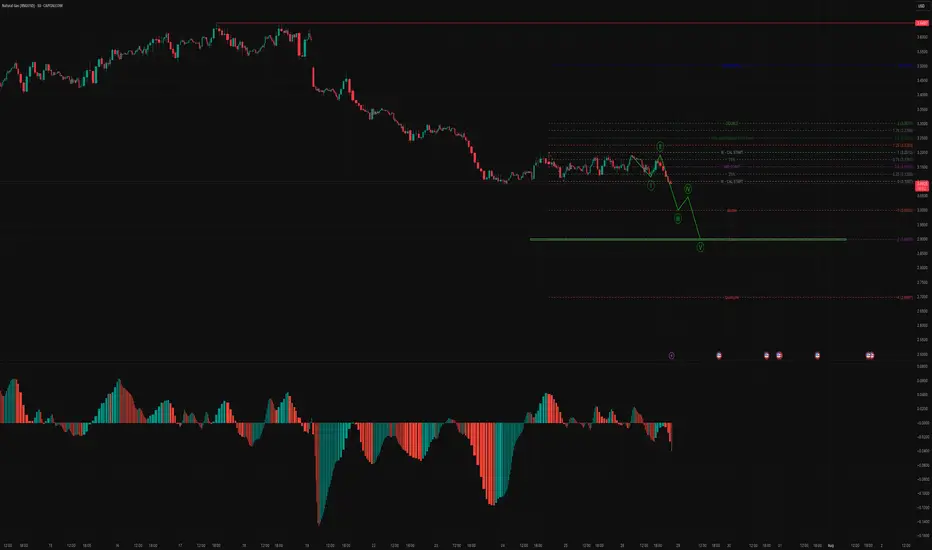
The technical analysis for Natural Gas (NG) 📉 Current Market Structure & Interpretation
🟢 Elliott Wave Count (Bearish Impulse in Progress)
The chart suggests a 1-2-3-4-5 impulsive wave is unfolding on the downside.
Currently, NG appears to have completed Wave 2 (retracement) and Wave 3 is in progress, heading toward a major breakdown.
The structure projects Wave 3 → Wave 4 pullback → Wave 5 final leg.
🔍 Fibonacci & Key Levels (Bearish Projections)
Wave 3 Target Zone:
-1.0 Fib Extension (~3.00) marked as "double"
Strong support break zone; high probability breakdown confirmation
Wave 5 Completion Target:
-2.0 Fib Extension (~2.807) highlighted as major support
Also aligns with a long-term base/accumulation zone
Extreme Bearish Target:
-4.23 Fib (~2.687) – only in case of panic sell-off (marked “Quintuple”)
📊 Volume & MACD Histogram (Lower Panel)
Strong bearish momentum in MACD histogram: red bars extending and deepening.
Bearish volume expansion visible during Wave 1 and Wave 3 fall, validating impulsive nature.
No sign of volume divergence yet – supports continuation.
🔄 Retracement & Pullback Zones
Wave 4 likely to pull back between:
0.25–0.382 retracement of Wave 3
Could test the area around 3.04–3.08, before turning back down
⚠️ Invalidation & Risk Level
If price breaks above 3.13–3.16 (0.618 level of the total fall), wave count may get invalidated.
Otherwise, structure remains bearish.
🎯 Short-Term Trade Plan (Bias: Bearish)
Aspect Details
Entry Zone Any pullback near 3.04–3.08 (Wave 4 zone)
Target 1 3.00 (Wave 3 completion)
Target 2 2.807 (Wave 5 final target)
SL/Invalidation Above 3.13–3.16
Trade Type Short / Put Option / Futures Sell
Bias Intraday to Short-Term Positional
✅ Conclusion
The chart shows a well-structured Elliott bearish impulse, currently in progress with strong downside momentum. Expect further continuation toward 2.80 zone, barring any invalidation above 3.13. The Fibonacci confluence and momentum support this outlook.
Disclaimer:
This analysis is for educational and informational purposes only and should not be considered as financial or investment advice. Trading in commodities, options, and futures involves substantial risk and may not be suitable for all investors. Always conduct your own research and consult with a qualified financial advisor before making any trading decisions. The author or publisher is not responsible for any losses incurred from trading decisions based on this analysis.
Natural Gas is in the Buying DirectionHello Traders
In This Chart NATGAS HOURLY Forex Forecast By FOREX PLANET
today NATGAS analysis 👆
🟢This Chart includes_ (NATGAS market update)
🟢What is The Next Opportunity on NATGAS Market
🟢how to Enter to the Valid Entry With Assurance Profit
This CHART is For Trader's that Want to Improve Their Technical Analysis Skills and Their Trading By Understanding How To Analyze The Market Using Multiple Timeframes and Understanding The Bigger Picture on the Charts
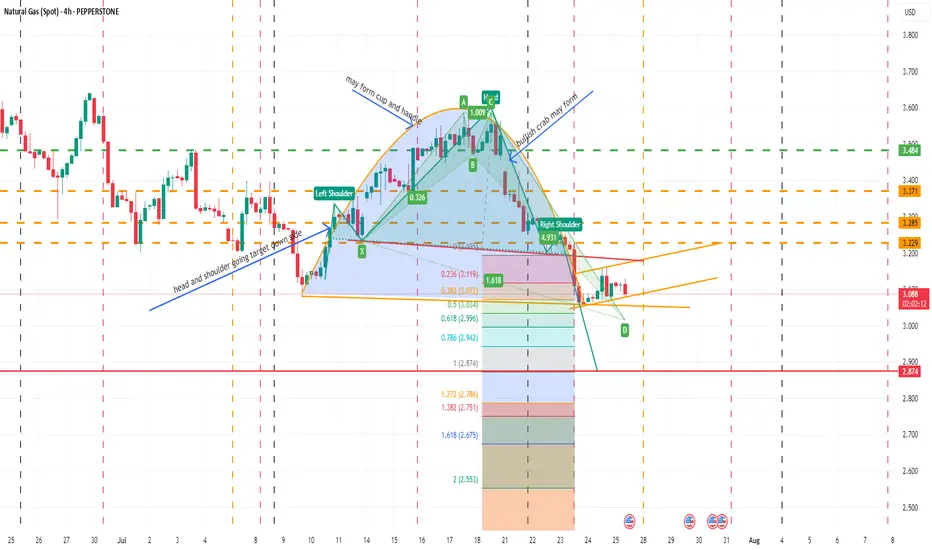
NATURAL GAS SPOTMay form inverse cup and handle, bullish crab also about to form , after completing one head and shoulder pattern already posted earlier new head and shoulder going on. In daily and 4 hr chart below ichimoku cloud. In weekly within cloud. Moving averages showing weakness in daily and weekly, monthly candle also no bearish. May be in such scenario bullish crab pattern may fail but need to be careful as over sold territory. Let see how all works in future though so far all as per analysis. I am not SEBI registered analyst.
Gas Market Expectations: Seasonal Peaks, Storage MomentumNatural gas prices are largely aligned with historical norms, with the Q contract nearing its 15-year median as expiration approaches and summer-autumn 2025 contracts trading slightly above median levels but within the interquartile range. In contrast, winter 2026–27 contracts remain firmly above the upper quartile, pointing to persistent long-term risk pricing. Despite some normalization in 3-year forward pricing, the curve continues to show significant distortions at both short- and long-term horizons. On the fundamentals side, storage is projected to grow by +33 BCF in mid-July, with levels tracking well above the 5-year median. Weather-driven demand has begun to ease nationally, though regional deviations remain (especially in the Central and Mountain areas), highlighting the importance of localized heat trends in shaping market sentiment.
The expiration of the Q contract is approaching. Its price is now very close to the 15-year median on the expiration date. We expect high volatility in the near-term and upcoming U contracts. Prices for subsequent contracts have remained relatively unchanged. Autumn 2025 contracts are trading slightly above their historical median expiration values but remain within the interquartile range. Winter contracts for 2026 and 2027 continue to trade above the upper quartile.
Although 2025 contracts with three-year forward delivery have approached the price levels seen in comparable 2023 and 2024 contracts, the forward curve still shows a significant distortion in both the short-term (1–2 years) and long-term (5–6 years) delivery segments.
For Week 29 (July 14–20), a storage injection of 33 BCF is expected. The storage level remains confidently above the 5-year median. Injection rates continue on a positive trajectory. If the current supply-demand balance holds, peak 2024 levels may be reached. However, weather and seasonal patterns in late summer and early autumn remain a key limiting factor.
In the current Week 30, despite earlier expectations of a rise in HDD+CDD, weather conditions have stabilized around the 30-year median. Week 31 is forecast to be slightly above the median. The seasonal weather peak appears to have passed, with HDD+CDD values expected to decline further.
Looking at regional breakdowns for Week 30, there is a notable drop in HDD+CDD in the MOUNTAIN and PACIFIC regions, and a slight exceedance of the upper quartile in the Central regions. Other regions fall within the interquartile range for Weeks 30–31.
In the current Week 30, the supply-demand difference has dropped below the median. This is primarily due to decreased exports to Mexico and continued growth in domestic production. LNG exports remained stable.

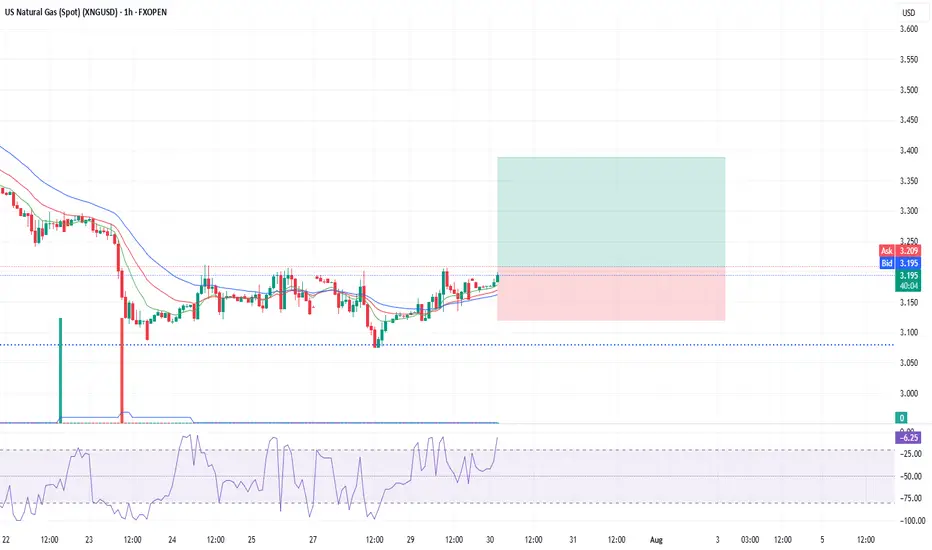
Natural Gas: Long Setup After Healthy PullbackNatural gas has made a decent pullback, and a solid long setup is forming here with a relatively tight stop-loss for gas.
If the stop gets hit, the second entry will be from the $3.00 level.
Entry is from current levels.
📝Trading Plan
Entry: Entry is from current levels.
Stop Loss: 3.0855
Target: 3.36
NATGAS Long Setup – Accumulation + Breakout OpportunityInstrument: US Natural Gas (Spot)
Timeframe: 1D
Published: July 24, 2025
By: @Rendon
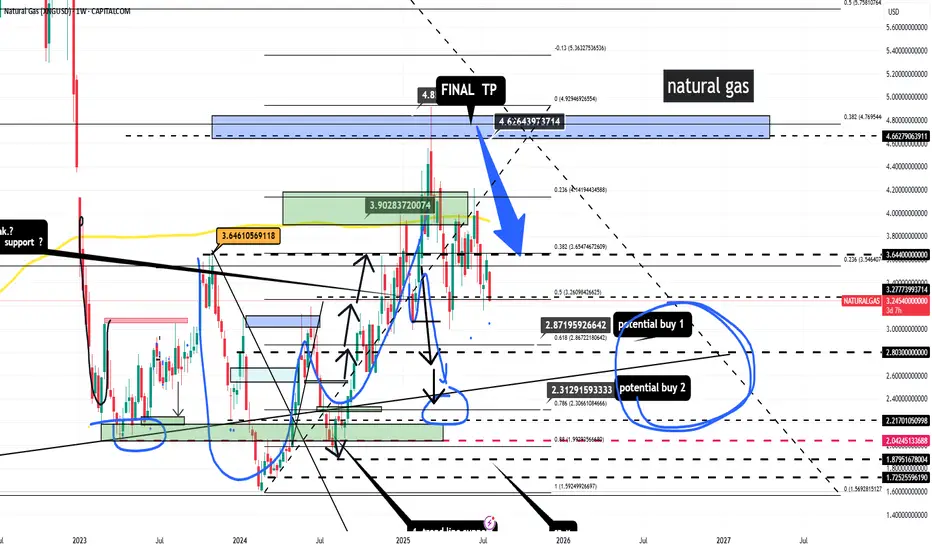
📈 Idea Summary:
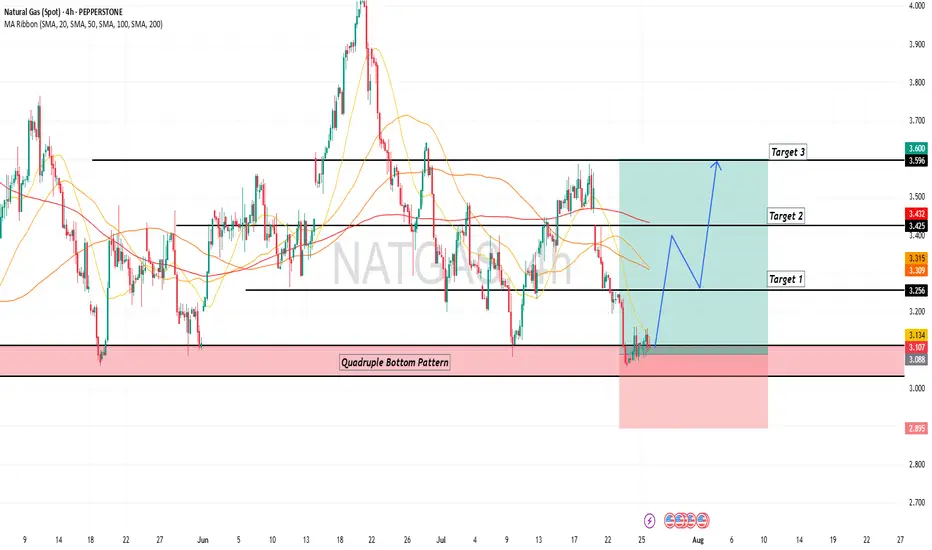
Natural gas is showing signs of accumulation after a corrective downtrend. Price recently tested key horizontal support around $2.96–$2.85 and is now attempting a recovery. Two potential bullish scenarios are outlined:
🧠 Bullish Scenarios:
🔵 Scenario A (blue path): Clean breakout above $3.32 with strong volume could lead to a continued push toward $3.56 → $3.79 → $4.05.
🔴 Scenario B (red path): Price may first retest the $2.96–$2.85 demand zone again before bouncing and gradually rallying toward $4.05.
🔍 Key Levels:
Support: 2.961 / 2.957 / 2.854
Resistance: 3.323 → 3.568 → 3.792 → 4.046
🛑 Invalidation:
A decisive close below $2.84 would invalidate the bullish thesis and suggest further downside risk.
📊 Volume Insight:
Volume has been drying up, which may indicate a potential spring or absorption before a breakout.
✅ Trade Plan (example):
Entry: On retest of $2.95 or break of $3.32
Stop Loss: Below $2.84
Target: First TP at $3.56, then trail toward $4.05
💬 Let me know in the comments how you see NATGAS developing and which path you’re betting on!

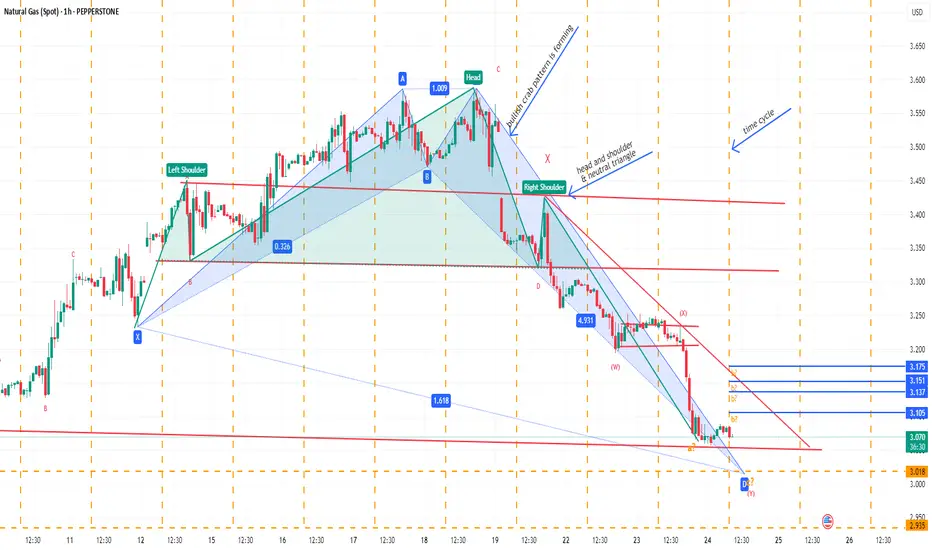
NATURAL GAS SPOTBullish crab pattern may form, if another harmonic pattern may develop later.
Neo wave wise may be in wave Z need confirmation.
Time cycle high low break may be trend continue in break out/down direction.
Not sebi research analyst.
Triple Bottom @ Natural GasNaturalgas is near triple bottom
Best level for accumulation
Pure price action 💯

XNGUSD Technical Update – What the Chart Is Telling Us NowIn this video, I break down the current XNGUSD (Natural Gas) chart using pure price action analysis on the daily timeframe.
This update builds on my previous post, where I shared a comprehensive outlook supported by fundamentals, including supply/demand imbalances, geopolitical risks, and long-term LNG export growth.
In this video, I focus purely on the technical picture—highlighting key levels, market structure, recent consolidation, and where I see potential opportunities unfolding next.
📈 If you're trading or investing in Natural Gas, this is a must-watch update to stay in tune with the current market dynamics.
Remember: This is not financial advice. Always do your own research and manage risk appropriately.

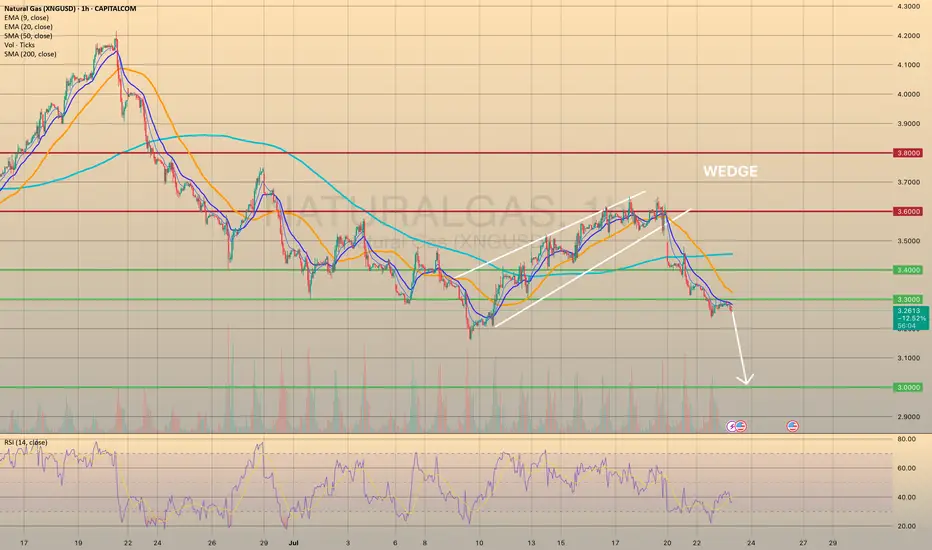
XNGUSD PULLED BACK FROM 3.3000 RESISTANCE LEVEL. WHERE TO GO NEXXNGUSD PULLED BACK FROM 3.3000 RESISTANCE LEVEL. WHERE TO GO NEXT?
This Monday natural gas prices have successfully broken down bearish wedge formation. As we may observe, the price went down through all major support levels, establishing a new short-term bearish trend. Recently the price broke through the 3.3000 and successfully retested it. It is crucial, due to this level is the last mid-term major support before the 3.000.
Additionally, the weather in the vast area U.S. is supposed to be milder at the end of July - beginning of August, which would curb nat-gas demand from electricity providers for air conditioning usage. To sum up, the decline towards 3.000 level is expected.
natural gas xngusd long point
2 buy zone marked on the chart with no stop loss
based on price action
Natural Gas Price Drops by 7%Natural Gas Price Drops by 7%
As the XNG/USD chart shows today, natural gas is trading around $3.333/MMBtu, although yesterday morning the price was approximately 7% higher.
According to Reuters, the decline in gas prices is driven by:
→ Record-high production levels. LSEG reported that average gas output in the Lower 48 rose to 107.2 billion cubic feet per day so far in July, surpassing the previous monthly record of 106.4 billion cubic feet per day set in June.
→ Favourable weather forecasts. Although the peak of summer heat is still anticipated, forecasts indicate that temperatures over the next two weeks may be lower than previously expected.
As a result, today’s XNG/USD chart appears bearish.
Technical Analysis of the XNG/USD Chart
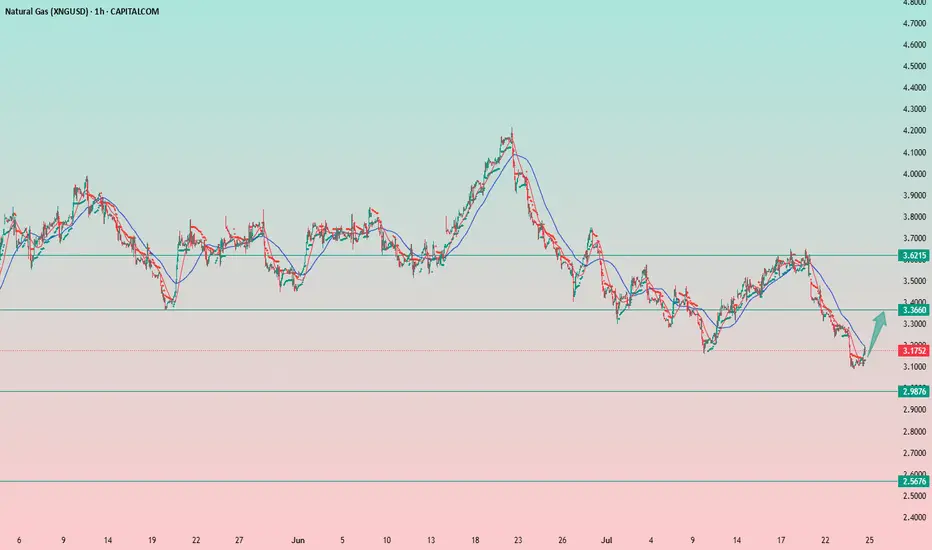
The chart indicates that since mid-May, natural gas prices have been fluctuating within a descending channel (marked in red), with July’s peak (E) highlighting the upper boundary of the pattern.
A key resistance area is now represented by a bearish gap, formed between:
→ the former support level at $3.525;
→ the $3.470 level – which, as the arrow suggests, is already showing signs of acting as resistance.
Under these conditions, it is reasonable to assume that the price may continue forming a downward market structure A-B-C-D-E, consisting of lower highs and lows, potentially moving towards the channel’s median – which approximately corresponds to July’s low (around the $3.200 level).
This article represents the opinion of the Companies operating under the FXOpen brand only. It is not to be construed as an offer, solicitation, or recommendation with respect to products and services provided by the Companies operating under the FXOpen brand, nor is it to be considered financial advice.
