NATGAS - CHANGE OF CHARACTERHello Traders !
The NATGAS price failed to create a new lower low.
Currently, The last lower high (2.543 - 2.592) is broken (change of character)
So, I expect a bullish move📈
----------------
TARGET: 2.728🎯
USDNTG trade ideas

XNGUSD Long (Buy Limit)Entry : 2.748
TP : 3.068 (320 pts)
SL : 2.668 (80 pts)
RR : 1 : 4
Expire : June 12nd, 2024 17:00 (UTC +7)
Warning : This analysis is not trading advice. Always do your own research and manage your financial risk.

NATGAS - Time for a pullback? There is a high possibility we are going down on the GAS
Technicals
1. We closed on a doji on the weekly
2. We have been pumping strong lately, and the charts are screaming for a pullback
3. We came to a key .618 FIB retracement level
4. I see a zone here which can act as a major resistance.
Trade
Looking for a position for a sell this week!.
Great trading all of you
& remember to always trade with caution and a plan :-)
Greetingz,
Simba Trades

Natural Gas: Wild price action!Is natural gas a buy at these levels?
Nat gas is currently digesting its recent rally.
You have to expect the bulls to make another push higher at some point but with todays reversal the bulls may have to wait a bit longer.
Resource stocks took another hit today but still holding near the highs.
Nat gas is still holding above the daily 200 MA.
Price action is oscillating between the .236 Fib & .382 Fib

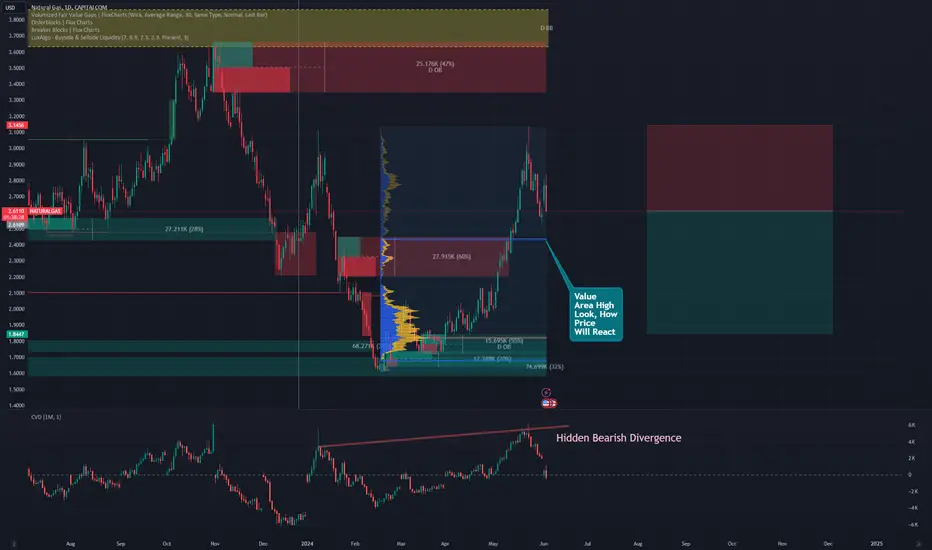
We are dropping - again!NATGAS has shown a remarkable recovery since February 2024. This recovery now appears to have come to an end—at least temporarily. From a technical chart perspective, the recent double top indicates a bleak situation, suggesting further declining prices. A bounce is possible at the high of the Value Area, which is the price range between the February 2024 low and the May 2024 high. Those trading NATGAS short should keep an eye on this price range. However, it is likely that prices will continue to fall towards the February lows.
Natgas - rebound phase - shortI want to be honest..
The rally long was a surprise for me, I expected a long phase but without this momentum.
It was really strange because we have a big storage increase more than last year and I expected a long phase but more flat.
so I think now we can have a rebound of price until support area more or less 2$ before the last long (if we will have).
The doubt if we have close or not the wave C ..
In any case I try a short position with small size and small risk.
Stop 2.8$
target 2$

NATURAL GAS - IMPORTANT BREAKOUT 📉Hello Traders !
The Natural Gas price failed to create a new higher high !
The higher low (2.543 - 2.570) is broken (change of character).
So, I predict a bearish move📉.
--------------
TARGET: 2.230🎯

NaturalGas ABC correctionReject from first line of suport or from second line of support. If price go above and take this zone like support than we can see target like 3.3 or 3.6 in a few candels

Natural Gas long ideaNatural Gas looking very interesting. Going to take a small long position.
THIS IS NOT FINANCIAL ADVICE

Natural Gas feeding the bears!Natural Gas has had a 15% down move since the high pivot reversal.
What's next? The daily 200 MA looks to be flattening out like a nice support level.
If we hold that area I'm looking for a continuation move higher.

Natural Gas Money Heist Plan on Bearish SideMy Dear Robbers / Traders,
This is our master plan to Heist Natural Gas based on Thief Trading style Technical Analysis.. kindly please follow the plan I have mentioned in the chart. Our target is Green Zone that is High risk Dangerous level MA act as a Dynamic Support & Order Block, So the Market is oversold / Consolidation / Trend Reversal at the level Bullish Robbers / Traders gain the strength. Be safe and be careful and Be rich.
Note: If you've got a lot of money you can get out right away otherwise you can join with a swing trade robbers and continue the heist plan,
Loot and escape on the target 🎯 Swing Traders Plz Book the partial sum of money Use Trailing Stop To Protect Looted Money and wait for next breakout of dynamic level / Order Block, Once it is cleared we can continue our heist plan to next new target it will update after the Breakouts.
support our robbery plan we can easily make money & take money 💰💵 Join your hands with US. Loot Everything in this market everyday.


Natural Gas Topping Signal?Natural Gas closed the week with a hard rejection.
A weekly topping tail has been observed this week.
A major reversal off the $3.11 pivot should be marked as major resistance.
Keep your eye on the daily 200 MA to see if this commodity to build a base above this bullish moving average.
Resource stocks lead Nat gas on the way up, look to them for leadership or potential weakness.

Natural Gas Positive economic indicators like the United States GDP Annual Growth Rate can be bullish for natural gas as demand grows with the economy. Conversely, high interest rates in the U.S. can be bearish as they may pressure consumption.
Traders often look at pivot points and support/resistance levels to make informed decisions.
It's important to note that natural gas trading is influenced by a wide range of factors, and prices can change rapidly. For those interested in trading or investing, staying updated with the latest forecasts, news, and technical analysis is crucial for making informed decisions. Always consider consulting with a financial advisor before making any investment decisions.


NATURAL GAS: Bullish- SHARK + WOLFE WAVENATURAL GAS: Bullish- SHARK + WOLFE WAVE
So, regarding gas the Wolf of Zurich detected a "Shark" and a "Wolf Wave" in Daily.
The market could rise violently.
There is a strong divergence on the ROC
Attention!!
The 50 and 200 exponential moving averages are potential targets
There
stay careful

Natural gas on the verge of maturityDear analysts and traders,
I trust this message finds you in good health and high spirits as you prepare to approach the upcoming week with renewed vigor. I extend my best wishes for continued success in all your business pursuits. It is essential to emphasize that sustained success in business hinges significantly on the consistent establishment and adherence to your principles.
As an advocate of the Elliott Wave principle, I regard this methodology as a valuable instrument for market analysis. Over the past three years, I have honed my approach by amalgamating this principle with a meticulous evaluation of diverse market scenarios. I strive to mitigate market uncertainties by upholding a broad spectrum of market perspectives, enabling me to discern market structures with utmost precision.
I am pleased to share my analysis with you, with the disclaimer that I do not offer buy or sell recommendations. My perspective on analytical ideas remains entirely impartial, and if my analysis aligns with your standards, it can serve as a compass for informed decision-making.
I have enclosed my prior analysis of the same market for your perusal and comparison. All aspects of my analysis are clearly delineated for clarity. Nevertheless, familiarity with the Elliott Wave principle theory facilitates comprehension of the analytical concept. I apologize for the repetitive nature of the text, as my week is occupied with formulating analytical and educational ideas, as well as engaging in trading activities and managing my social networks. Due to time constraints, I am unable to provide textual explanations for every idea, hence the inclusion of a separate text alongside the labeling. Should the text be unclear, I am available to elucidate the key points.
My rigorous study of the Elliott Wave Principle spanned nearly three years, during which my grasp and utilization of this invaluable tool evolved. My progress thus far stands as a tribute to the legacy of Ralph Nelson Elliott, whose brilliance underpins my accomplishments. May he rest in peace.
I am grateful for your unwavering support and benevolence, and I eagerly anticipate your feedback and constructive criticism.
May my analysis serve as a valuable asset in your business endeavors, and I remain yours sincerely,
Mr. Nobody
Previous analytical idea

Natgas strong bullsResistance was reached, as indicated on the chart. The bulls demonstrated significant strength following an accumulation phase. It remains to be seen whether they can push prices higher to the next resistance level, around 3.439.

NATGAS at historic lows High risk/reward The NAT GAS is a historical low prices and shows a really high risk/reward opportunity to buy. Good luck!

Natural Gas: Short Squeezing!Natural gas continues to test mean reversion strategies.
This commodity is continuing to burn the shorts.
For a couple weeks now, Nat Gas has been trading at the upper 2.5 deviation band.
This is an extreme overbought signal that often results in profit taking.
Natural Gas Daily RSI is now diverging from price at overbought levels.


