#Natgas UpdateThe diagonal we identified last week has been confirmed. However, its fifth wave taken out the prior low, making some aspects of the previous scenario irrelevant.
In the overall scheme of things, this doesn't change anything other than adding assurance to the scenario with a larger falling diagonal, which we began considering a few weeks ago.
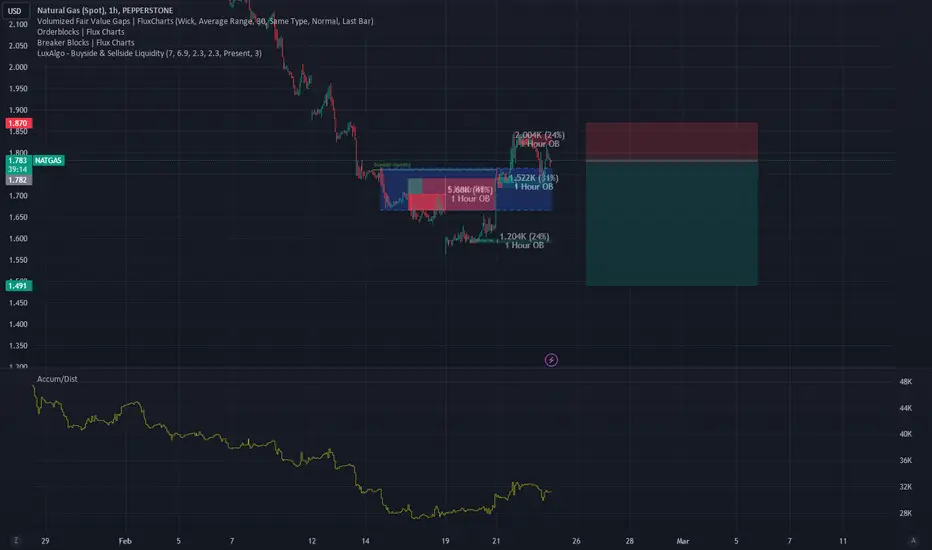
USDNTG trade ideas

SPX / NDX / Oil / Nat GasA quick look at the daily charts of the 4 tickers above.
SPX wonderful rally today.
NDX huge 30 min rally late into the day.
Oil moves higher & bullishly consolidating
Natural Gss looks bearish down here.

NATGAS - Bear's ParadiseThose who enjoy being on the short side of the market currently find their luck in NATGAS. Although there was an impulsive increase on Wednesday, it seems to have been short-lived. Therefore, it is to be expected that NATGAS is embarking on a new bear market rally and recent lows will be undercut once again. After reaching the indicated price target, further recovery can be expected. Only then will it be seen whether NATGAS can recover sustainably or even lower prices are to be expected.
Natural Gas still coiling! breakdown or breakout? Natural Gas is appraoching the apex of a wedge pattern.
The Apex is the very tip of the triangle where 2 trendlines meet.
Price will likely have to make a move by April 3 or sooner.
As for which way will price break is anyones guess, but probabliietes are slightly swaying lower.
Signs of accumulation are being observed in the resource stocks. So a bottom is typically approaching.
DBC EtF has broken out. Nat gas has a small weighting in there.

NATGAS possible scenario As pattern often repeat themselves, natgas operate in his bottom area 1,50 /2,00 and can evolve in this range few times.This recent downfall brought the price down and its a good spot to try long since i can see it pushing up before any more downside. in larger timeframe rsi provide us a bullish divergence and is oversold but i tend to not give too much importance on "oversold" signal on NATGAS who can go lower for eternity...Regarding weather data it seems US will have cooler and slighty under average temperature for next coming weeks, but stock are still almost full. Only rigs cuts, withdrawl storage data and positive earnings reports of major NATGAS company will be able to bring natgas above the psychological price of 2 and make him hold above.

NatGas Update#Natgas The triangle we had projected as an option in the weekend update did not materialise. The price breached the guidelines. Reassembling alternative scenarios leads me to the concept of a diagonal.
I showed the contracting diagonal, which is the most common, but an expanding one is also possible.

buylong term trade setup, trade forecast based on the DIB wave theory enjoy the ride and make sure to use proper trade management,

NatGas UpdateCompared to the forecast we published two weeks ago, the natural gas prediction turned out to be 100% accurate. A comparison of the 1 hour charts is shown below.
Though I was able to accurately predict the exact shape of the recovery from the recent low, I was uneasy about the longer-term outlook.
On daily chart I repeatedly expressed my discomfort with the lack of divergence versus RSI and the lack of ending/terminal patterns on multiple occasions. Now I am reinstating the case with terminating diagonal that I introduced much earlier.
In doing so, the chart will have a more natural appearance and address the issue of the RSI divergence versus the price not being present on the chart yet.
Go to signature for further details.

Historical Trend of NGNG prices goes low in every leap year, According to weekly chart the next low would be 1.4$

NATURAL GAS...BURN BABY BURN!Nat gas continues to show some short term weakness.
Its now shaping up based off an RSI divergence that Nat gas could make new lows.
The fact that we had a bearish crossover of the 7 MA & 20 MA is never a good sign.
Sellers clearly took control over price and forced it back below the neckline.
The 100% downside move of the head & shoulders that triggered over a year ago is about $0.70

GAS is almost ready for the next moveEurope is full with gas, and the winter is soft, and blah blah blah.
Let's see through technical glasses, 0.886 level is strong level, I expect that gas will reach it, mot probably even brake it, and afterwards we seek for golden pocket and 0.5 fib.
Support and resistance, baby!

Natural gas bottom in? Producer PPI came in at 2x anticipated!Here we see a higher low with a bullish engulfing at historic lows, with the catalyst of The Producer Price Index coming in at twice of what was anticipated. It would be nice to let the day close as an engulfing, though I am in pre-emptively. I have honestly no idea at this point where I intend to exit as I think this low may be in for quite some time, we shall see. Stop loss can be set below swing low or even todays low dependant on your risk tolerance and margin. We can also note that the momentum reversal indicator is about to turn into further positive territory.

Natural Gass PredictionsLooking for potential pivot points at the shapes. I marked some examples from the past. I have an interest in the marked date of 1 Feb '24 (Red Star) and another big event that might happen on this drawing. I am also interested to see if the market goes out of the boundaries marked at 1.45 and 3.666.

NaturalGAS RSI positive divergenceHourly, daily and 15 minute chart frame shows positive RSI divergence Wait for the reversal!


Natural gas LongNat gas forming reversal pattern, with prices at all time low we could find an opportunity for long term investment

Inverse relation of Bitcoin and Natural Gas!The top of Gas marks the bottom in bictoin, the bottom in gas marks the top in bitcoin.
HINT : Gas has reached flat bottom and about to boom imo.

Gas touches its lowest level = long-term bullish marketGreetings
Dear analysts and traders,
I hope you are doing well and are motivated for the week ahead. I wish you all the success in your business endeavors. Remember that success in trading lies in consistently defining and sticking to your rules.
As someone interested in the Elliott Wave Principle, I find it to be an invaluable tool for market analysis. I have developed my approach by combining this principle with my personal experience and by considering different scenarios that are likely to occur in the market. It should be noted that I do not like to be surprised in the market, and that's why I have different market prospects. I follow them to be sure and recognize the structure that is forming so that I can 100% recognize it.
I will share my analysis with you, but please note that I am not providing any buy or sell signals. My perspective on idea analysis is completely unbiased, so if the idea analysis meets your standards, you can use it as a guide to make an informed decision.
I have attached my previous analysis of the same market so that you can compare and see the differences. All the details of my analysis are clearly labeled, making it easy for you to understand. However, having a basic familiarity with the Elliott Wave Principle theory will help you understand the analytical idea more easily.
I have been studying the Elliott Wave Principle for almost three years now, and over time, my understanding of this knowledge and experience has grown. What I have achieved so far is the legacy of a genius called Ralph Nelson Eliot, and I am really happy with my progress. May peace be upon him.
Thank you for your support so far. I will always remember your kindness. Please share your comments and criticisms with me.
I hope my analysis will be useful to you in your business journey, and I wish you all the best.
Sincerely,
Mr. Nobody

My setup for Natural gas I can see 1.6 very soon on NG.. Will see..
For the past 1 week I can see some declines happening around in the price.

Natural Gas - will you be burned this week? Natural gas looking for a make or break move this week.
Were at an inflection support level where the bulls need to defend price or run the risk for new lows.
Natural Gas resource stocks showing great signs of strength and accumulation.

US Natutal Gas - Bullish BiasUS Natural Gas is in buy position,as on Daily time frame making a bullish divergence and just taking support from 0.5 Fib level.
Targets should be very next resistance which is 2.121 to 2.219.

#Natgas Update#Natgas returns to the previous scenario, in which wave (ii) is complete. Expect a rapid increase from these levels.

Natgas Uodate#Natgas looks solid. Although wave (ii) required relabeling and repositioning, the combination of the leading diagonal in presumed wave (i), moving averages support, and oversold RSI seemed encouraging.
