Expected bullish Cyclical Behaviour of Natural GasExpected bullish trend found on the basis of bullish divergence in cyclical behavior.
USDNTG trade ideas

#Natgas update#Natgas looks to be favouring the blue scenario posted previously. The price now needs to pullback to form wave (ii) before next rally.

Natgas . Long-term idea. Risk reward is great !I start to buy some options with 2 year expiration
They are hot right now
Even on Friday when gas dropped a little bit - I saw a big demand for 2026 options
Start from small position right here
Not a spec idea, very long-term,
For people which will not close an position after 5% drop XD

Natural Gas: Has the short squeeze begun?Natural gas saw a massive bullish gap up to start the week.
Our members secured and trimmed some long positions while still keeping majority of shares on the table.
We remain long and bullish. We believe pullback can be bought.

Natgas Bears are slowing downNatgas, with my speedlines contracting I anticipate a slowdown in bearish momentum. Will wait for more price sessions and price to intersect either resistance or support lines before taking any trading decision.

2nd Entry NAT GAS longXNG has completed 3 corrective waves on M30. Will be adding new long positions start of week. Let me know if you have any questions.

Have you ever woken up to a nightmare? No heating in TexasWhat if I told you that taking a moment to appreciate the things you have, like a warm heater in Texas, could actually lead to better trading results?
It may sound counterintuitive, but there's actually a lot of truth to this idea. When you take the time to appreciate the good things in your life(LIKE HAVING A ❤️ING HEATER IN TEXAS), it can shift your mindset and make you more grateful for what you have. This gratitude can then lead to a sense of contentment, WARMNESS, and calmness, which are essential for making sound trading decisions.
Here are a few reasons why appreciating a heater in Texas can lead to better trading results:
Reduces stress and anxiety : When you're stressed or anxious ABOUT FREEZING TO DEATH, it's harder to focus and make rational decisions. A warm heater can help to soothe your mind and body, making it easier to stay calm and collected in the trading arena.
Increases emotional intelligence : Appreciating the simple things in life(LIKE HAVING A ❤️ING HEATER IN TEXAS, DO YOU UNDERSTAND?!) can help you to develop a deeper sense of empathy and understanding for others. This emotional intelligence can be a valuable asset in the trading world, as it allows you to better understand the motivations of other traders and make more informed decisions.
Boosts confidence : When you feel grateful for what you have, it can boost your self-confidence. This confidence can then translate into your trading, as you'll be more likely to take calculated risks and make bold moves.
Improves sleep quality : A good night's sleep is crucial for making sound trading decisions. When you're well-rested, you're better able to focus, process information, and make rational decisions. A warm heater can help you to fall asleep easier and sleep more soundly, leading to better trading performance.
So, the next time you're curled up on the couch (IT BETTER BE with a warm heater on) in Texas, take a moment to appreciate the simple things in life. This simple act of gratitude can have a profound impact on your trading results.
So what do you do when you DO NOT have a 🔥ing heater in Texas? You buy deep OTM calls and MOVE!!
TP 5-7 USD. DEC 26 Expiry 50 % OTM Calls.
WE MAKIN IT STRAIGHT TO BANKRUPCY WITH THIS ONE 🔥🔥🔥🔥🔥🔥


Nat Gas Mind GamesThe main motif behind the project is the intention and attempt to predict in advance the tendencies of the market in specific time zones through the representation of the ellipses. Upward pointing means potential bullish sentiment in that time zone, and the other way around for downwards pointing. The catch of the time zone is that their vertical arrows as represented in the snapshot could act as wild card support and resistance levels only in that specific time zone, just like the rectangles are simulated projected potential influence zones of attraction and repulsion.
Recently Nat Gas has been usually swinging up and down after some big players accumulate on their position for the medium term depending on the overall global context. Less technical perspective, but the Japanese Candlesticks still could provide some signs and clues of any such directional positions. For this project it is envisioned that Bullish and Bearish Engulfings and Belt Line Hold candles might trigger some impulsive waves for the bold traders which want to attempt to ride the power waves with rodeo style.
Trade carefully and may the force of profits be with you.

Natural Gas UpdateNatural Gas fighting in the futures to stay alive.
If we for a higher low and close above $1.60 i believe we will have a quick squeeze to $2.25.
The bulls need to defend this gap up!

Capitalizing on Downward Trend and Bearish PressureShorting natural gas amidst its current downtrend and bearish pressure presents a compelling opportunity for traders seeking to profit from market movements. With careful analysis, disciplined execution, and a keen eye on risk management, investors can position themselves advantageo usly to capitalize on the downward trajectory of natural gas prices.

my view / NGASIm waiting new buying opportunity. Ngas is on hunting zone. So that please see carefully.

Natural Gas Trend Reversal ExpectedNatural gas has been experiencing a prolonged period of decreasing prices. However, there are signs of a trend reversal, as divergence is being observed on all timeframes, including week, day, and 4 Hours. This is an indication that the bearish trend may be coming to an end. On the 4H timeframe, the structure has broken to the upside, suggesting the possibility of a bullish trend. To enter long positions, we need to monitor daily closings along with the 4H trend and ride it to the previous major swing highs.

XNGUSD my idea This is my idea xngusd i am learner not trader please comment this is possible or not?

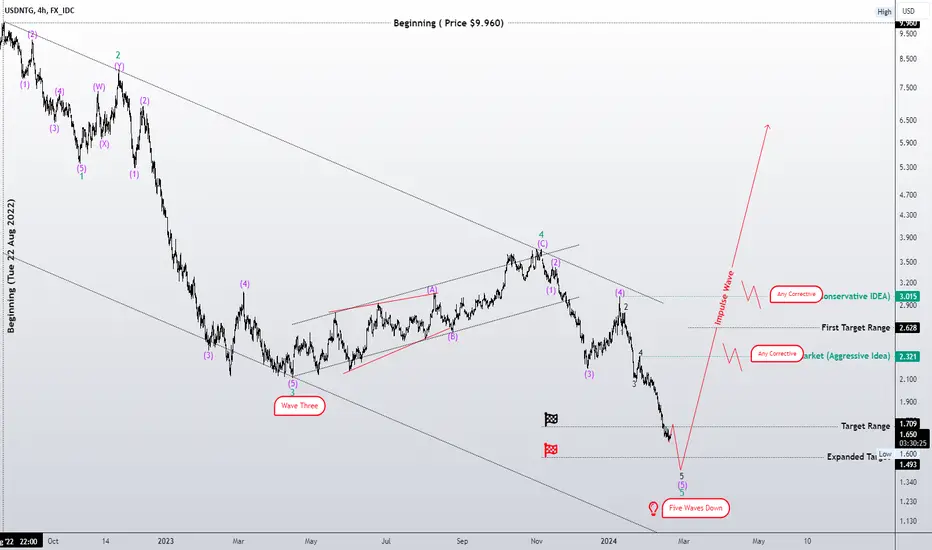
If this pattern is flat! (aggressive idea)Greetings
Dear analysts and traders,
I hope you are doing well and are motivated for the week ahead. I wish you all the success in your business endeavors. Remember that success in trading lies in consistently defining and sticking to your rules.
As someone interested in the Elliott Wave Principle, I find it to be an invaluable tool for market analysis. I have developed my approach by combining this principle with my personal experience and by considering different scenarios that are likely to occur in the market. It should be noted that I do not like to be surprised in the market, and that's why I have different market prospects. I follow them to be sure and recognize the structure that is forming so that I can 100% recognize it.
I will share my analysis with you, but please note that I am not providing any buy or sell signals. My perspective on idea analysis is completely unbiased, so if the idea analysis meets your standards, you can use it as a guide to make an informed decision.
I have attached my previous analysis of the same market so that you can compare and see the differences. All the details of my analysis are clearly labeled, making it easy for you to understand. However, having a basic familiarity with the Elliott Wave Principle theory will help you understand the analytical idea more easily.
I have been studying the Elliott Wave Principle for almost three years now, and over time, my understanding of this knowledge and experience has grown. What I have achieved so far is the legacy of a genius called Ralph Nelson Eliot, and I am really happy with my progress. May peace be upon him.
Thank you for your support so far. I will always remember your kindness. Please share your comments and criticisms with me.
I hope my analysis will be useful to you in your business journey, and I wish you all the best.
Sincerely,
Mr. Nobody

GAS has not yet reached the bottomI believe 1.44 area is where it will finally bounce and perhaps reverse the trend.

bullish contuationAs in the chart we have 0.5 fit level rejection yesterday. and today market is near to that level after rejection but with out volume. so according to the chart we can predict that 1.75 level is crucial imp for demand. and using fb extionsion we have given minimum target ie. 1 (level is 2). i am seeing big players making pocket full. i am hoping strong close above 1.90 level soon. such rejection and moment is very common for market. if market close below 0.5 fib level then is bearish. till the time i am strong bullish in the market. and its best place to add more quantity by looking candlestick patterns. thank you traders.

XNGUSD Short BiasXNGUSD on the 30-minute chart is accompanied by drawn-in trendlines, a Fibonacci
retracement as well as an anchored VWAP and volume profile. An RSI indicator is also added.
Price hit a recent high of 2.81 on May 19th and then trended down to 2.11. While a 50%
retracement might have been expected ( to 2.46) price only rose to 2.42. I consider this as
showing selling pressure from sellers to be slightly exceeding buying pressure. Short bias
for XNGUSD is confirmed since it is trading below the POC line of the long-term volume profile
and below the anchored mean WVAP which are acting as confluent resistance. The RSI topped
out at 60 during the retracement and has fallen below 50.
Overall, the chart supports a short XNGUSD trade with a stop loss just above VWAP / POC
and the target the trendline of support ( green line ) making for a Reward: Risk of
about 2:1 Any leveraged forex trade would amplify both potential loss and potential
profit.

XNGUSD- Spot Natural Gas Ascending WedgeAs shown on the 15 minute chart XNGUSD is in an ascending wedge pattern which is generally
considered bearish. In the past day, price has fallen slightly below the support trendline.
Is this a fake-out or a breakdown? The RSI had turned decidedly weak while the MACD lines
crossed above the histogram and are now under the horizontal zero line. These both suggest
a breakdown falling out of the pattern. Price was well above the high volume area of the
profile where there is little trading to support a further price rise. Overall, XNGUSD may have
went up too far and too quickly. I expect a full reversal as suggested by the mass index indicator
so I will short-sell this forex pair. with moderate leverage. The stop loss will be inside the
pattern just above the support trendline while the target is 2.35 about the value where price
started its previous uptrend.

NATGAS Supply Demand Buy AnalysisSee picture below for analysis
valid buy setup with price inside monthy demand + confirmation but smaller risk
as HTF is tested + counter-trend.

Natural gasNatural gas is on the verge of breaking historic lows amid geopolitical tensions. Year after year, increasing demand for natural gas causes gas prices to rise. My target is $2.07!

Buy Naturalgas Market Capital.comHere is a Scalp for the perfect Start in a new Week.
You can buy Naturalgas now, SL the Lower Line,
Profit the higher Line. 10% for this Setup
Good Luck

The gas will reach its lowest level(complex correction compoundsI hope this message finds you well and that you're having a great start to the week. I wish you success in your business endeavors.
As someone interested in the Elliott Wave principle, I find it a valuable tool for analyzing the market. I have developed my approach by combining this principle with my personal experience and by considering various scenarios that are likely to occur in the market.
I am sharing my analysis with you, but please note that I am not providing any buy or sell signals. I aim to share my unbiased analysis with you so that you can use it as a guide to make informed decisions.
In the attachment, you will find my previous analysis of the same market, so you can compare and see the differences. All the details of my analysis are clearly labeled, making it easy for you to understand (although having a basic familiarity with the Elliott Wave Principle theory will help you understand the analytical idea more easily).
I have been studying the Elliott Wave principle for almost three years now. With time, my understanding of this knowledge and experience has increased. What I have achieved so far is a legacy of a genius named Ralph Nelson Elliott, and I am truly satisfied with my progress. May his soul rest in peace and his memory be cherished.
Thank you for your support so far. I am grateful and will always remember your kindness. Please feel free to share your thoughts and feedback with me.
I hope my analysis will be useful to you in your business journey, and I wish you all the best.
Sincerely.