Natural Gas May Move Down FurtherNatural Gas May Move Down Further
This is an old analysis that I am sharing from the top when the price was at $3.00
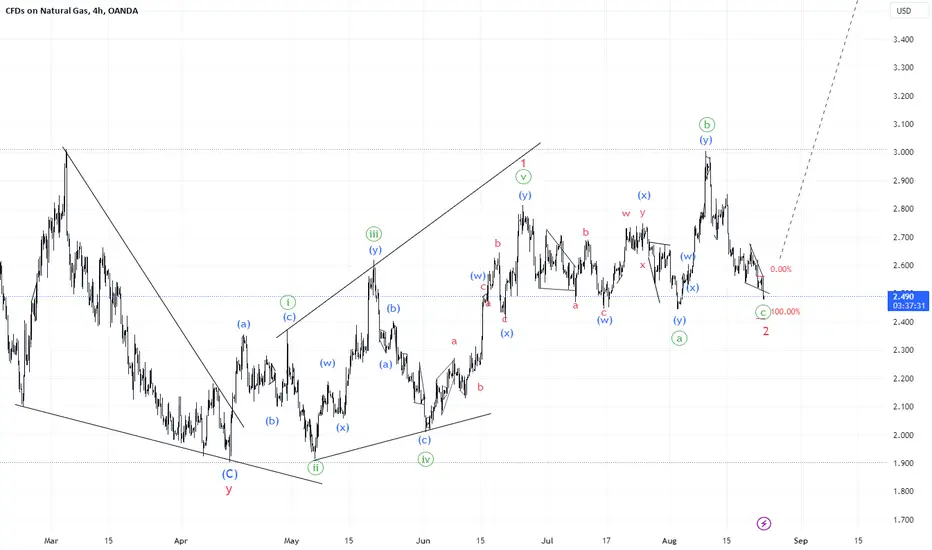
As you can see the price is already at 2.6 and the chances are that the bearish moment
has not over yet.
So far the price is developing another bearish pattern and the chances are growing again for more downside.
if the price will break through the bearish flag pattern it could move down
up to 2.5 and 2.4
Thank you and Good Luck!
USDNTG trade ideas

Natural Gas 🥱It's becoming tiresome as this is is bouncing around more than me in my younger days, but it's my only trade ATM. Happy to chart other things on request!
I am still long, and still waiting in anticipation of a big green god candle. My reasoning behind the bullish stance on Gas is still Energy, more poingnantly access to energy.
Fingers crossed in the future we won't need fossil fuels, but the last I checked we still do and it's being used prolifically.

Nat gas long term My prediction of nat gas long term. Creating a double bottom and the target would be 4 which would also come close to the gap down.

NatGas UpdateAlthough the price largerly followed previously posted scenario the retracement is too deep to ignore. I am inlclined to think that we might be through waves (1) and (2) at this point and is about to start an abrupt ascend in wave (3)
NATGAS LONG TERM TRADE analysisHello Traders
In This Chart NATGAS HOURLY Forex Forecast By FOREX PLANET
today NATGAS analysis 👆
🟢This Chart includes_ (NATGAS market update)
🟢What is The Next Opportunity on NATGAS Market
🟢how to Enter to the Valid Entry With Assurance Profit
This CHART is For Trader's that Want to Improve Their Technical Analysis Skills and Their Trading By Understanding How To Analyze The Market Using Multiple Timeframes and Understanding The Bigger Picture on the Charts

NATGAS_1DHello
Buy
Gas analysis based on Elliott waves in daily and long-term time frames
Gas is in an important support range and two situations can be considered
First, in the same range, 2,500 markets enter a fluctuating range, which can be time-consuming
The second case, which has a stronger possibility, due to the breaking of the upward trend line and maintaining the number and area of 2.500, can enter an upward correction to the target of 3.900, 5.000 and even 6.000, which is the first The target is important

#NatGas UpdateUpon closer examination of the near-term wave subdivisions, I call back the statement that initial wave (a) of the remaining 2023 uptrend might be complete and replace it with a diagonal.
Again, I have to cautiously mention that such projections are very speculative at this stage. I shall be ready to alter my view at any point if I receive new information.

NATGAS LONG TERM TRADE analysisHello Traders
In This Chart GOLD HOURLY Forex Forecast By FOREX PLANET
today Gold analysis 👆
🟢This Chart includes_ (GOLD market update)
🟢What is The Next Opportunity on GOLD Market
🟢how to Enter to the Valid Entry With Assurance Profit
This CHART is For Trader's that Want to Improve Their Technical Analysis Skills and Their Trading By Understanding How To Analyze The Market Using Multiple Timeframes and Understanding The Bigger Picture on the Charts

NATGAS long viewNATGAS could trigger a bullish scenario if we move above the $2.60 level. After that, potential targets are above the $2.70 to $2.80 level.

A Naked Chart. I don't think Natural Gas is range bound, my interpretation is thus: The Daily Chart, as well as the Weekly shows that it is in a clear uptrend, being traded well, I believe it is in the midst of a clean, albeit slow reversal from an overshot, oversold position.
Caution is advised trading this commodity, but I think the idea of shorting at this stage, in my humble opinion, is madness.
I've been wrong plenty of times before and yes, I play around trying to call exact turns on the hour with mixed results, but this is my conviction.
Gas is about to start an overall Macro wave 3 that could take the price back and even above previous ATHs of $16.

NATURAL GAS
Do you think he will ever recover? This is something that the world simply needs and I think that the best opportunities are being created now.
But as in investing, so in trading, we always have to look at some levels for the future

Natural Gas, Trading range first.NATGAS / 1D
Hello trdaers, welcome back to another market breakdown.
NATGAS has been trading in a down trend, the price has rejected the preious resistance level.
For a higher probability setup, the one should wait for a trend line break.
Checkout the chart for my trigger plan.
Trade safely,
Trader Leo

Natural Gas: The Bears Have The Price Control-Textbook ExampleNatural Gas: The Bears Have The Price Control
Since the previous analysis of the price, we saw that the price faced a very strong resistance near $3.05 and it moved down very quickly this time.
On a daily time frame, NG looks like it has room to move down even more.
On a lower time frame, the price created a 5-wave movement and 3-wave correction.
it looks like we are in a textbook example and the chances are that NG may move down for the A wave or 3rd Elliot wave.
The maximum I am watching this time is 2.2
You may find more details in the video!
Thank you and Good Luck!

EUR/JPY Long, NZD/USD Short and NATGAS/USD ShortEUR/JPY Long
• If price pushes down to and ideally just below our area of value and it doesn't do so impulsively, then I'll be looking to get long with a risk entry either after a phase line break on either the one hour or the fifteen minute chart, or after a one hour rejection from it.
• If my entry requirements are not met then I will simply wait until another setup which meets my plan materialises.
• If there's any ambiguity then I will not place a trade on this pair.
NZD/USD Short
• If price pushes up to and ideally just above our preferred area of value, then regardless of how it does so I'll be waiting for a convincing impulse back down followed by a tight flag and then I'll be looking to get short with either a reduced risk entry on the break of the flag or a risk entry within it.
• If my entry requirements are not met then I will simply wait until another setup which meets my plan materialises.
• If there's any ambiguity then I will not place a trade on this pair.
NATGAS/USD Short
• If price corrects and a larger three touch one hour flag forms, then I'll be looking to get long with a risk entry within it.
• If my entry requirements are not met then I will simply wait until another setup which meets my plan materialises.
• If there's any ambiguity then I will not place a trade on this pair.

Sell on Rise Market in Natural GASSell the Natural GAS on Rise for the Target of 2.550
STOP Loss 2.900


$NATGAS PEPPERSTONE:NATGAS is right now at the 61.8 percent retracement from the last move higher.
The price action does not look good.
But what can stop the price from moving down?
-we have the 4H 200MA to at least slow the move down
-dotted blue line that goes back months back
-61.8 percent fib just mentioned

NATURAL GASNatural gas has formed a range and is trying to b breakout the upper end of the range. keep an eey on levels marked, all the logics provided in the chart above

Natural Gas ⛽ August Oracle...Hello Traders 👋
On the Daily Chart here- I've been watching price action from the minute chart to the weekly for quite some time now, I think there will be a retest of this Triangle and it could even break down into it... My prediction for this week is - A bit of volatile sideways action throwing off longs and shorts and then next week we make the move Higher.
What do you think? Would you like me to Chart anything else? Let me know below 👇

NATGAS LONG TERM TRADEBUYING19 minutes ago
Hello Traders
In This Chart GOLD HOURLY Forex Forecast By FOREX PLANET
today Gold analysis 👆
🟢This Chart includes_ (GOLD market update)
🟢What is The Next Opportunity on GOLD Market
🟢how to Enter to the Valid Entry With Assurance Profit
This CHART is For Trader's that Want to Improve Their Technical Analysis Skills and Their Trading By Understanding How To Analyze The Market Using Multiple Timeframes and Understanding The Bigger Picture on the Charts

#NatGas Long-Term #OOTTThe long-term chart remains so far unchanged. It may take a couple of months to mature. By and large, I expect the price to break through $10/MMBtu and never look back. It may be a once-in-a-lifetime trading opportunity lasting over a decade or so.

#NatGas UpdateNatGas is nowhere close to expectations. Here it is purely my fault for not looking for alternatives hard enough. In hindsight, the situation was not that difficult to prepare for.
Initial wave (a) of the remaining 2023 uptrend seems complete (unless it is a diagonal). The price is likely to spend next month consolidating before rising in wave (c) of (y) of 5 of (1). Having missed that move in wave (a), it makes little sense to label lower time frames until wave (b) is fully formed or the price renders the analysis wrong.

Natural Gas: Potential ShortNatural Gas hit big resistance and failed to create new highs.
Natural Gas supply kicks in and brought price lower.
