That way.....Natural gas is mostly methane, but also contains other compounds such as ethane, propane, butane and pentanes – these are called natural gas liquids (NGLs). Natural gas may also contain sulphur compounds, nitrogen, carbon dioxide, water and other substances. International Energy Agency.
USDNTG trade ideas
#NatGas Update #OOTTMy take on Natural Gas developments. I continue to label an ABC flat correction in the making.

More Gas ⛽ (it's my only trade ATM)This one is for reputation points... I'm predicting we break 3.0 with high volume by Tuesday 25th

Am I full of Gas or onto something?Is it... a perfect- lower time frame Cup and handle? Or an immaculately executed bull flag?
No idea but I think it's going up.

Accumulation PhaseWe all know that the price move through phases or cycles. We might see an accumulation phase here before the bulls start getting in and create an increase in demand luring in more buyers. Will keep this on our watchlist. A massive rise in the price of Natgas might be disastrous for Europe when the winter season kicks in.

#NatGas UpdateIf I elaborate on my earlier scenario with unfinished correction, Natgas might perform a spectacular drop over the next few days before resuming the uptrend.
Before this, I expected a triangle, then a flat with an ending diagonal and now a classic expanded flat in wave b. Since wave a was a contracting diagonal, there is an 80% chance that wave c is a quick impulse down and a 20% chance of expanding diagonal.

Natural Gas: Amazing Breakout!UNG & BOIL are looking poised to mive higher.
Energy trade is looking very optimistic from a technical standpoint.
This Bull flag target takes you to $3.25

Natty GasNobody knows and don't believe anyone as it's all a big mind game- BUT.
I believe people may take heavy profit here and maybe even go short, thinking this is a fomo rally, but I think, after a quick dip the climb will continue.

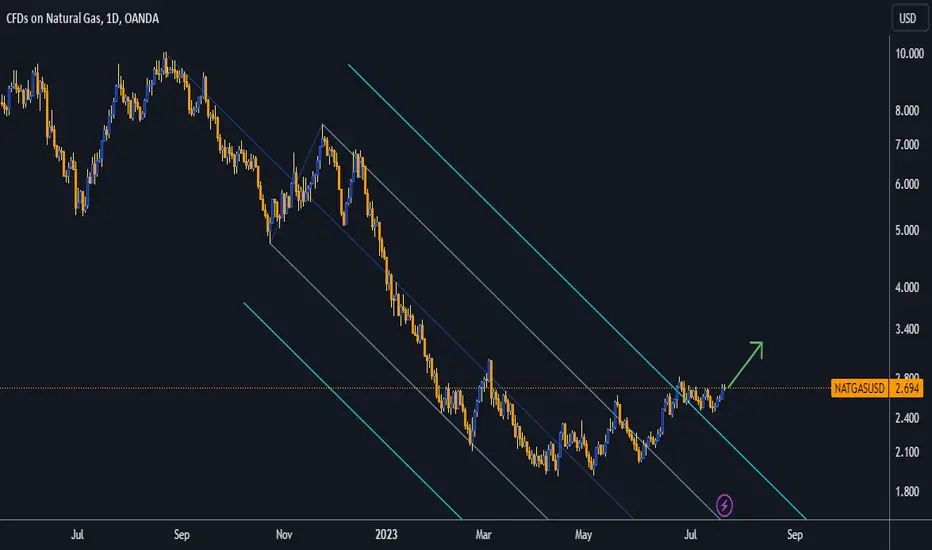
NATURAL GAS - Elliott WaveNatural gas seems to have completed a long correction. 5 sub-waves upwards can be seen. Above the low of 2.15, wave 3 can be expected with targets towards 4.8

Nat gas = electricityJust a thought, could be completely wrong of course... Nobody has a crystal ball. BUT.
I think about now is the time the tech rally AI Fomo does a U-turn and everyone realises that you need shit tons of electricity to power super intelligent AI.
Nat gas chart is a swing traders wet dream.

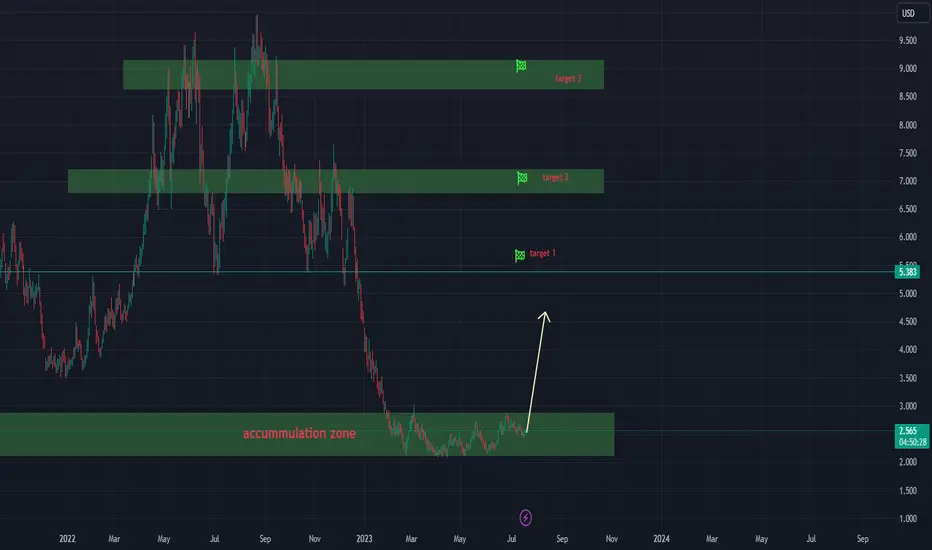
NATGAS in an accumulation zoneNATGAS looks more and more interesting.
It has been in an accumulation zone for a long time and with the current market conditions we are expecting it to start an impulsive phase of the market cycle soon.
It's time to buy NATGAS when it's low and sell when it's high.
3 targets are shown on the chart.
If it goes lower, we will buy buying more. What about you? Are you buying now or waiting for lower prices?
#NatGas Update #OOTTOk, the triangle did not materialise and we are in a different form of correction. I keep thinking the correction is not over.
#NatGas Update #NG #OOTTIt seems like the correction is not yet done as the triagnle is part of wave b not c.

Buy natural gas Sl is your own :p
High possibility it will go up 10%-57%>
Just warming up.
Some wild swings can happen.

NGCUSD 1H down trend and with Bearish Engulfing candleNatural gas is in bearish trend ( making Lowers Lows and Lower Highs), with strong hourly Bearish engulfing candle.

NatGas Update Natural gas appears to be nearing the end of its correction before continuing its ascent into the end of the summer/earluy autumn.
Since wave 3 is shorter than wave 1, wave 5 must be shorter than wave 3 because the third wave cannot be the shortest.
Wave 4 can be done as an expanded flat (notice the rule with variation with wave 2). Also, we can expect a running triangle.
The bigger picture remains unchanged from the prior update.

NATTY developing a H&S We've seen NATTY with a similar but a larger set up prior to the huge bullish movement from 2020 to 2022.
I believe that we'll see a retest of the 2.400 area before making it's move higher.
Let me know what you think.


NATURAL GAS Analysis 13July2023if you look at the history that usually occurs, when you meet a curve pattern like this, the price will rise quite high.

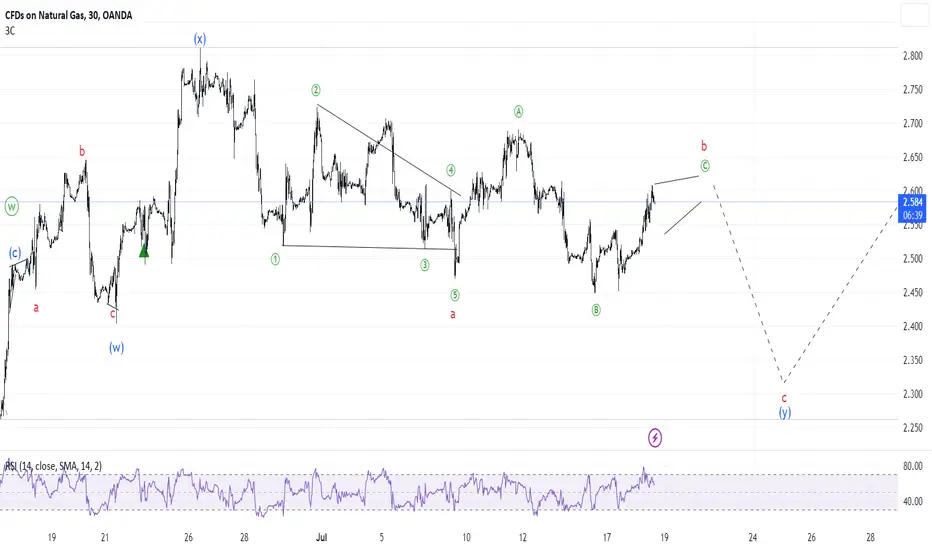
#NatGas UpdateIt is possible that we are still working on the corrective structure [ x]. Wave b of (y) may also be incomplete, making the whole structure to take longer (perhaps the end of July).

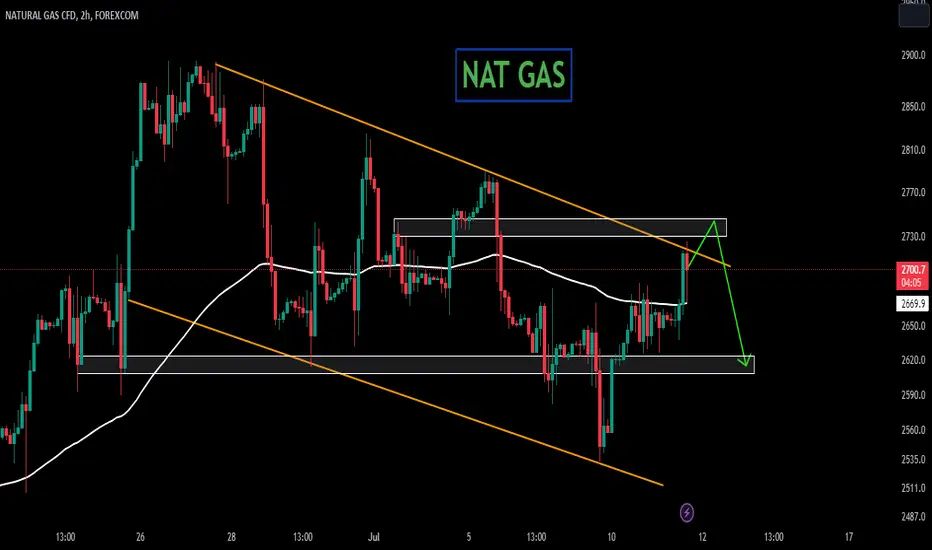
NATURAL GAS Natural gas is creating a very complex scenario at this moment.
A critical price area is located near 2.68.
If the resistance zone will hold the price should move down again.
Natural Gas - BullishWith the current clima, demand for natural gas for AC-cooling, there is a good foundation for a bullish move in Natural Gas.
1. Lets see a move upwards to the 2.8
2. Maybe a slight pullback
3. And then the big move towards the 3-3.05 level
Also bakced by the fact that Buffet have bought into LNG so lets see if the trend can hold.
Good lucK!

Natural Gas: Both Scenarios Are Possible ...but...Natural Gas: Both Scenarios Are Possible ...but...
Natural gas is creating a very complex scenario at this moment showing that
both moves can be possible at this moment.
A critical price area is located near 2.68.
If the resistance zone will hold the price should move down again.
If the price will move above the pattern then it will follow the bullish scenario.
So it is a choice where you find yourself more.
I like more the bearish scenario.
Thank you and Good Luck!
