My Daily $NGAS / $NG1! Idea Because of Absent Seasonal WeaknessSeasonal weakness in FX:NGAS / NYMEX:NG1! is absent so far but it could come into play if war-related concerns are fading with Putin and Ukraine set under "friendly pressure" to end this war.
Still, the gap between ending heating period and beginning demand for cooling is big enough to see a seasonal weakness period, imo.
It's just an idea. As always, do your own research. You are solely responsible for your trades.
Disclaimer
The information and publications are not meant to be, and do not constitute, financial, investment, trading, or other types of advice or recommendations
USDNTG trade ideas

SWING NG (AGGRESSIVE)Last few days NG has been consolidating and correcting for a days, forming a bear flag pattern. Since it bounced off the bear flag resistance the main buy posiprice i am looking for is $3.91 where the price may retest liquidity and 200 MA (which is a major supp). Bullish engulfing candle is what I will be on the look for around 3.91. But I have my speculation, therefore my personal entry is set @$3.94
Alternatively if price breaks 4.33 then the pull back is the next likely position for a buy order. which will be above 4.33
Price 3.76 is a strong supp and also liquidity zone with tested FVG. This can be our stop loss but given the volatility of this future 3.68 would be the best SL.
I am expecting the price to test the bullish OB around 4.7 which is also out TP. For further extended move we will keep track of the price and see if it touches $5-5.2 range.
Lets hope that the Geopolitical influences are kept to a minimum by US/Russia/Ukr.

NATGAS | LONGWe have broken above a major resistance line on this timeframe. We did make a slight lower low on the 1H, but looking at the 4H we should expect a reversal around this range. showing signs of reversal, but having a pretty tight profit target considering the lower low.
4H:

Natural Gas - We touched the resistance, can we do it again?Hi guys, we are looking into a great commodity which just got traction in recent days.
1️⃣. Rising Global Demand
LNG demand is surging worldwide, particularly in Asia and Europe, as nations seek cleaner alternatives to coal and oil. With energy security concerns and geopolitical shifts, LNG is becoming a crucial component of diversified energy portfolios.
2️⃣. Cleaner Energy Alternative
Natural gas produces approximately 50% less carbon dioxide than coal and significantly reduces air pollutants. As governments and industries focus on decarbonization, LNG serves as a reliable bridge fuel toward renewable energy adoption.
3️⃣. Expanding Infrastructure and Market Growth
The LNG market is rapidly expanding, with new terminals, pipelines, and liquefaction plants being developed globally. Technological advancements are improving efficiency and lowering costs, making LNG more accessible and competitive.
4️⃣. Strong Economic and Trade Potential
LNG offers stable pricing mechanisms, long-term contracts, and increasing spot market opportunities. As more countries develop import capabilities, the LNG trade market is set to grow, providing investors with diverse entry points.
5️⃣. Energy Security and Geopolitical Importance
LNG helps countries reduce dependence on specific energy suppliers, improving energy security. The Russia-Ukraine conflict and other geopolitical factors have accelerated the shift toward LNG, boosting its long-term demand and investment potential.
Conclusion
LNG is positioned as a key energy source for the coming decades, balancing affordability, environmental benefits, and security. With strong global demand, technological improvements, and a transition toward cleaner energy, investing in LNG presents a strategic and forward-thinking opportunity.
Entry: 4.2150
Target: 4.6210
SL:3.9020

Natgas - channel resistance hit. long cautionNatgas hit channel resistance in yesterday's spike
Possibly a 5 wave donw or deep into it. Avoid longs

Sell targets on the daily timeframe: 3.41, 3.282.Hello traders and investors!
The price has been near the upper boundary of the sideways range at 4.358 for a couple of weeks. The buyer failed to hold above 4.5, even with increasing volume. The seller absorbed the buying pressure and formed a seller's zone (red rectangle).
Sell targets on the daily timeframe: 3.41, 3.282.
I wish you profitable trades!

Natural Gas Natural Gas Market (XNGUSD) - Trading Strategy and Analysis (Week 12 - March 2025)
Fundamental Analysis:
Short-term (next week): Neutral to bearish due to mild weather forecasts and strong production. Key event: Weekly EIA inventory report every Thursday.
Long-term (6-9 months): Bullish due to strong global LNG demand, lower inventory reserves, and inflationary pressures.
Technical Key Levels:
Bearish Key Levels (Support):
4.1000 (immediate bearish confirmation)
4.0000 (important psychological support)
3.8500 (critical support, likely bottom if bearish momentum accelerates)
Bullish Key Levels (Resistance):
4.2000 (initial significant bullish confirmation)
4.4460 (strong technical resistance, crucial bullish confirmation)
5.0000 (long-term resistance target for winter 2025)
Probabilities & Scenarios (March 17-23, 2025):
Bearish Scenario (65-70% probability):
On a clear break below 4.1000, target towards 4.0000 and possibly 3.8500.
Bullish Scenario (30-35%):
Clear breakout above 4.2000 may trigger bullish momentum targeting 4.4460 initially.
Recommended Trading Strategy:
Short-Term Strategy:
Enter short positions if the price breaks below 4.1000, with initial target at 4.0000 and secondary target at 3.8500.
Long-Term Strategy:
Be strategically prepared to switch to bullish bias if prices convincingly break above 4.2000, targeting 4.4460, and potentially toward 5.0000 in the late summer to autumn period.
Conclusion:
For the short term, favor bearish price movements but remain strategically prepared to shift to a bullish outlook as the fundamental factors likely push natural gas prices higher towards the next heating season.
Natural Gas still coiling! breakdown or breakout?Hello Traders
In This Chart NATGAS HOURLY Forex Forecast By FOREX PLANET
today NATGAS analysis 👆
🟢This Chart includes_ (NATGAS market update)
🟢What is The Next Opportunity on NATGAS Market
🟢how to Enter to the Valid Entry With Assurance Profit
This CHART is For Trader's that Want to Improve Their Technical Analysis Skills and Their Trading By Understanding How To Analyze The Market Using Multiple Timeframes and Understanding The Bigger Picture on the Charts

XNG/USD "Natural Gas" Energy Market Robbery Plan🌟Hi! Hola! Ola! Bonjour! Hallo! Marhaba!🌟
Dear Money Makers & Thieves, 🤑 💰🐱👤🚀
Based on 🔥Thief Trading style technical and fundamental analysis🔥, here is our master plan to heist the XNG/USD "Natural Gas" Energy Market. Please adhere to the strategy I've outlined in the chart, which emphasizes short entry. Our aim is the high-risk Green Zone. Risky level, oversold market, consolidation, trend reversal, trap at the level where traders and bullish thieves are getting stronger. 🏆💸Book Profits Be wealthy and safe trade.💪🏆🎉
Entry 📈 : "The vault is wide open! Swipe the Bearish loot at any price - the heist is on! however I advise placing Sell Stop Orders below the breakout MA or Place Sell limit orders within a 15 or 30 minute timeframe. Entry from the most recent or closest low or high level should be in retest.
Stop Loss 🛑: Thief SL placed at (4.070) swing Trade Basis Using the 4H period, the recent / swing high or low level.
SL is based on your risk of the trade, lot size and how many multiple orders you have to take.
Target 🎯:
Primary Target - 3.680 (or) Escape Before the Target
Secondary Target - 3.450 (or) Escape Before the Target
🧲Scalpers, take note 👀 : only scalp on the Short side. If you have a lot of money, you can go straight away; if not, you can join swing traders and carry out the robbery plan. Use trailing SL to safeguard your money 💰.
📰🗞️Fundamental, Macro, COT Report, Sentimental Outlook, Positioning Analysis:
XNG/USD "Natural Gas" Energy Market is currently experiencing a Bearish trend for short term period (Bullish in future)., driven by several key factors.
💨⛽Fundamental Analysis
Supply and Demand: Natural gas demand is expected to increase due to the ongoing winter season in the Northern Hemisphere.
Production: US natural gas production is expected to remain steady, with a slight increase in production from the Marcellus shale region.
Weather: Colder-than-expected weather in the US and Europe is expected to drive up natural gas demand.
💨⛽Macro Economics
Interest Rates: The US Federal Reserve has maintained its hawkish stance, keeping interest rates at 5.25% to combat inflation.
GDP Growth: The US GDP growth rate is expected to slow down to 2.0% in 2025, due to the ongoing economic uncertainty.
Global Trade: The ongoing trade tensions between the US and China are expected to have a minimal impact on the natural gas market.
💨⛽COT Data
Speculators (Non-Commercials): 35,019 long positions and 20,015 short positions.
Hedgers (Commercials): 20,011 long positions and 30,019 short positions.
Asset Managers: 25,015 long positions and 15,019 short positions.
💨⛽Market Sentiment Analysis
The overall sentiment for XNG/USD is bullish, with a mix of positive and neutral predictions.
60% of client accounts are long on this market, indicating a bullish sentiment.
💨⛽Positioning Analysis
The long/short ratio for XNG/USD is currently 1.75.
The open interest for XNG/USD is approximately 1.2 million contracts.
💨⛽Inventory and Storage Analysis
US Natural Gas Storage: The US natural gas storage level is currently at 1.8 trillion cubic feet, which is 10% below the 5-year average.
Inventory Levels: Inventory levels are expected to decline further due to the ongoing cold weather and increased demand.
💨⛽Additional Tools and Resources
Weather Forecasts: Colder-than-expected weather in the US and Europe is expected to drive up natural gas demand.
Production Data: US natural gas production is expected to remain steady, with a slight increase in production from the Marcellus shale region.
💨⛽Next Trend Move
Bullish Prediction: Some analysts predict a potential bullish move, targeting $4.20 and $4.50, due to the ongoing cold weather and increased demand.
Bearish Prediction: Others predict a potential bearish move, targeting $3.50 and $3.20, due to the expected decline in natural gas demand after the winter season.
💨⛽Future Prediction
Short-Term: Bullish: $4.00-$4.20, Bearish: $3.60-$3.40
Medium-Term: Bullish: $4.50-$4.80, Bearish: $3.20-$2.80
Long-Term: Bullish: $5.00-$5.50, Bearish: $2.50-$2.00
💨⛽Overall Summary Outlook
The overall outlook for XNG/USD is bullish, with a mix of positive and neutral predictions.
The market is expected to experience a moderate increase, with some analysts predicting a potential bullish move targeting $4.20 and $4.50.
Real-Time Market Feed
As of the current time, XNG/USD is trading at $3.90, with a 1.0% increase in the last 24 hours.
📌Keep in mind that these factors can change rapidly, and it's essential to stay up-to-date with market developments and adjust your analysis accordingly.
⚠️Trading Alert : News Releases and Position Management 📰 🗞️ 🚫🚏
As a reminder, news releases can have a significant impact on market prices and volatility. To minimize potential losses and protect your running positions,
we recommend the following:
Avoid taking new trades during news releases
Use trailing stop-loss orders to protect your running positions and lock in profits
💖Supporting our robbery plan 💥Hit the Boost Button💥 will enable us to effortlessly make and steal money 💰💵. Boost the strength of our robbery team. Every day in this market make money with ease by using the Thief Trading Style.🏆💪🤝❤️🎉🚀
I'll see you soon with another heist plan, so stay tuned 🤑🐱👤🤗🤩

Natural Gas: Potential Depreciation Towards 3.2Natural Gas: Potential Depreciation Towards 3.2
Natural gas has recently broken out from a strong support zone, which has now turned into resistance.
The price may develop around this area before moving down again, especially given the previously strong bullish trend.
A robust support level is expected near other structural zones at 3.8, 3.6, and 3.2.
It is important to note that natural gas is a highly volatile instrument, posing significant risks.
You may find more details in the chart!
Thank you and Good Luck!
❤️PS: Please support with a like or comment if you find this analysis useful for your trading day❤️

Natural Gas Wave Analysis – 12 March 2025
- Natural gas reversed from round resistance level 5.0000
- Likely to fall to support level 3.815
Natural gas recently reversed from the resistance area between the round resistance level 5.0000, the upper weekly Bollinger Band and the 38.2% Fibonacci correction of the downward impulse from 2022.
The downward reversal from this resistance area stopped the earlier weekly upward impulse sequence (3) from the start of 2025.
Given the recent formation of the daily Shooting Star and the overbought weekly Stochastic, Natural gas can be expected to fall to the next support level 3.815.

XNG/USD "Natural Gas" Energy Market Robbery Plan🌟Hi! Hola! Ola! Bonjour! Hallo! Marhaba!🌟
Dear Money Makers & Thieves, 🤑 💰🐱👤🚀
Based on 🔥Thief Trading style technical and fundamental analysis🔥, here is our master plan to heist the XNG/USD "Natural Gas" Energy Market. Please adhere to the strategy I've outlined in the chart, which emphasizes short entry. Our aim is the high-risk Green Zone. Risky level, oversold market, consolidation, trend reversal, trap at the level where traders and bullish thieves are getting stronger. 🏆💸Book Profits Be wealthy and safe trade.💪🏆🎉
Entry 📈 : "The heist is on! Wait for the breakout (4.100) then make your move - Bearish profits await!" however I advise placing Sell Stop Orders below the breakout MA or Place Sell limit orders within a 15 or 30 minute timeframe. Entry from the most recent or Swing high or low level should be in retest.
📌I strongly advise you to set an alert on your chart so you can see when the breakout entry occurs.
Stop Loss 🛑: Thief SL placed at (4.400) swing Trade Basis Using the 2H period, the recent / swing high or low level.
SL is based on your risk of the trade, lot size and how many multiple orders you have to take.
Target 🎯:
🏴☠️Primary Target - 3.600 (or) Escape Before the Target
🏴☠️Secondary Target - 3.200 (or) Escape Before the Target
🧲Scalpers, take note 👀 : only scalp on the Short side. If you have a lot of money, you can go straight away; if not, you can join swing traders and carry out the robbery plan. Use trailing SL to safeguard your money 💰.
📰🗞️Read the Fundamental, Macro Economics, COT Report, Global Market Analysis, Sentimental Outlook, Intermarket Analysis, Additional Tools and Resources, Inventory and Storage Analysis, Next Trend Move:
⛽XNG/USD "Natural Gas" Energy Market is currently experiencing a Neutral trend., driven by several key factors.
⭐☀🌟Fundamental Analysis⭐☀🌟
Supply and Demand: The current supply and demand dynamics suggest a surplus in the market, leading to downward pressure on prices.
Production and Storage: US natural gas production remains high, while storage levels are above the 5-year average, contributing to the bearish trend.
Weather: Mild winter weather has reduced demand for natural gas, exacerbating the bearish trend.
⭐☀🌟Macroeconomic Factors⭐☀🌟
Economic Growth: Slowing economic growth can lead to reduced energy demand, negatively impacting natural gas prices.
Inflation: Low inflation can lead to lower energy prices, including natural gas.
Interest Rates: Changes in interest rates can impact the cost of production and transportation of natural gas.
⭐☀🌟COT Data⭐☀🌟
Commitment of Traders: As of March 5, 2025, the COT report shows:
Commercial: Net-short 120,000 contracts ( increased by 10,000 contracts from previous week)
Non-Commercial: Net-short 80,000 contracts (increased by 5,000 contracts from previous week)
Managed Money: Net-short 50,000 contracts (increased by 2,000 contracts from previous week)
⭐☀🌟Intermarket Analysis⭐☀🌟
Crude Oil: Natural gas prices often correlate with crude oil prices. A decline in crude oil prices can lead to lower natural gas prices.
US Dollar: A stronger US dollar can make natural gas more expensive for foreign buyers, potentially decreasing demand.
⭐☀🌟Sentiment Factors⭐☀🌟
Market Sentiment: The current market sentiment is bearish, with a majority of traders and analysts expecting lower prices.
Options Data: Options data suggests a bias towards put options, indicating a bearish sentiment.
⭐☀🌟Seasonal Factors⭐☀🌟
Seasonal Trends: Natural gas prices often follow a seasonal pattern, with prices tend to rise during the winter months (December to February) and fall during the summer months (June to August).
⭐☀🌟Additional Tools and Resources⭐☀🌟
Technical Indicators: RSI (14) is at 30, indicating an oversold condition.
Chart Patterns: A bearish flag pattern is forming on the daily chart.
⭐☀🌟Next Trend Move and Future Trend Prediction⭐☀🌟
Short-Term Targets
Primary Target: $3.80
Secondary Target: $3.50
Ultimate Target: $3.20
Medium-Term Targets
Primary Target: $3.00
Secondary Target: $2.80
Ultimate Target: $2.50
Long-Term Targets
Primary Target: $2.20
Secondary Target: $2.00
Ultimate Target: $1.80
⭐☀🌟Overall Summary and Outlook⭐☀🌟
The overall outlook for XNG/USD (Natural Gas) remains bearish, driven by a combination of fundamental, technical, and sentimental factors. While there are potential risks and uncertainties, the current trend and market sentiment suggest lower prices in the short to medium term.
📌Keep in mind that these factors can change rapidly, and it's essential to stay up-to-date with market developments and adjust your analysis accordingly.
⚠️Trading Alert : News Releases and Position Management 📰 🗞️ 🚫🚏
As a reminder, news releases can have a significant impact on market prices and volatility. To minimize potential losses and protect your running positions,
we recommend the following:
Avoid taking new trades during news releases
Use trailing stop-loss orders to protect your running positions and lock in profits
💖Supporting our robbery plan 💥Hit the Boost Button💥 will enable us to effortlessly make and steal money 💰💵. Boost the strength of our robbery team. Every day in this market make money with ease by using the Thief Trading Style.🏆💪🤝❤️🎉🚀
I'll see you soon with another heist plan, so stay tuned 🤑🐱👤🤗🤩

Natural gas... Upside done for now !?Hit all resistances. Daily, weekly.. etc.
Massive volume inverse pinbar.
Still need to test down side supports.
Even if it falls...
Weekly chart may remain bullish.
4.15 - 3.65 major support & targets.

XNG/USD Analysis: Natural Gas Price Hits Over Two-Year HighXNG/USD Analysis: Natural Gas Price Hits Over Two-Year High
On 27 January, while analysing the natural gas chart, we noted that price fluctuations:
→ Were forming an ascending channel.
→ Identified $3.700 as a key resistance level.
As shown on the XNG/USD chart, bears had control in late January but failed to maintain their grip. Since then:
→ Natural gas prices have continued their upward trajectory.
→ The $3.700 level was breached, becoming part of a resistance zone with an upper boundary at $3.800, which later acted as support (as indicated by the arrow).
As a result, today, natural gas prices have surged to $4.800/MMBtu—the highest level since late December 2022.
Bullish Factors Driving the Market (According to Trading Economics):
→ Weather Conditions – A cold spell in the U.S. has increased demand for heating gas. Meteorologists predict a shift towards milder temperatures across 48 states in March.
→ LNG Exports – U.S. liquefied natural gas (LNG) exports have hit a record high of 15.6 billion cubic feet per day under the new administration. Meanwhile, trade uncertainties, including a potential slowdown in natural gas flows from Canada to the U.S., are raising concerns among market participants.
Technical Outlook for XNG/USD:
→ The market remains in an uptrend (indicated by blue lines), with the price now exceeding its upper boundary.
→ The RSI indicator is approaching overbought levels and may form a bearish divergence.
These observations suggest that the price is in a vulnerable position for a pullback. If this scenario unfolds, a test of the $4.250 area cannot be ruled out.
Trade on TradingView with FXOpen. Consider opening an account and access over 700 markets with tight spreads from 0.0 pips and low commissions from $1.50 per lot.
This article represents the opinion of the Companies operating under the FXOpen brand only. It is not to be construed as an offer, solicitation, or recommendation with respect to products and services provided by the Companies operating under the FXOpen brand, nor is it to be considered financial advice.

IDCWe saw the most volatile week so far yet in 2025. Friday evening was the same with green candles and that spike caused me some worry that the inventories are way off this coming year...Although the price could hit 7 in 4 months time but for now I think this is a big bull trap. I am short for next week and i expect a gap down then waterfall then test the order block at 4.56

Risky... But long seems good Approaching month long trend line.
Approaching earlier swing breakout.
4.15/4.16 may or may not come.
Stop below $4 as per your convenience
This R/R looks good.
But it's an aggressive entry without confirmation

Natural Gas, BullishThe chart suggests an Elliott Wave pattern of an impulsive structure currently in Wave 3. The projection indicates that Wave (3) is in play to 5.37$, with a possible retracement for Wave (4) to 4.8-5 before a continuation toward Wave (5). The breakout is supported by increasing momentum and volume, indicating strong bullish sentiment. Potential resistance around Wave (5) target zone about 10$.
Note that the continuation of the Russia- Ukraine war could act as the catalyst to this trend.


NGAS H4 ShortThe price approached a significant resistance level. According to the analysis I expect a rebound from this level. But do not forget about the fundamental data, which can affect the breakdown of the level. Don't forget to use stop loss

Natural Gas still coiling! breakdown or breakout?Hello Traders
In This Chart NATGAS HOURLY Forex Forecast By FOREX PLANET
today NATGAS analysis 👆
🟢This Chart includes_ (NATGAS market update)
🟢What is The Next Opportunity on NATGAS Market
🟢how to Enter to the Valid Entry With Assurance Profit
This CHART is For Trader's that Want to Improve Their Technical Analysis Skills and Their Trading By Understanding How To Analyze The Market Using Multiple Timeframes and Understanding The Bigger Picture on the Charts

NGASHere are my potential trades... it looks like we are seeing a bull trap. The retracement phase is still going imo, so the trend should still be bullish. A small pull back and then expecting a big rally towards 4.41 or even a whopping 4.6

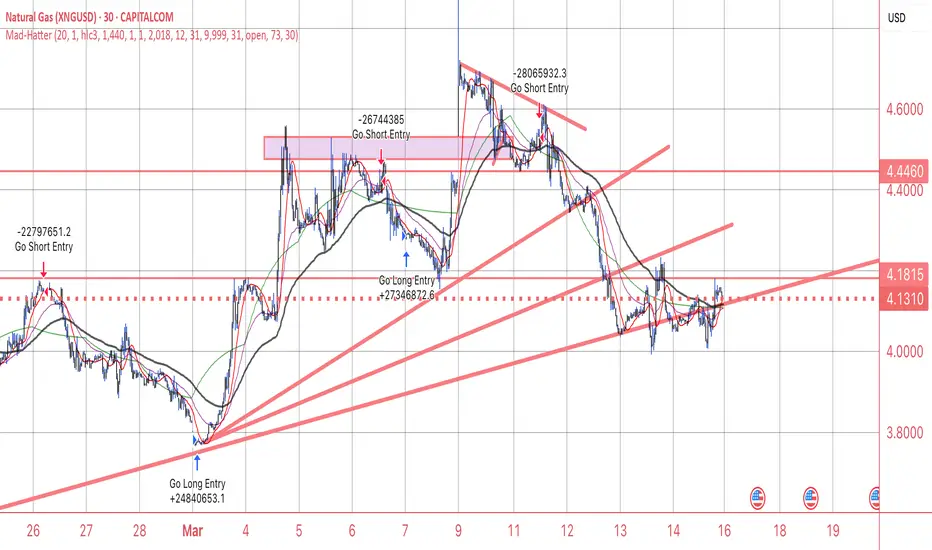
Natural Gas (XNG/USD) – Critical Decision PointNATURALGAS, 4H
Mad-Hatter
Mar 2, 2025
Natural Gas is testing a key support at $3.8250, a level that has provided a base for multiple rallies in the past. However, with bearish fundamental pressure mounting, we may see a breakdown that could accelerate the downside move.
Probability Breakdown & Market Bias
Bearish Breakdown (Below $3.8250). 70%
Bullish Bounce (Holding $3.8250 & reclaiming $3.90-$4.00). 30%
Why the Bearish Bias?
Weather Forecasts Lean Bearish – Warmer-than-expected temperatures in Europe are reducing heating demand, limiting upside potential for Nat Gas prices.
Technical Weakness – Price has been trending downward, forming lower highs since peaking near $4.30. Failure to reclaim $3.90-$4.00 would confirm weakness.
Market Sentiment Shifting Bearish – LNG supply remains stable, and demand isn't spiking as expected. If $3.8250 gives way, sellers will step in aggressively.
Scenario 1: Bearish Breakdown (Most Likely - 70%)
If $3.8250 breaks, expect a sharp decline toward $3.60 - $3.50.
Trade Plan (Short Position)
Entry: Below $3.80 (confirmed breakdown)
Stop Loss: Above $3.85 (to avoid whipsaws)
Target 1: $3.60
Target 2: $3.50
A strong 4H close below $3.80 will confirm the bearish move.
Scenario 2: Bullish Reversal (Less Likely - 30%)
If $3.8250 holds and buyers step in, price could rally toward $3.95 - $4.10.
Trade Plan (Long Position)
Entry: $3.83 - $3.85 (after a clear rejection wick)
Stop Loss: Below $3.75
Target 1: $3.95
Target 2: $4.10
Look for high volume rejection around $3.8250 before entering long.
Final Analysis & Market Outlook
Bias: Leaning Bearish (70% probability of breakdown)
Invalidation: If price holds $3.8250 and reclaims $3.90+, bias flips bullish
Key Catalyst: If Europe remains warmer, expect downside pressure to persist
The higher-probability trade is to short on a confirmed break of $3.80. If the level holds, a long is possible, but the overall structure remains weak. Watch for confirmation before taking action.

Short !? No way !! Every pullback is a buyNatural gas
Short !? No way !! Every pullback is a buy
For me.. it's final destination is still far away.
Ils
Study purpose.. not any trade suggestion..
