NZDUSD Inside a Large ABCDE PatternNZDUSD Inside a Large ABCDE Pattern
The US dollar is lower across the board today as President Trump may accelerate the announcement of a successor to Federal Reserve Chairman Jerome Powell, as reported by the WSJ.
Investors are wary of the lack of independence from the Federal Reserve and expect interest rates to move significantly lower.
It is strange that the market did not move up and down in a crazy way at a time when we were close to a possible World War III and it's really funny that all the charts are moving because Powell could be replaced.
We have to be careful because these are just rumors at the moment and no one can replace Powell if he doesn't want to. Otherwise, Trump would have made this decision a long time ago.
Technical Analysis:
The price is testing a strong resistance area near 0.6100 again
It looks like we are inside a larger pattern and potentially NZDUSD could move down again once these rumors disappear.
Key level zones: 0.6000, 0.5955, and 0.5910
You may find more details in the chart!
Thank you and Good Luck!
❤️PS: Please support with a like or comment if you find this analysis useful for your trading day❤️
Disclosure: I am part of Trade Nation's Influencer program and receive a monthly fee for using their TradingView charts in my analysis.
USDNZD trade ideas

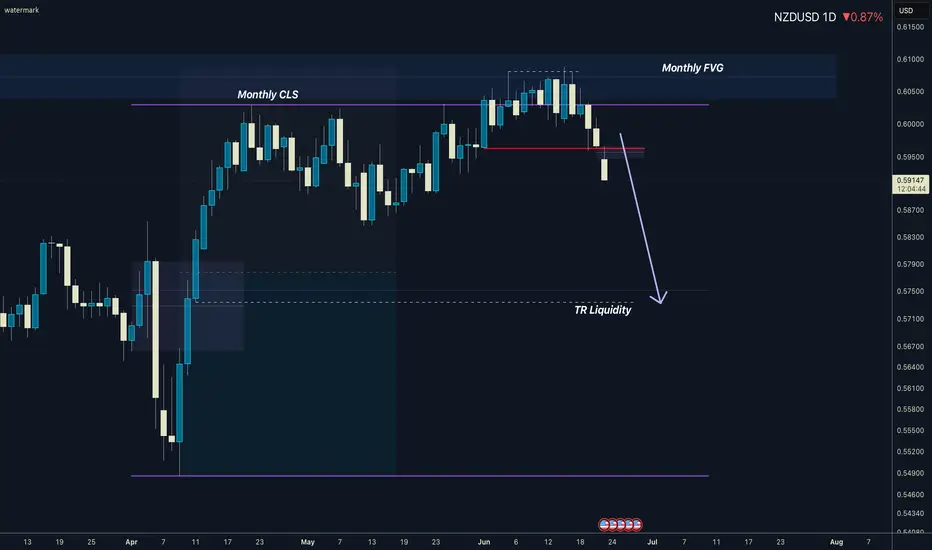
NZDUSD I Monthly CLS I Model 1 I TR Liqudity as TargetHey, Market Warriors, here is another outlook on this instrument
If you’ve been following me, you already know every setup you see is built around a CLS Footprint, a Key Level, Liquidity and a specific execution model.
If you haven't followed me yet, start now.
My trading system is completely mechanical — designed to remove emotions, opinions, and impulsive decisions. No messy diagonal lines. No random drawings. Just clarity, structure, and execution.
🧩 What is CLS?
CLS is real smart money — the combined power of major investment banks and central banks moving over 6.5 trillion dollars a day. Understanding their operations is key to markets.
✅ Understanding the behavior of CLS allows you to position yourself with the giants during the market manipulations — leading to buying lows and selling highs - cleaner entries, clearer exits, and consistent profits.
📍 Model 1
is right after the manipulation of the CLS candle when CIOD occurs, and we are targeting 50% of the CLS range. H4 CLS ranges supported by HTF go straight to the opposing range.
"Adapt what is useful, reject what is useless, and add what is specifically your own."
— David Perk aka Dave FX Hunter ⚔️
👍 Hit like if you find this analysis helpful, and don't hesitate to comment with your opinions, charts or any questions.
NZDUSD Hits Channel Top Bearish Momentum BuildingNZDUSD pair has touched a key resistance zone near the top of its rising channel and is showing early signs of rejection. This technical inflection point aligns with weakening New Zealand economic sentiment and renewed strength in the US dollar. The stage is set for a bearish rotation, with several support targets now in focus if momentum continues to build to the downside.
📉 Current Bias: Bearish
NZDUSD has failed to break above the 0.6085–0.6090 resistance area, marking repeated rejections at the channel’s upper boundary. Price action and structure suggest a potential move back toward 0.6000 and deeper levels such as 0.5960 and 0.5910 if support fails.
🔍 Key Fundamentals:
RBNZ on Hold and Dovish Leaning: The Reserve Bank of New Zealand has paused its tightening cycle, with Governor Orr signaling no urgency to hike further amid weakening domestic demand and subdued inflation momentum.
US Dollar Support: The USD is gaining traction amid Fed officials maintaining a hawkish hold tone, and with markets paring back bets on near-term rate cuts due to sticky inflation and resilient labor data.
NZ Economic Weakness: New Zealand’s growth has stagnated, with recent trade and retail data underwhelming. Business sentiment remains subdued, adding to downside Kiwi pressure.
⚠️ Risks to the Trend:
Soft US Data: Any major downside surprise in upcoming US labor market or inflation figures could reignite Fed rate cut bets and weigh on the dollar, lifting NZDUSD.
China Rebound: As China is a major trading partner for New Zealand, any strong recovery signs or stimulus headlines out of Beijing could buoy NZD on improved trade expectations.
Unexpected RBNZ Hawkishness: If the RBNZ pivots back to a more aggressive tone due to inflation persistence, NZD could find renewed strength.
📅 Key News/Events Ahead:
US PCE Inflation (June 28): Core metric closely watched by the Fed; any surprise will directly impact USD flows.
NZIER QSBO Survey (July 2): Offers insight into New Zealand business confidence.
US ISM Manufacturing & NFP (July 1–5): Major USD drivers with implications for broader market sentiment.
⚖️ Leader or Lagger?
NZDUSD is currently a lagger, often following directional shifts in USD majors like EURUSD and AUDUSD. However, due to its sensitivity to Chinese data and Fed rate expectations, it may accelerate moves once broader USD sentiment is established.
🎯 Conclusion:
NZDUSD looks poised for a bearish pullback from the channel top, with a confluence of macro and technical factors suggesting pressure toward 0.6000, 0.5960, and potentially 0.5910. While downside momentum builds, attention must remain on US data, China headlines, and RBNZ commentary for any sentiment shift. Bears hold the upper hand for now, but risk events ahead could challenge the momentum.

NZDUSD to find sellers at market price?NZDUSD - 24h expiry
Price action looks to be forming a top.
Further downside is expected.
Risk/Reward is ample to call a sell from current levels.
A move through 0.5910 will confirm the bearish momentum.
The measured move target is 0.5875.
We look to Sell at 0.5975 (stop at 0.6005)
Our profit targets will be 0.5900 and 0.5875
Resistance: 0.5950 / 0.5960 / 0.5975
Support: 0.5910 / 0.5900 / 0.5875
Risk Disclaimer
The trade ideas beyond this page are for informational purposes only and do not constitute investment advice or a solicitation to trade. This information is provided by Signal Centre, a third-party unaffiliated with OANDA, and is intended for general circulation only. OANDA does not guarantee the accuracy of this information and assumes no responsibilities for the information provided by the third party. The information does not take into account the specific investment objectives, financial situation, or particular needs of any particular person. You should take into account your specific investment objectives, financial situation, and particular needs before making a commitment to trade, including seeking advice from an independent financial adviser regarding the suitability of the investment, under a separate engagement, as you deem fit.
You accept that you assume all risks in independently viewing the contents and selecting a chosen strategy.
Where the research is distributed in Singapore to a person who is not an Accredited Investor, Expert Investor or an Institutional Investor, Oanda Asia Pacific Pte Ltd (“OAP“) accepts legal responsibility for the contents of the report to such persons only to the extent required by law. Singapore customers should contact OAP at 6579 8289 for matters arising from, or in connection with, the information/research distributed.

Bearish reversal?The Kiwi (NZD/USD) is rising towards the pivot and could reverse to the pullback support.
Pivot: 0.6036
1st Support: 0.5965
1st Resistance: 0.6080
Risk Warning:
Trading Forex and CFDs carries a high level of risk to your capital and you should only trade with money you can afford to lose. Trading Forex and CFDs may not be suitable for all investors, so please ensure that you fully understand the risks involved and seek independent advice if necessary.
Disclaimer:
The above opinions given constitute general market commentary, and do not constitute the opinion or advice of IC Markets or any form of personal or investment advice.
Any opinions, news, research, analyses, prices, other information, or links to third-party sites contained on this website are provided on an "as-is" basis, are intended only to be informative, is not an advice nor a recommendation, nor research, or a record of our trading prices, or an offer of, or solicitation for a transaction in any financial instrument and thus should not be treated as such. The information provided does not involve any specific investment objectives, financial situation and needs of any specific person who may receive it. Please be aware, that past performance is not a reliable indicator of future performance and/or results. Past Performance or Forward-looking scenarios based upon the reasonable beliefs of the third-party provider are not a guarantee of future performance. Actual results may differ materially from those anticipated in forward-looking or past performance statements. IC Markets makes no representation or warranty and assumes no liability as to the accuracy or completeness of the information provided, nor any loss arising from any investment based on a recommendation, forecast or any information supplied by any third-party.

NZDUSD SHORT Market structure bearish on HTFs DH
Entry at Daily AOi
Weekly Rejection At AOi
Daily Rejection At AOi
Previous Structure point Daily
Around Psychological Level 0.60000
H4 EMA retest
H4 Candlestick rejection
Rejection from Previous structure
Levels 3.06
Entry 90%
REMEMBER : Trading is a Game Of Probability
: Manage Your Risk
: Be Patient
: Every Moment Is Unique
: Rinse, Wash, Repeat!
: Christ is King.

NZD/USD Shows Bullish Hints, Can Gains Be Sustained?Market Analysis: NZD/USD Shows Bullish Hints, Can Gains Be Sustained?
NZD/USD is also rising and might aim for more gains above 0.6040.
Important Takeaways for NZD/USD Analysis Today
- NZD/USD is consolidating gains above the 0.6000 zone.
- There was a break above a major bearish trend line with resistance at 0.5970 on the hourly chart of NZD/USD at FXOpen.
NZD/USD Technical Analysis
On the hourly chart of NZD/USD at FXOpen, the pair started a steady increase from the 0.5880 zone. The New Zealand Dollar broke the 0.5920 resistance to start the recent increase against the US Dollar.
There was a break above a major bearish trend line with resistance at 0.5970. The pair settled above 0.5960 and the 50-hour simple moving average. It tested the 0.6040 zone and is currently consolidating gains.
The pair tested the 23.6% Fib retracement level of the upward move from the 0.5882 swing low to the 0.6040 high. However, the bulls are active above the 0.6000 level.
The NZD/USD chart suggests that the RSI is stable near 60. On the upside, the pair might struggle near 0.6040. The next major resistance is near the 0.6090 level.
A clear move above the 0.6090 level might even push the pair toward 0.6120. Any more gains might clear the path for a move toward the 0.6200 resistance zone in the coming days.
On the downside, immediate support is near the 0.5980 level. The first key support is near 0.5960. It is close to the 50% Fib retracement level.
The next major support is near 0.5920. If there is a downside break below the 0.5920 support, the pair might slide toward 0.5880. Any more losses could lead NZD/USD in a bearish zone to 0.5850.
This article represents the opinion of the Companies operating under the FXOpen brand only. It is not to be construed as an offer, solicitation, or recommendation with respect to products and services provided by the Companies operating under the FXOpen brand, nor is it to be considered financial advice.

Heading into overlap resistance?The Kiwi (NZD/USD) is rising towards the pivot which has been identified as an overlap resistance that aligns with the 61.8% Fibonacci retracement and could reverse to the 1st support which is a pullback support.
Pivot: 0.6009
1st Support: 0.5940
1st Resistance: 0.6044
Risk Warning:
Trading Forex and CFDs carries a high level of risk to your capital and you should only trade with money you can afford to lose. Trading Forex and CFDs may not be suitable for all investors, so please ensure that you fully understand the risks involved and seek independent advice if necessary.
Disclaimer:
The above opinions given constitute general market commentary, and do not constitute the opinion or advice of IC Markets or any form of personal or investment advice.
Any opinions, news, research, analyses, prices, other information, or links to third-party sites contained on this website are provided on an "as-is" basis, are intended only to be informative, is not an advice nor a recommendation, nor research, or a record of our trading prices, or an offer of, or solicitation for a transaction in any financial instrument and thus should not be treated as such. The information provided does not involve any specific investment objectives, financial situation and needs of any specific person who may receive it. Please be aware, that past performance is not a reliable indicator of future performance and/or results. Past Performance or Forward-looking scenarios based upon the reasonable beliefs of the third-party provider are not a guarantee of future performance. Actual results may differ materially from those anticipated in forward-looking or past performance statements. IC Markets makes no representation or warranty and assumes no liability as to the accuracy or completeness of the information provided, nor any loss arising from any investment based on a recommendation, forecast or any information supplied by any third-party.

Trade Idea: Buy NZD/USD (Short-Term)
**📈 Trade Idea: Buy NZD/USD (Short-Term)**
**Bias:** 🔼 Mildly Bullish
**Timeframe:** ⏳ Short-Term (few days to a week)
---
### **💡 Why Buy NZD/USD?**
**🇺🇸 U.S. Dollar (USD):**
* **U.S. growth slowing**
→ *📉 Losing steam — not great for the greenback.*
* **Inflation still above 2%**
→ *🔥 Still sticky, but not hot enough to force more hikes.*
* **Fed on pause, no hikes expected**
→ *🛑 Neutral stance = no strong push behind the dollar.*
* **Traders are heavily short USD**
→ *📊 Market leaning bearish — the flow favors downside.*
---
**🇳🇿 New Zealand Dollar (NZD):**
* **Moves with AUD; USD weakness helps**
→ *🧲 Riding the Aussie’s coattails and dollar softness.*
* **RBNZ cut to 3.25% but no surprises now**
→ *💤 Dovish tone is baked in — no fresh reason to sell.*
* **Inflation stable, no shock data**
→ *⚖️ Balanced outlook helps keep NZD supported.*
* **June 23 GDP is the next big test**
→ *📅 Eyes on the date, but no panic until then.*
* **Dairy & China demand still a drag**
→ *🐄📉 Known risks — not new, not spooking the market.*
---
### **🔍 Outlook:**
Not a breakout setup, but NZD/USD could **grind higher** if nothing major changes. USD weakness + quiet Kiwi = room to float up short-term.
---
**📌 Note:**
> *“It’s not exciting, but it’s working. USD soft, NZD steady — could drift higher while the market waits for GDP.”*


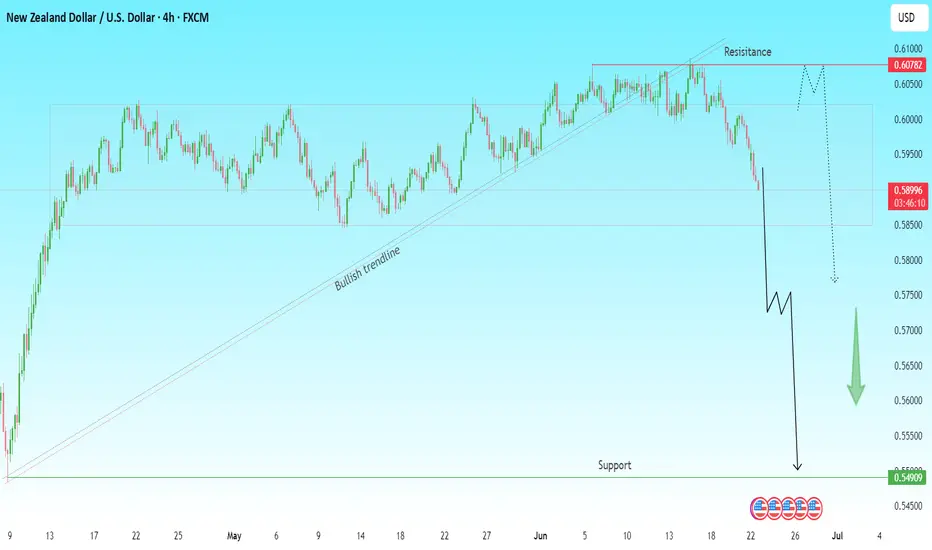
NZDUSD Breakout Alert | Bearish Wave Incoming?The bullish trendline that supported NZD/USD for over a month has finally been broken decisively, signaling a potential bearish reversal.
🔍 Technical Breakdown:
Price has rejected strong resistance around 0.6078 – 0.6100
Clean breakdown below the bullish trendline support
Market structure shift confirmed on the 4H chart
Bearish momentum is gaining strength with no signs of slowdown
📊 Bearish Scenario:
Expecting a minor pullback toward 0.5950–0.5980 zone (potential retest)
If resistance holds, likely continuation toward major support at 0.5490
✅ Trade Idea:
📍 Sell on pullback below 0.5980–0.6000 zone
🎯 Target: 0.5700 → 0.5550 → 0.5490
❌ SL above 0.6100
🔔 Watch closely for price action confirmation before committing – momentum is key.
#NZDUSD #ForexAnalysis #Breakdown #TrendReversal #TechnicalAnalysis #BearishSetup #TradingView #PriceAction
NZD-USD Will Fall! Sell!
Hello,Traders!
NZD-USD made a retest
Of the horizontal resistance
Level of 0.6087 and as it
Is a strong key structure
We will be expecting
A local move down
Sell!
Comment and subscribe to help us grow!
Check out other forecasts below too!
Disclosure: I am part of Trade Nation's Influencer program and receive a monthly fee for using their TradingView charts in my analysis.

CHECK NUZUSD SIGNAL READ CAPTAINnuzusd buy now ✅
entry point (0.59730) (0.59650)
TAKE PROFIT 1: (0.59900)
TAKE PROFIT 2: (0.60200)
LAST TARGET(0.60500)
STOP LOSS (0.59400)

NZD/USDPrice action trading is a methodology in financial markets where traders make decisions based on the actual price movements of an asset over time, rather than relying heavily on technical indicators or fundamental analysis. It involves observing and interpreting patterns and trends in price charts to predict future price movements.

NzdusdThis is my bias on NU
Apply proper risk management pls
I’m not a financial advisor. 1% risk is only
Bullish bounce off overlap support?The Kiwi (NZD/USD) is reacting off the pivot, which has been identified as an overlap support, and could bounce to the first resistance, which is an overlap resistance.
Pivot: 0.5990
1st Support: 0.5951
1st Resistance: 0.6044
Risk Warning:
Trading Forex and CFDs carries a high level of risk to your capital and you should only trade with money you can afford to lose. Trading Forex and CFDs may not be suitable for all investors, so please ensure that you fully understand the risks involved and seek independent advice if necessary.
Disclaimer:
The above opinions given constitute general market commentary, and do not constitute the opinion or advice of IC Markets or any form of personal or investment advice.
Any opinions, news, research, analyses, prices, other information, or links to third-party sites contained on this website are provided on an "as-is" basis, are intended only to be informative, is not an advice nor a recommendation, nor research, or a record of our trading prices, or an offer of, or solicitation for a transaction in any financial instrument and thus should not be treated as such. The information provided does not involve any specific investment objectives, financial situation and needs of any specific person who may receive it. Please be aware, that past performance is not a reliable indicator of future performance and/or results. Past Performance or Forward-looking scenarios based upon the reasonable beliefs of the third-party provider are not a guarantee of future performance. Actual results may differ materially from those anticipated in forward-looking or past performance statements. IC Markets makes no representation or warranty and assumes no liability as to the accuracy or completeness of the information provided, nor any loss arising from any investment based on a recommendation, forecast or any information supplied by any third-party.

NZDUSD Crazy RR on this, look for confluence to enter dont just hop on it
Apply proper risk management 1% is enough
NZDUSD BuY Now SETUPNZDUSD BuY Now SETUP based on Double bottom Pattern level appeared at Support Level Which is Potential Reversal Zone as per Recent History, Accoringly atleast 50% Target is expected to be acheived based on this Setup. :) what are your thoughts?

NZDUSD MARKET ANALYSIS AND PRICE PREDICTIONTrend Reversal set Up. Renegotiation has failed. Bullish move expected! Buy and hold for days.
Entry, Take Profit and stop loss are stated on the chat.
Good Luck Guys!

NZDUSD BUY OPPORTUNITY There is a buy trade Opportunity on NZDUSD
Entry: 0.59200
Stoploss: 0.59100
Takeprofit: 0.59990
Comment your opinion
For Fund management. Dm on X @shajudeakinoba1

NZDUSD TRADE SETUPWait for retest the entry level and bearish momentum then take a trade for Sell otherwise skip this setup

NZD_USD WILL GO DOWN|SHORT|
✅NZD_USD is going down currently
As the pair broke the key structure level of 0.6030
Which is now a resistance, and has made a pullback
And the retest, so I think the price will keep going down on Monday
SHORT🔥
✅Like and subscribe to never miss a new idea!✅
Disclosure: I am part of Trade Nation's Influencer program and receive a monthly fee for using their TradingView charts in my analysis.

NZD-USD Bearish Breakout! Sell!
Hello,Traders!
NZD-USD broke out of the
Rising channel and then made
A bearish breakout of the
Horizontal key level too
Around 0.0602 which is
Now a resistance, then
Made a pullback and retest
And is going down again which
Reinforces our local bearish bias
And we will be expecting a
Further bearish move down
Sell!
Comment and subscribe to help us grow!
Check out other forecasts below too!
Disclosure: I am part of Trade Nation's Influencer program and receive a monthly fee for using their TradingView charts in my analysis.
