NZDUSDBuy. market Execution. Trade 1:2. riesgo 0.50%
I went into buy because the market is respecting the buyers' zone.
USDNZD trade ideas

NZD/USD TRADING PLAN – MAY 21 | RETEST OR CONTINUATION?NZD/USD TRADING PLAN – MAY 21 | RETEST OR CONTINUATION? 🔍
After several steady bullish sessions, NZD/USD is pulling back slightly from the 0.5961 resistance zone. The pair remains within a well-defined ascending channel on the H1 chart and is approaching a key support area around 0.5910 — a zone that could trigger a technical bounce and continuation of the current bullish trend.
🌍 MACRO CONTEXT:
The US Dollar Index (DXY) is showing signs of weakness following disappointing CPI and PPI data. This opens up room for commodity currencies like NZD to recover further.
Meanwhile, New Zealand's domestic consumption data has exceeded expectations, and the RBNZ continues to maintain a stable policy outlook — a medium-term bullish sign for NZD.
Market sentiment is leaning cautiously against the USD, especially as the Fed holds its “no cut but no hike” stance — boosting interest in alternative currencies.
📊 TECHNICAL OUTLOOK (H1):
NZD/USD is trading within an ascending price channel.
EMA 13 is above EMA 34 and EMA 200 — a positive short-term trend signal.
Two important zones to watch today are 0.5910 (key support) and 0.5961 (key resistance).
🎯 TRADE SETUPS FOR TODAY:
✅ SCENARIO A – BUY THE RETEST:
If price tests the 0.5910 zone and shows strong reaction:
BUY ZONE: 0.5910 – 0.5915
SL: 0.5890
TP: 0.5960 → 0.5980 → 0.6000 → 0.6006
→ This zone aligns with ascending channel support + prior FVG → strong rebound probability.
✅ SCENARIO B – BREAKOUT & CONTINUATION:
If price breaks and holds above 0.5961:
BUY SCALP: 0.5965 – 0.5970
SL: 0.5950
TP: 0.5980 → 0.6000 → 0.6006
❌ SCENARIO C – BEARISH BREAKDOWN:
If price fails to hold above 0.5910 and closes H1 candle below it:
SELL SCALP: 0.5900 – 0.5895
SL: 0.5915
TP: 0.5870 → 0.5850 → 0.5820
📌 FINAL THOUGHTS:
NZD/USD is at a critical decision point — this could be a retest before continuation to 0.6000 or the beginning of a deeper drop.
Watch the 0.5910 level closely to determine market direction.
⚠️ Risk management is key — high volatility expected as U.S. PMI data is set for release during today’s NY session.
🧠 Be patient. Let price come to your zone. React, don’t predict.

CURRENT OUTLOOK ON NZDUSDThe pair is in an uptrend and has broken out of its consolidation/correction phase, forming a bullish flag. This suggests the uptrend is likely to continue. We're watching for a potential retest of the broken structure around 0.59276, which could present a buying opportunity.

NZDUSD to find sellers at market price?NZDUSD - 24h expiry
Indecisive price action has resulted in sideways congestion on the intraday chart.
Pivot resistance is at 0.5925.
A move through 0.5875 will confirm the bearish momentum.
The measured move target is 0.5750.
Risk/Reward would be poor to call a sell from current levels.
We look to Sell at 0.5925 (stop at 0.5975)
Our profit targets will be 0.5805 and 0.5750
Resistance: 0.5925 / 0.5950 / 0.5975
Support: 0.5850 / 0.5800 / 0.5750
Risk Disclaimer
The trade ideas beyond this page are for informational purposes only and do not constitute investment advice or a solicitation to trade. This information is provided by Signal Centre, a third-party unaffiliated with OANDA, and is intended for general circulation only. OANDA does not guarantee the accuracy of this information and assumes no responsibilities for the information provided by the third party. The information does not take into account the specific investment objectives, financial situation, or particular needs of any particular person. You should take into account your specific investment objectives, financial situation, and particular needs before making a commitment to trade, including seeking advice from an independent financial adviser regarding the suitability of the investment, under a separate engagement, as you deem fit.
You accept that you assume all risks in independently viewing the contents and selecting a chosen strategy.
Where the research is distributed in Singapore to a person who is not an Accredited Investor, Expert Investor or an Institutional Investor, Oanda Asia Pacific Pte Ltd (“OAP“) accepts legal responsibility for the contents of the report to such persons only to the extent required by law. Singapore customers should contact OAP at 6579 8289 for matters arising from, or in connection with, the information/research distributed.

NZDUSD (LONG)
Weak dollare prediction correlate with this idea
of nzdusd long.
NZDUSD broke out of consolidation and came back to retest the zone of breakout.
which confirm the bull move on NZDUSD.

NZDUSD Will Fall! Short!
Take a look at our analysis for NZDUSD.
Time Frame: 1D
Current Trend: Bearish
Sentiment: Overbought (based on 7-period RSI)
Forecast: Bearish
The market is on a crucial zone of supply 0.590.
The above-mentioned technicals clearly indicate the dominance of sellers on the market. I recommend shorting the instrument, aiming at 0.575 level.
P.S
The term oversold refers to a condition where an asset has traded lower in price and has the potential for a price bounce.
Overbought refers to market scenarios where the instrument is traded considerably higher than its fair value. Overvaluation is caused by market sentiments when there is positive news.
Disclosure: I am part of Trade Nation's Influencer program and receive a monthly fee for using their TradingView charts in my analysis.
Like and subscribe and comment my ideas if you enjoy them!

NZDUSD new microtrend channel in progressI think this is born new microtrend
if breakout from this new yellow channel, this idea false.
But beacause if its yellow channel relevant this short position is work!

NZDUSD SHORTI'm looking to short NZD/USD as a swing trade, and here's why.
The U.S. and China have agreed to ease some tariffs. That’s reducing global trade tensions, which is a positive for the U.S. economy—and could strengthen the dollar as investors shift toward safer assets.
At the same time, retail traders are heavily long NZD/USD. When the crowd is all on one side, the market often moves the other way. That’s a red flag.
Technically, NZD/USD is struggling to hold recent highs and starting to roll over. If we break key support and form a lower high, that’s my confirmation to enter short.
So I’ve got crowded sentiment, a weakening chart, and improving fundamentals for the dollar. It’s a clean swing short setup, and I’ll be waiting for confirmation with proper risk management in place.

Potential bearish drop?The Kiwi (NZD/USD) has rejected off the pivot that lines up with the 127.2% Fibonacci extension and could drop to the pullback support.
Pivot: 0.5933
1st Support: 0.5893
1st Resistance: 0.5968
Risk Warning:
Trading Forex and CFDs carries a high level of risk to your capital and you should only trade with money you can afford to lose. Trading Forex and CFDs may not be suitable for all investors, so please ensure that you fully understand the risks involved and seek independent advice if necessary.
Disclaimer:
The above opinions given constitute general market commentary, and do not constitute the opinion or advice of IC Markets or any form of personal or investment advice.
Any opinions, news, research, analyses, prices, other information, or links to third-party sites contained on this website are provided on an "as-is" basis, are intended only to be informative, is not an advice nor a recommendation, nor research, or a record of our trading prices, or an offer of, or solicitation for a transaction in any financial instrument and thus should not be treated as such. The information provided does not involve any specific investment objectives, financial situation and needs of any specific person who may receive it. Please be aware, that past performance is not a reliable indicator of future performance and/or results. Past Performance or Forward-looking scenarios based upon the reasonable beliefs of the third-party provider are not a guarantee of future performance. Actual results may differ materially from those anticipated in forward-looking or past performance statements. IC Markets makes no representation or warranty and assumes no liability as to the accuracy or completeness of the information provided, nor any loss arising from any investment based on a recommendation, forecast or any information supplied by any third-party.

Bearish reversal?NZD/USD has rejected off the resistance level which is an overlap resistance that lines up with the 127.2% Fibonacci extension and the 61.8% Fibonacci retracement and could drop from this level to our take profit.
Entry: 0.5933
Why we like it:
There is an overlap resistance level that lines up with the 61.8% Fibonacci retracement and the 127.2% Fibonacci extension.
Stop loss: 0.5960
Why we like it:
There is a pullback resistance level.
Take profit: 0.5893
Why we like it:
There is a pullback support level that lines up with the 61.8% Fibonacci retracement.
Enjoying your TradingView experience? Review us!
Please be advised that the information presented on TradingView is provided to Vantage (‘Vantage Global Limited’, ‘we’) by a third-party provider (‘Everest Fortune Group’). Please be reminded that you are solely responsible for the trading decisions on your account. There is a very high degree of risk involved in trading. Any information and/or content is intended entirely for research, educational and informational purposes only and does not constitute investment or consultation advice or investment strategy. The information is not tailored to the investment needs of any specific person and therefore does not involve a consideration of any of the investment objectives, financial situation or needs of any viewer that may receive it. Kindly also note that past performance is not a reliable indicator of future results. Actual results may differ materially from those anticipated in forward-looking or past performance statements. We assume no liability as to the accuracy or completeness of any of the information and/or content provided herein and the Company cannot be held responsible for any omission, mistake nor for any loss or damage including without limitation to any loss of profit which may arise from reliance on any information supplied by Everest Fortune Group.

NZDUSD – Sell Limit Near Pivot ResistanceTrade Setup
Type: Sell Limit
Entry: 0.5925
Stop Loss: 0.6000
Target: 0.5775
Duration: Intraday
Expires: 20/05/2025 15:00
Technical Overview
Price action is sideways and indecisive, forming a congestion zone on the 4H chart.
Pivot resistance sits at 0.5925 — a logical level for bearish entries.
A move through 0.5875 would act as early confirmation of downside momentum.
The measured move target from the range breakdown projects toward 0.5750; however, a more conservative exit is at 0.5775 for higher probability.
Risk/reward is favourable when selling rallies into 0.5925 vs current market price.
Disclosure: I am part of Trade Nation's Influencer program and receive a monthly fee for using their TradingView charts in my analysis.

nzdusd sell🧨 TRADE IDEA - NZD/USD (SHORT)
🕰️ 15min Chart | NY Session Setup
📍 Entry: 0.59096
🎯 TP: 0.58781
🛑 SL: 0.59201
📊 RR: 1 : 3
💼 Lot Size: 0.10
💰 Risk: $0.70 (on $1000 account)
🔍 Price rejected key supply zone — clean bearish structure forming

NZDUSD LONGThe bos is a strong gun bullish momentum I'll be looking for a buy dropping on to the 15 minutes time frame to as well look for bos with momentum to the upside

NZDUSD potential 50 pip drop? NZDUSD 4h crossed the previous liquidity zone with strong false breakout giving a high probability for the price to form a potential inverted head & shoulder and may continue to drop to 0.5308 which may lead a 50 pip drop with market open as the market is in strong down trend.
A possible sell trade setup with market open is highly probable!

NZDUSD: Long Trading Opportunity
NZDUSD
- Classic bullish formation
- Our team expects pullback
SUGGESTED TRADE:
Swing Trade
Long NZDUSD
Entry - 0.5880
Sl - 0.5857
Tp - 0.5918
Our Risk - 1%
Start protection of your profits from lower levels
Disclosure: I am part of Trade Nation's Influencer program and receive a monthly fee for using their TradingView charts in my analysis.
❤️ Please, support our work with like & comment! ❤️

NZDUSD MARKET OUTLOOK Price trades a new high for the year and consolidates in a symmetrical triangle pattern. We’re likely to see a breakout of the symmetry triangle patter to help us ascertain further move on this pair

NZDUSD | Head & Shoulder | ShortNZDUSD has printed a head and shoulder pattern which indicates an end of the bullish trend and beginning bearish retracement.No divergence on RSI adds to the probablity of bearish trend.

NZDUSD Set To Fall! SELL!
My dear friends,
NZDUSD looks like it will make a good move, and here are the details:
The market is trading on 0.5904 pivot level.
Bias - Bearish
Technical Indicators: Supper Trend generates a clear short signal while Pivot Point HL is currently determining the overall Bearish trend of the market.
Goal - 0.5883
About Used Indicators:
Pivot points are a great way to identify areas of support and resistance, but they work best when combined with other kinds of technical analysis
Disclosure: I am part of Trade Nation's Influencer program and receive a monthly fee for using their TradingView charts in my analysis.
———————————
WISH YOU ALL LUCK

New Zealand dollar jumps as inflation expectations hits 1-year hThe New Zealand dollar is in positive territory on Friday. In the European session, NZD/USD is trading at 0.5906, up 0.54% on the day.
New Zealand's two-year inflation expectations climbed to 2.29% in the second quarter, up from 2.06% in Q1, its highest level since last May. The survey also predicted that one-year inflation expectations would rise to 2.41% in Q2, up from 2.15% in the first quarter, also the highest since last May.
The rise in inflation expectations can be viewed as a "Trump bump" as consumers are concerned that US tariffs will lead to higher inflation. For the Reserve Bank of New Zealand, the increase is a reminder of the upside risks for inflation, but at the same time inflation and inflation expectations are within the Reserve Bank's target range of 1%-3%.
With inflation largely contained, the RBNZ is looking to continue lowering interest rates in order to boost the economy. The RBNZ cut rates last month to 3.5% from 3.75% and is expected to cut rates again at the May 28 meeting.
The problem for Bank policymakers is the uncertainty over President Trump's erratic trade policy, which has made it tricky to make growth and inflation forecasts. The US and China engaged in a tit-for-tat tariff war which resulted in massive tariffs, only to suddenly reach a temporary agreement to slash tariffs. Will this lead to a permanent agreement or will the US and China resume their damaging trade war? It's unclear what happens next, especially given the unpredictability of Donald Trump.
The US wraps up the week with UoM consumer sentiment and inflation expectations for May. Consumer sentiment is expected to improve to 53.4 from an upwardly revised 52.2. Inflation expectations surged in April to 6.5% from 4.7% and are projected to rise to 6.6%, as consumers remain anxious about inflation.
NZD/USD has pushed above resistance at 0.5885 and is testing resistance at 0.5909. Above, there is resistance at 0.5940
0.5854 and 0.5830 are the next support levels

NZDUSD(1 Hour).Boost if correctedSo I'm gonna explain the kiwi in 1 Hour to you too.It seems has touched a resistance above and reacted that;So if it continues the fall we can get a buy position in the highlighted zone

NZDUSD(4H).It seems rangeThe currency pair seems to keep a consolidation for a while and now it's seen has touched a support in low and boosted then.There are two scenarios to mind;One it can be back near last support and two moving forward to top.I think the second scenario is common and most possible

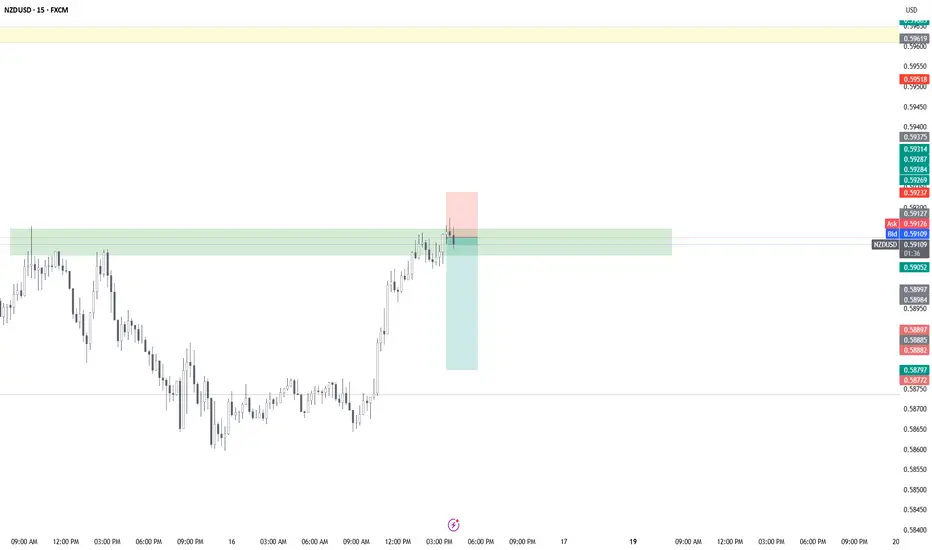
NZD/USD SHORT TRADE IDEA🔍 Trade Breakdown:
Price aggressively rallied into a previous supply zone (highlighted in green), showing signs of buyer exhaustion near the top.
📌 Entry: 0.59125
🛑 Stop Loss: 0.59235 (11 pips)
🎯 Take Profit: 0.58775 (35 pips)
🎯 Risk:Reward = ~1:3.2
💡 Why I Took It:
Market had a strong push up, but into a clear imbalance + supply zone
Bearish reaction candles on the 15m showing rejection from the zone
High R:R opportunity with a tight SL just above the wick rejection
NZD/USD For Bullishwait for pull-back near by entry point and then go long
general trend is up trend
have fun :)
