NZDUSD Massive Bullish Breakout!
HI,Traders !
#NZDUSD is trading in a strong
Uptrend and the price just
Made a massive bullish
Breakout of the falling
Resistance line and the
Breakout is confirmed
So after a potential pullback
We will be expecting a
Further bullish continuation !
Comment and subscribe to help us grow !
USDNZD trade ideas

NZDUSD - BUY Idea on H1A Long opportunity on NZD/USD after a divergence was formed, potentially changing the trend as it breaks the trendline and marks new Higher highs after a series of Lower lows and lower highs.
- Entry to be taken around the 0.5 to 0.61 fib levels
- Stop Loss below the previous Low

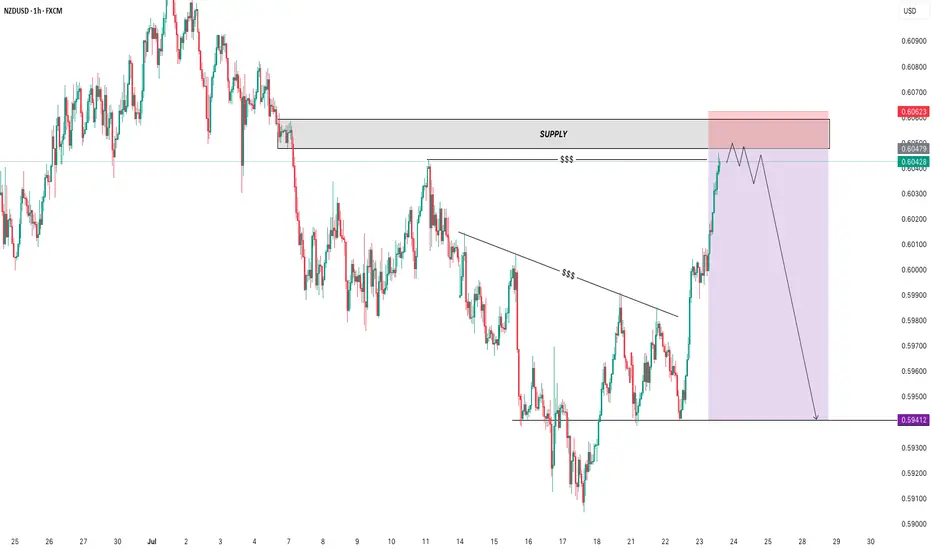
Lingrid | NZDUSD Potential Market Correction From ResistanceFX:NZDUSD has approached a key resistance zone at 0.6040 after completing an A-B-C upward move and forming a potential lower high. Price is testing both horizontal and trendline resistance, suggesting exhaustion within the broader upward move. A failure to hold above the 0.6040 area may trigger a reversal toward the 0.5991 support zone. The structure favors a bearish pullback if the breakout is rejected.
📉 Key Levels
Sell trigger: Rejection from 0.6045
Sell zone: 0.6035–0.6045
Target: 0.5991
Invalidation: Close above 0.6055
💡 Risks
Clean breakout above resistance zone
Strengthening NZD from risk sentiment shift
Holding above upward trendline support
If this idea resonates with you or you have your own opinion, traders, hit the comments. I’m excited to read your thoughts!

SELL NZDUSDIn todays session we are actively monitoring NZDUSD for selling opportunity. Our first entry in ASIA session is at 0.60478 we anticipate a short rally up to our second re-entry at 0.60750. Our stops are above 0.6100 and our targets are at 0.59540. Use your own risk management and entry criteria and best of luck.
New algo entry model is under testing.

NZDUSD: Free Trading Signal
NZDUSD
- Classic bullish setup
- Our team expects bullish continuation
SUGGESTED TRADE:
Swing Trade
Long NZDUSD
Entry Point - 0.6013
Stop Loss - 0.6004
Take Profit - 0.6028
Our Risk - 1%
Start protection of your profits from lower levels
Disclosure: I am part of Trade Nation's Influencer program and receive a monthly fee for using their TradingView charts in my analysis.
❤️ Please, support our work with like & comment! ❤️

NZDUSDNZDUSD price is near the support zone 0.59197-0.58790. If the price cannot break through the 0.58790 level, it is expected that the price will rebound. Consider buying the red zone.
🔥Trading futures, forex, CFDs and stocks carries a risk of loss.
Please consider carefully whether such trading is suitable for you.
>>GooD Luck 😊
❤️ Like and subscribe to never miss a new idea!

NZDUSD BUY 0.5990On the 4-hour chart, NZDUSD formed a bullish bat pattern and then stabilized and rebounded, and short-term bulls have the upper hand. Currently, you can pay attention to the support near 0.5990. If it stabilizes, you can consider going long. The upper resistance is 0.6080-0.6120 area.

NZDUSD What Next? SELL!
My dear subscribers,
This is my opinion on the NZDUSD next move:
The instrument tests an important psychological level 0.6033
Bias - Bearish
Technical Indicators: Supper Trend gives a precise Bearish signal, while Pivot Point HL predicts price changes and potential reversals in the market.
Target - 0.5987
My Stop Loss - 0.6061
About Used Indicators:
On the subsequent day, trading above the pivot point is thought to indicate ongoing bullish sentiment, while trading below the pivot point indicates bearish sentiment.
Disclosure: I am part of Trade Nation's Influencer program and receive a monthly fee for using their TradingView charts in my analysis.
———————————
WISH YOU ALL LUCK

NZDUSD: Time For Pullback 🇳🇿🇺🇸
I think that NZDUSD will retrace from the underlined resistance.
As a confirmation, I spotted a bearish imbalance candle on an hourly time frame
after its test.
There is a high chance to see a retracement.
Goal - 0.602
❤️Please, support my work with like, thank you!❤️

SELL NZDUSD SELL NZDUSD , without negleting the power of barish movement in NZDUSD the market has managed to make a maium retst towards a POI with liquidty swap where i expect the market to tur into a very shapbearish movement
remember to manage ur trades , use proper risk management and good luck family
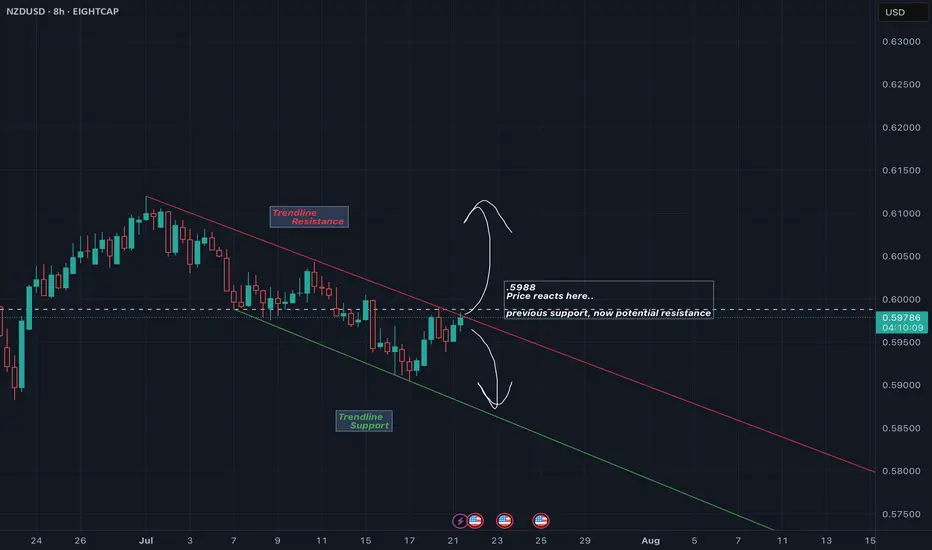
Just following linesNzd price within an 8hr channel. Either going to break out and become bullish (short term) or it may just fall back within the channel. Either movement should signal short term direction for the pair.
NZDUSD Potential LongsThis is how I'd be looking at NZDUSD for longs, not a high probability setup, considering current bearish structure but good RR makes it worth the risk

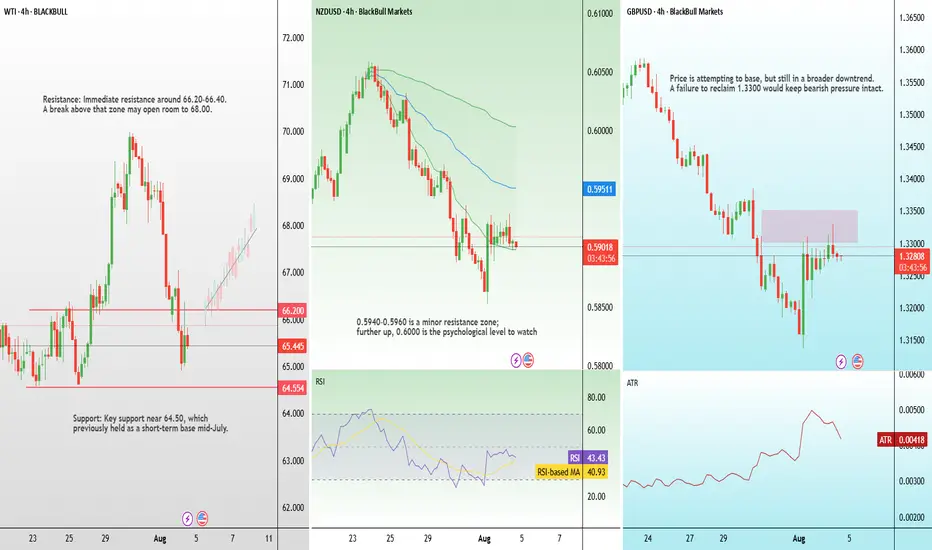
Tariffs, NZ unemployment, and rate cuts: Highlights for the weekAfter a packed calendar last week, this one looks lighter—but there are still key events across major economies likely to drive FX market movement.
India Tariffs and Oil Prices
U.S. President Donald Trump has announced plans to raise tariffs on Indian imports, citing India’s continued purchase and resale of Russian oil. The White House rightly claims this undermines sanctions and helps fund the war in Ukraine. India’s Ministry of External Affairs called the move “unjustified and unreasonable.”
New Zealand Jobs Data — Wednesday
New Zealand’s Q2 unemployment rate is expected to rise from 5.1% to 5.3%, the highest level since late 2015. With inflation back within the RBNZ’s 1–3% target range, a soft labour print could provide the final justification for a rate cut at the next policy meeting.
Bank of England Rate Decision — Thursday
The BoE is widely expected to cut its policy rate by 25 basis points this week, responding to slowing economic momentum despite ongoing inflation concerns. Traders will closely watch Governor Bailey’s remarks to gauge whether this marks the start of a broader easing cycle or a single adjustment.
Nzdusd We hv price on a down trend so we are expecting a retracment back to de zone and a change of structure on the 4h then I sell

NZD/USDThis analysis is based on a combination of volume analysis, Fibonacci retracement levels, and Stochastic oscillator signals to identify a high-probability entry point. The trade setup suggests a potential bearish move following confirmation from volume patterns and momentum indicators.
Entry: 0.5907 area
Stop-Loss: 0.5916 area
Take-Profit: 0.5893 area
This setup targets a short-term downward correction within a key Fibonacci zone, supported by weakening volume and an overbought signal from the Stochastic indicator.
⚠️ Disclaimer:
This is not financial advice. Trading involves risk and may not be suitable for all investors. Always conduct your own analysis and use proper risk management.

NZDUSD BUY TRADE PLAN (PULLBACK)📋 TRADE PLAN – NZDUSD (SHORT-TERM BUY SCENARIO)
📅 Date Issued: August 4, 2025
🔍 1. TOP-DOWN STRUCTURAL CONTEXT
🟣 D1 TIMEFRAME
Price has printed a strong rejection wick near 0.5885 support zone.
Structure: Currently in a D1 pullback phase within broader bearish context.
Reaction: First clean bullish candle printed after 3 consecutive bearish days.
🔵 H4 TIMEFRAME
Bullish engulfing printed (August 2, 12:00) from support at ~0.5880.
Price is now consolidating above this reaction zone, respecting structure.
Micro higher low formed; potential to extend pullback toward 0.5950–0.5975 range.
🟢 H1 TIMEFRAME
Retest structure forming between 0.5895 – 0.5908.
Multiple wick rejections showing buyers defending liquidity pocket.
Price forming tight intraday range post bullish impulse.
🧠 2. INSTITUTIONAL ZONE CLASSIFICATION
Type Level Status Freshness RR Quality Origin Timeframe
Demand (Primary) 0.5880–0.5890 ✅ Mitigated Clean Good H4
Supply (Target Zone) 0.5950–0.5970 🟡 Pending Fresh High H4
Demand (Backup) 0.5850 🟡 Untapped Fresh Moderate D1
✅ 3. TRADE PLAN STATUS:
🟢 ACTIVE – Confirmation Printed
H4 Bullish Engulfing confirmed on August 2 (12:00 candle) from 0.5880 zone.
H1 is consolidating post-impulse, showing compression + wick defense.
Structure supports short-term pullback upside.
🧭 4. EXECUTION DETAILS
Parameter Value
Entry Zone 0.5900 – 0.5908 (H1 compression)
Stop Loss 0.5875 (below H4 demand wick)
TP1 0.5950 (first H4 supply)
TP2 0.5970 (full imbalance fill)
Risk Model 0.5–1.0% per entry
Trade Type Pullback Continuation (Intraday)
🔁 5. CONFIRMATION DETAILS
Candle Type: H4 Bullish Engulfing
Candle Time: H4, August 2 @ 12:00
Behavior: Large rejection wick + body close above previous structure
Volume Context: Expansion candle → first impulsive buy leg from demand
🧠 6. RISK NOTES
This is not a long-term reversal, but a pullback trade.
Invalidation on clean close below 0.5875.
Failure to break 0.5950 decisively may indicate early reversal or range continuation.
🔄 7. ZONE ESCALATION REMINDER
📌 High-Probability Sell Zone (Future Conditional Setup)
Zone: 0.5975–0.5995 (D1–H4 origin supply)
Status: 🟡 Conditional – Awaiting price arrival
Setup Type: HTF Mean Reversion (probability increase if compression into zone)
✅ FINAL TRADE LABEL
🟢 NZDUSD INTRADAY BUY PLAN
Entry: 0.5900–0.5908 | SL: 0.5875 | TP1: 0.5950 | TP2: 0.5970
Status: ACTIVE – H4 Bullish Engulfing confirmed
Context: Short-term continuation from demand. Risk managed pullback play.

NZDUSD LTF Triangle being formedNZDUSD is going up in all TF's.
A very small triangle is spotted in this case, we will wait for break to the upside to enter into the market.

Head and Shoulders on NZDUSDWe are seeing a Head and Shoulders Reversal Pattern on the NZDUSD 1D chart.
If the price goes below the 0.58900, we will see a further downtrend.

NZDUSD is in the Selling DirectionHello Traders
In This Chart NZDUSD HOURLY Forex Forecast By FOREX PLANET
today GBPUSD analysis 👆
🟢This Chart includes_ (NZDUSD market update)
🟢What is The Next Opportunity on NZDUSD Market
🟢how to Enter to the Valid Entry With Assurance Profit
This CHART is For Trader's that Want to Improve Their Technical Analysis Skills and Their Trading By Understanding How To Analyze The Market Using Multiple Timeframes and Understanding The Bigger Picture on the Charts

NZD/USDThis is a trade setup for NZD/USD, based on volume and trend analysis.
Entry Price: 0.58742
Stop-Loss (SL): 0.58892
Take-Profit (TP): 0.58582
The trade is intended to be executed instantly at the mentioned price, in alignment with both volume behavior and the current trend direction.
Disclaimer: This setup is shared purely for backtesting purposes and to document trade ideas. It is not financial advice. Always perform your own analysis before making any trading decisions.

NZDUSD in bearish trend NZDUSD in bearish trend with bullish RSI diversion and 91% long bias, entry with a Buy stop above the last Lower High RR 1:1

ENTRY NZDUSDDisclaimer:
This is merely a chart-based analytical trading idea and is not considered investment advice. Please manage your risks carefully and conduct your own research before making any trading decisions.

