Short trade
Day TF overview
Sellside trade
Pair NZDUSD
Sun 30th March 25
5.00 pm (NY Time)
NY Session AM
Structure Day
Entry 4Hr
Entry 0.56969
Profit level 0.56389 (1.02%)
Stop level 0.57247 (0.49%)
RR 3.68
Reason: Price action seems indicative
of a Sellside momentum since Sunday
30th March 25.
Target Wed 5th March - liquidity low
USDNZD trade ideas

A bullish movement on NZDUSDNZDUSD has been bearish for a while, and it seems to be starting a new bullish movement.
currently on a support and valid uptrend on a 4h timeframe

NZDUSD has broken it's support and already in Down TrendNZDUSD has broken its support and is already experiencing a downward trend.
A short position may be taken.

NZD/USD at Risk of Retesting Yearly LowsThe Kiwi is clinging to uptrend support within a broader rising wedge, with selling pressure reemerging at .5680 despite Monday’s late recovery.
A clean break below the uptrend could see bears target .5650, the low from Monday. A move through that level would put .5600 in focus as the next downside target.
Momentum signals reinforce the bearish case—RSI (14) and MACD continue to trend lower into negative territory, favouring selling rallies and downside breaks.
If the price were to fail beneath the uptrend again and reverse back above .5680, the bearish bias would be invalidated for now.
Good luck!
DS


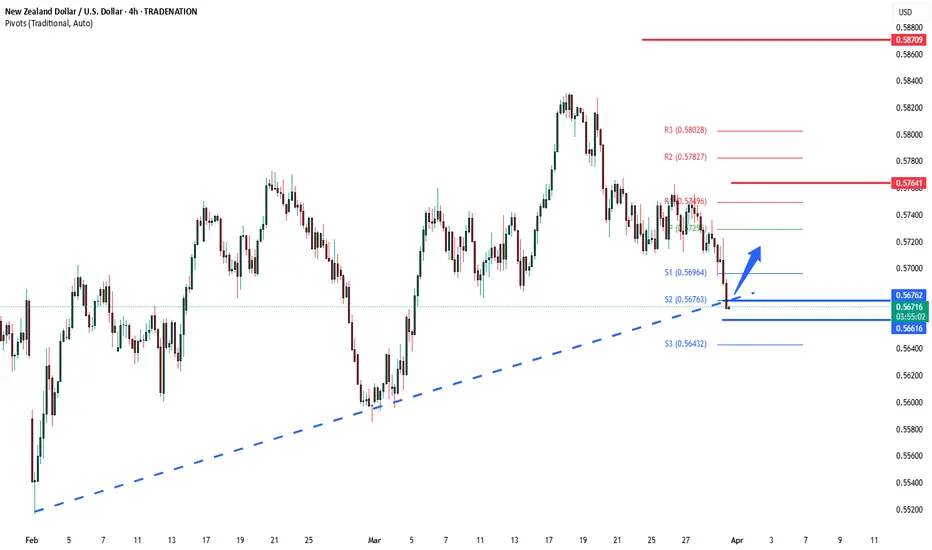
Potential bullish bounce?NZD/USD is reacting off the support level which is a pullback support and could bounce from this level to our take profit.
Entry: 0.5665
Why we like it:
There is a pullback support level that lines up with the 78.6% Fibonacci projection.
Stop loss: 0.5634
Why we like it:
There is a pullback support level that line sup with the 78.6% Fibonacci retracement.
Take profit: 0.5710
Why we like it:
There is a pullback resistance level that lines up with the 50% Fibonacci retracement.
Enjoying your TradingView experience? Review us!
Please be advised that the information presented on TradingView is provided to Vantage (‘Vantage Global Limited’, ‘we’) by a third-party provider (‘Everest Fortune Group’). Please be reminded that you are solely responsible for the trading decisions on your account. There is a very high degree of risk involved in trading. Any information and/or content is intended entirely for research, educational and informational purposes only and does not constitute investment or consultation advice or investment strategy. The information is not tailored to the investment needs of any specific person and therefore does not involve a consideration of any of the investment objectives, financial situation or needs of any viewer that may receive it. Kindly also note that past performance is not a reliable indicator of future results. Actual results may differ materially from those anticipated in forward-looking or past performance statements. We assume no liability as to the accuracy or completeness of any of the information and/or content provided herein and the Company cannot be held responsible for any omission, mistake nor for any loss or damage including without limitation to any loss of profit which may arise from reliance on any information supplied by Everest Fortune Group.

NZD/USD 4H ANLAYSIS consolidation within the correctionThis chart shows the NZD/USD pair on the 4H timeframe.
Analysis
Trend: Price is moving within a rising channel.
Current Price: ~0.57182
Projected Move: Bearish continuation towards the lower channel boundary.
Trade Plan
Entry Point: Consider a short position on a retest of resistance near 0.5730 - 0.5750 with bearish confirmation.
Stop Loss (SL): Above the recent structure high, around 0.5785.
Take Profit (TP): Near the lower channel boundary around 0.5580 - 0.5600.
Risk Management
Ensure the risk-to-reward ratio is favorable (at least 1:2).
Look for confirmation signals such as bearish engulfing candles or rejections before entry.
Would you like a refined entry strategy or confirmation signal tips?

nzdusda very solid intersection between the bullish channel and the bearish channel together with the 61.80% fibonachi which shows us a rejection of the upside, we will see a possible rise in nzdusd.

NZDUSD Technical AnalysisFenzoFx—NZDUSD dropped below the $0.5678 support level and is now trading around $0.5670. Selling pressure has pushed the Stochastic Oscillator into oversold territory, recording 8.0.
The next bearish target is $0.5640, provided NZDUSD stays below the $0.5755 resistance.

NZDUSD – Bullish Bias with Key Support at 0.5676Trend Overview:
NZDUSD remains in a bullish uptrend, with recent price action showing a corrective pullback towards a previous consolidation zone, now acting as a key support at 0.5676.
Key Levels:
Support: 0.5676 (key level), 0.5660, 0.5640
Resistance: 0.5730, 0.5750, 0.5770
Bullish Scenario:
A bounce from 0.5676 would reinforce the support level, signaling a continuation of the uptrend. A breakout above 0.5730 may drive further gains toward 0.5750 and 0.5770 in the longer term.
Bearish Scenario:
A daily close below 0.5676 would weaken the bullish outlook, increasing the likelihood of a retracement toward 0.5660, with 0.5640 as the next downside target.
Conclusion:
NZDUSD remains bullish above 0.5676, with potential upside targets at 0.5730, 0.5750, and 0.5770. However, a break below 0.5676 could shift momentum to the downside, targeting 0.5660 and 0.5640. Traders should monitor price action at 0.5676 for confirmation of the next move.
This communication is for informational purposes only and should not be viewed as any form of recommendation as to a particular course of action or as investment advice. It is not intended as an offer or solicitation for the purchase or sale of any financial instrument or as an official confirmation of any transaction. Opinions, estimates and assumptions expressed herein are made as of the date of this communication and are subject to change without notice. This communication has been prepared based upon information, including market prices, data and other information, believed to be reliable; however, Trade Nation does not warrant its completeness or accuracy. All market prices and market data contained in or attached to this communication are indicative and subject to change without notice.
NZD/USD For Bearishwait for pull-back near by entry point and then go short
NZD Under pressure
have fun :)

Market Analysis: NZD/USD Struggles to Sustain Gains—What’s Next?Market Analysis: NZD/USD Struggles to Sustain Gains—What’s Next?
NZD/USD is also moving lower and might extend losses below 0.5700.
Important Takeaways for NZD/USD Analysis Today
- NZD/USD declined steadily from the 0.5760 resistance zone.
- There is a major bearish trend line forming with resistance at 0.5715 on the hourly chart of NZD/USD at FXOpen.
NZD/USD Technical Analysis
On the hourly chart of NZD/USD on FXOpen, the pair also followed a similar pattern and declined from the 0.5760 zone. The New Zealand Dollar gained bearish momentum and traded below 0.5725 against the US Dollar.
The pair settled below the 0.5720 level and the 50-hour simple moving average. Finally, it tested the 0.5695 zone and is currently consolidating losses.
Immediate resistance on the upside is near the 50% Fib retracement level of the downward move from the 0.5736 swing high to the 0.5693 low at 0.5715. There is also a major bearish trend line forming with resistance at 0.5715.
The next resistance is the 0.5725 level or the 76.4% Fib retracement level of the downward move from the 0.5736 swing high to the 0.5693 low. If there is a move above 0.5725, the pair could rise toward 0.5750.
Any more gains might open the doors for a move toward the 0.5800 resistance zone in the coming days. On the downside, immediate support on the NZD/USD chart is near the 0.5705 level.
The next major support is near the 0.5695 zone. If there is a downside break below 0.5695, the pair could extend its decline toward the 0.5665 level. The next key support is near 0.5640.
This article represents the opinion of the Companies operating under the FXOpen brand only. It is not to be construed as an offer, solicitation, or recommendation with respect to products and services provided by the Companies operating under the FXOpen brand, nor is it to be considered financial advice.

#NZDUSD BREAKOUT TO THE DOWNSIDENZDUSD broke out of its uptrend by breaking the trendline on the 4h chart.
We may get a confirmation pullback here depending on the strength of the trend.
The first target sits at 0.56800 and if we break this support, we may even head back down to the 0.55950 zone.

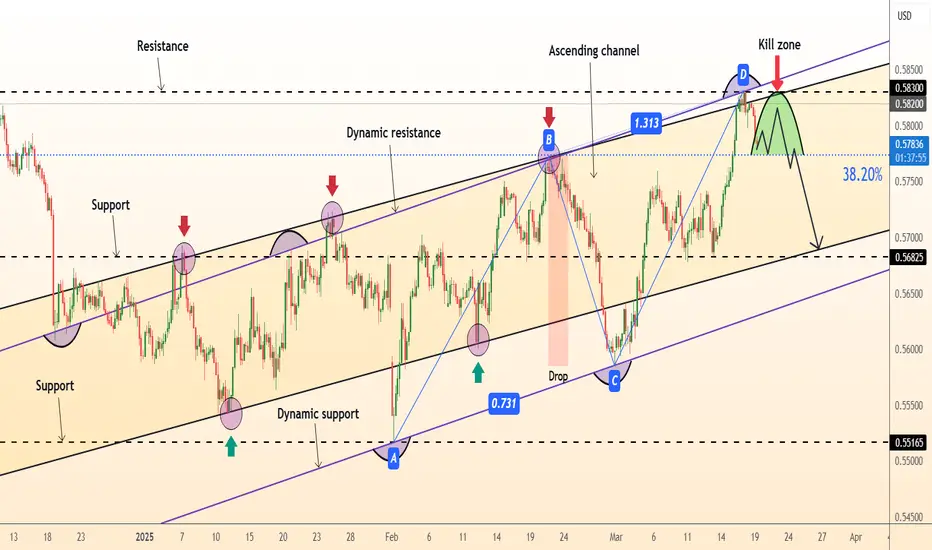
DeGRAM | NZDUSD pullbackNZDUSD is in an ascending channel between trend lines.
The price is moving from the upper boundary of the channel, the upper trend line, which has already acted as a pullback point, as well as from the important psychological resistance level of $0.583.
Indicators point to the bearish divergence being worked out on the 1H Timeframe.
The chart has formed a pattern AB=CD.
We expect a continuation of the pullback in the channel after consolidation under the 38.2% retracement level.
-------------------
Share your opinion in the comments and support the idea with like. Thanks for your support!
NZDUSD Discretional Analysis: It’s Gonna Drop, BroNo deep analysis here, just think it’ll go lower. If I’m right, I make some, if not, I lose.
Just my opinion, not financial advice.

NZDUSD sell to 0.56423NZDUSD will be Bearish till it gets to 0.56423... this could be a discounted price of contract for the buyers to step in and Take over ...

Potential bearish breakout?NZD/USD is reacting off the support level which is a pullback support and could breakout from this level to our take profit.
Entry: 0.5712
Why we like it:
There is a pullback support level that is slightly above the 61.8% Fibonacci projection.
Stop loss: 0.5735
Why we like it:
There is a pullback resistance level.
Take profit: 0.5680
Why we like it:
There is a pullback support level that aligns with the 161.8% Fibonacci extension.
Enjoying your TradingView experience? Review us!
Please be advised that the information presented on TradingView is provided to Vantage (‘Vantage Global Limited’, ‘we’) by a third-party provider (‘Everest Fortune Group’). Please be reminded that you are solely responsible for the trading decisions on your account. There is a very high degree of risk involved in trading. Any information and/or content is intended entirely for research, educational and informational purposes only and does not constitute investment or consultation advice or investment strategy. The information is not tailored to the investment needs of any specific person and therefore does not involve a consideration of any of the investment objectives, financial situation or needs of any viewer that may receive it. Kindly also note that past performance is not a reliable indicator of future results. Actual results may differ materially from those anticipated in forward-looking or past performance statements. We assume no liability as to the accuracy or completeness of any of the information and/or content provided herein and the Company cannot be held responsible for any omission, mistake nor for any loss or damage including without limitation to any loss of profit which may arise from reliance on any information supplied by Everest Fortune Group.

NZD/USD: Uptrend Restored – Next Stop: Weekly ResistanceWelcome back! Let me know your thoughts in the comments!
** NZDUSD Analysis !
We recommend that you keep this pair on your watchlist and enter when the entry criteria of your strategy is met.
Please support this idea with a LIKE and COMMENT if you find it useful and Click "Follow" on our profile if you'd like these trade ideas delivered straight to your email in the future.
Thanks for your continued support! Welcome back! Let me know your thoughts in the comments!

NZDUSD sell to buy No doubt 🧐 liquidity is telling us that we will start the week with short, for Scalpers sell opportunity for you for intraday it is time we wait
In fx market the patient dog eats the fattest bone 🍗

SELL Signal – NZD/USD - Targeting 226 PipsEntry: 0.5764
TP: 0.5538
SL: 0.5889
Risk/Reward: 2.32
Reasoning:
Monetary Divergence: The RBNZ has paused rate hikes, weakening NZD appeal, while USD strength is supported by higher U.S. Treasury yields and reduced Fed rate-cut expectations.
Economic Weakness: New Zealand faces slowing growth, a weak housing market, and reduced demand from China.
Bearish Momentum: NZD/USD recently broke two long-term support levels, suggesting further downside toward the 0.5538 demand zone.
Strong USD: Global monetary easing (e.g., Switzerland, Canada, ECB) and policy concerns are bolstering the USD, further pressuring NZD.

BUY NZDUSDThe NZDUSD showed it would pump up there aroud the key level that has already failed to handle.
Trade what you see and not what you think.
We are now given a new move from down. Observing the structure is bull, it creates HH,HL,HH,HL.....
Now let us wait if the price will feach the area we are expecting to.
This is not a financial advice

BUY NZD/USDNZD/USD has reached a key area of support and shows strong signs of reversing back into consolidation while also being oversold.
