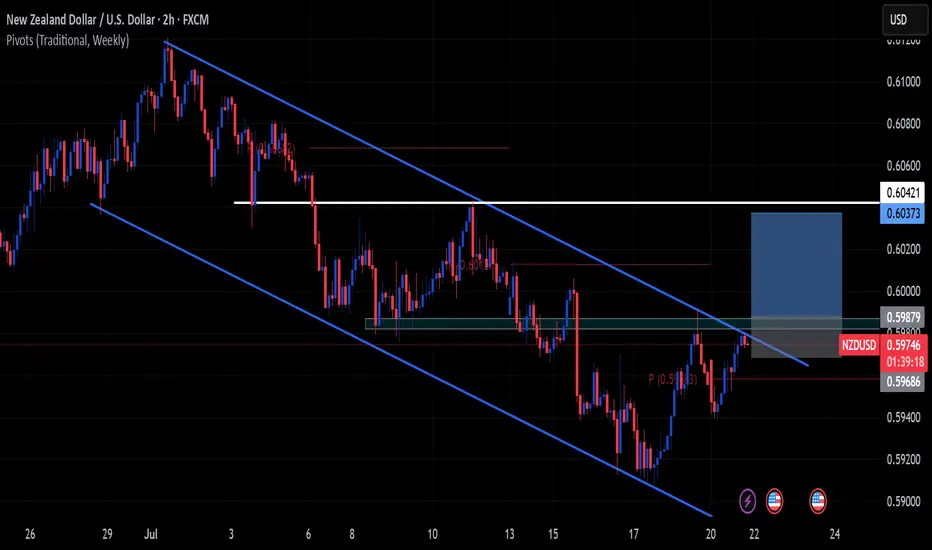
NZDUSD Buy C setupHello traders this is a nice setup but it doesn't have that much confluence!!
Clear!!
Not sweet because of how far the pivot point is from my Sl.
we aslo have a weak Head and Shoulders at the bottom I hope you can see it.
USDNZD trade ideas
NZDUSD SELLBy utilizing levels, historical patterns, we can formulate a hypothesis that the market might follow a similar trajectory if bearish sentiment prevails.

nzdusd long tradein my opinion this is a good trade with a good r/r
hope it will hit the target
consider this is my trade not your trade
i just like to share my trades with world

NZDUSD Faces Further Downside Amid Renewed Tariff ConcernsNZDUSD Faces Further Downside Amid Renewed Tariff Concerns
In July, NZDUSD created a false breakout after printing a new higher high.
Initially, the pair appeared set for further gains, but the U.S. dollar regained strength following stronger-than-expected Non-Farm Payrolls (NFP) data.
Today, market sentiment remains fragile as anticipation builds around President Trump's upcoming remarks on tariffs.
Our analysis suggests that the broader outlook remains unchanged—NZDUSD is still positioned for further downside.
You may find more details in the chart!
Thank you and Good Luck!
❤️PS: Please support with a like or comment if you find this analysis useful for your trading day❤️
Disclosure: I am part of Trade Nation's Influencer program and receive a monthly fee for using their TradingView charts in my analysis.

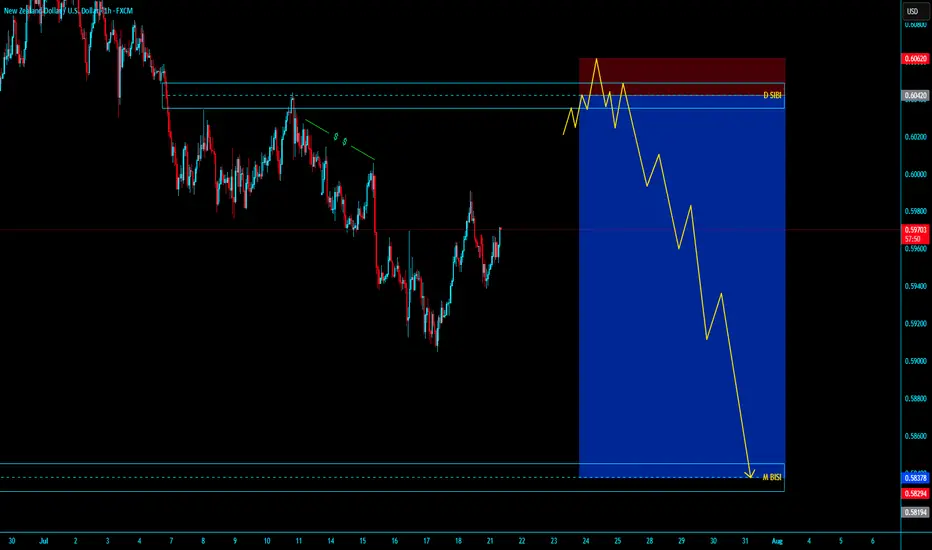
# NZDUSD SHORT SELLING# NZDUSD SHORT SELLING
Market IN monthly SIBI in Daily TF MSS , in Daily SIBI Going to LTF after Valid MSS with Run on Stop either Engage dose not Matter . entry with Tight SL and LONG Target Open
- HELLO..................
ENTYR PRICE - 0.60418
SL 20 PIPS - 0.60618
TARGET MONTHLY BISI - 0.58376
I THINK ITS OVER NIGHT HOLDING
JUST HOLD AND ENJOYYYYYYYYYYYYYYYYYYYYYYYYYYYYYYYYYYYYYYYYY
NZD/USD BUYERS WILL DOMINATE THE MARKET|LONG
NZD/USD SIGNAL
Trade Direction: long
Entry Level: 0.595
Target Level: 0.608
Stop Loss: 0.587
RISK PROFILE
Risk level: medium
Suggested risk: 1%
Timeframe: 1D
Disclosure: I am part of Trade Nation's Influencer program and receive a monthly fee for using their TradingView charts in my analysis.
✅LIKE AND COMMENT MY IDEAS✅

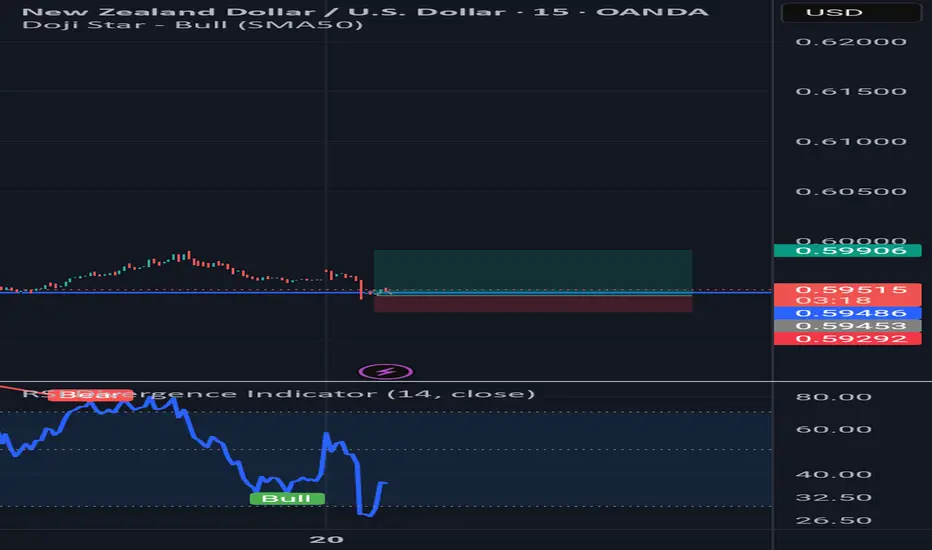
NZD/USD 1-Target 0.59900 2- Target 0.59328Monday's target no. 1, then target no. 2, meaning continued weakening of the NZD against the USD.
Tools:
- real volume (proper interpretation)
- Fibonacci expansion ABC
- Fibonacci retracement
- volume support and resistance levels
- oversold/overbought index
- candlestick patterns

Break Even Here Please The market has moved some pips from our original entry, its well advised to breakeven and take a chill for the day.
I hope you enjoy my setup so far. It's simple and easy to understand.

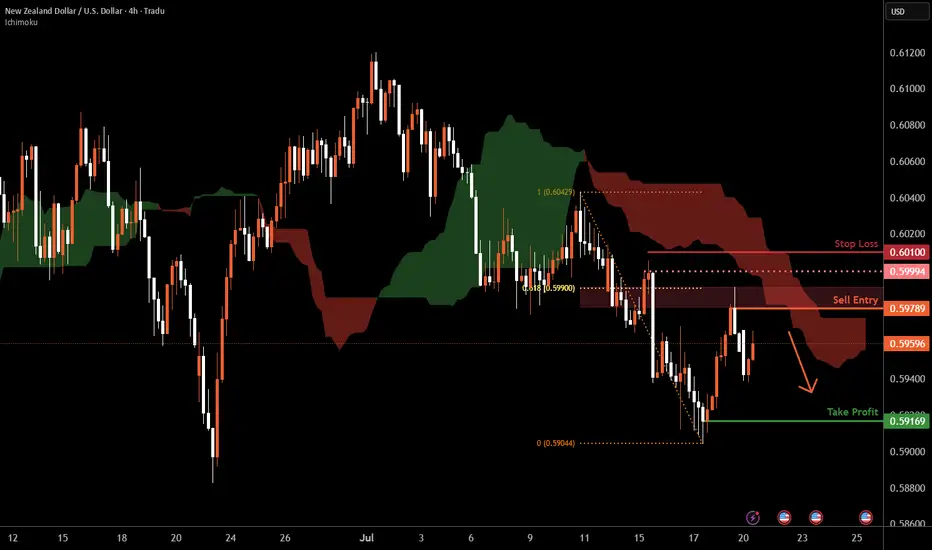
Kiwi H4 | Swing-high resistance at 61.8% Fibonacci retracementThe Kiwi (NZD/USD) is rising towards a swing-high resistance and could potentially reverse off this level to drop lower.
Sell entry is at 0.5978 which is a swing-high resistance that aligns closely with the 61.8% Fibonacci retracement.
Stop loss is at 0.6010 which is a level that sits above a swing-high resistance.
Take profit is at 0.5916 which is a swing-low support.
High Risk Investment Warning
Trading Forex/CFDs on margin carries a high level of risk and may not be suitable for all investors. Leverage can work against you.
Stratos Markets Limited (tradu.com ):
CFDs are complex instruments and come with a high risk of losing money rapidly due to leverage. 66% of retail investor accounts lose money when trading CFDs with this provider. You should consider whether you understand how CFDs work and whether you can afford to take the high risk of losing your money.
Stratos Europe Ltd (tradu.com ):
CFDs are complex instruments and come with a high risk of losing money rapidly due to leverage. 66% of retail investor accounts lose money when trading CFDs with this provider. You should consider whether you understand how CFDs work and whether you can afford to take the high risk of losing your money.
Stratos Global LLC (tradu.com ):
Losses can exceed deposits.
Please be advised that the information presented on TradingView is provided to Tradu (‘Company’, ‘we’) by a third-party provider (‘TFA Global Pte Ltd’). Please be reminded that you are solely responsible for the trading decisions on your account. There is a very high degree of risk involved in trading. Any information and/or content is intended entirely for research, educational and informational purposes only and does not constitute investment or consultation advice or investment strategy. The information is not tailored to the investment needs of any specific person and therefore does not involve a consideration of any of the investment objectives, financial situation or needs of any viewer that may receive it. Kindly also note that past performance is not a reliable indicator of future results. Actual results may differ materially from those anticipated in forward-looking or past performance statements. We assume no liability as to the accuracy or completeness of any of the information and/or content provided herein and the Company cannot be held responsible for any omission, mistake nor for any loss or damage including without limitation to any loss of profit which may arise from reliance on any information supplied by TFA Global Pte Ltd.
The speaker(s) is neither an employee, agent nor representative of Tradu and is therefore acting independently. The opinions given are their own, constitute general market commentary, and do not constitute the opinion or advice of Tradu or any form of personal or investment advice. Tradu neither endorses nor guarantees offerings of third-party speakers, nor is Tradu responsible for the content, veracity or opinions of third-party speakers, presenters or participants.
NZDUSD in Downtrend ContinuationSell Limit
Entry Price 0.5978
Stop Loss 0.6013
Risk 1%
Lot Size 0.70
TP (1RR) 0.5942
TP (2.7RR) 0.5884

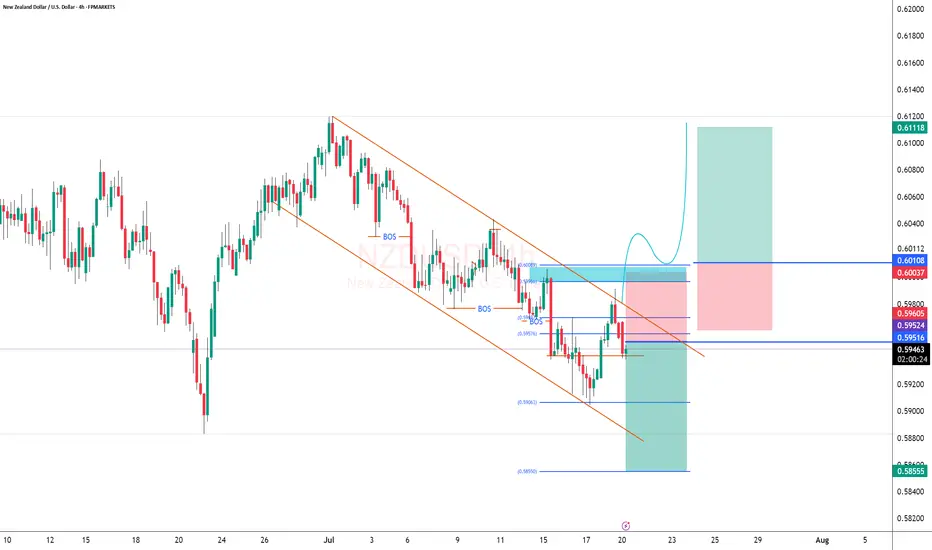
NZD/USD to GO DOWN AMOTHER 86 PIPS?Wit hprice still firmly in our down channel creating new highs and lows, we would want to see price continue on its downward projection with entry @ 0.59515 giving us a drop down to at least 0.58555 with stop loss @0.60037
Let's Go from here It's another good time to find a buy position.
Please follow for more updates and encourage my efforts
NZDUSD - Elliott Wave: High-Probability Reversal Zone Ahead!NZDUSD – Elliott Wave Roadmap
3Day Chart
Every move has been unfolding with precision — true to Elliott Wave Theory.
We're in the final leg of a massive A-B-C correction:
- Wave A and the complex Wave B (WXY) are complete.
- Wave C is now in play, targeting the highs of Wave A.
We’ve just seen a clean 5-wave advance (wave 1 leading diagonal).
Now expecting a classic ABC correction for wave 2, into our reversal zone (38.2–61.8% Fib).
🔍 Once price enters this zone, we’ll drop to lower timeframes and:
- Look for bullish confirmations (BOS, trendline break)
- Set entries with stops below corrective lows
- Targets: 0.63 (500 pips) and 0.65 (700 pips)
📌 Why is the buy zone so big?
It’s a higher timeframe zone. Once price enters, we zoom into lower timeframes for precise entries. The zone simply tells us when to focus, not where to blindly buy.
This is the Wave 3 generation point — and that’s where the real move begins.
Plan your trade. Watch for the setup. Execute with confidence.
Goodluck and as always, Trade Safe!
NZDUSD 12H Chart - Looking for this ABC correction for wave 2

NZDUSD TRADE SETUPWait for retest the entry level and bearish momentum then take a trade for Sell otherwise skip this setup

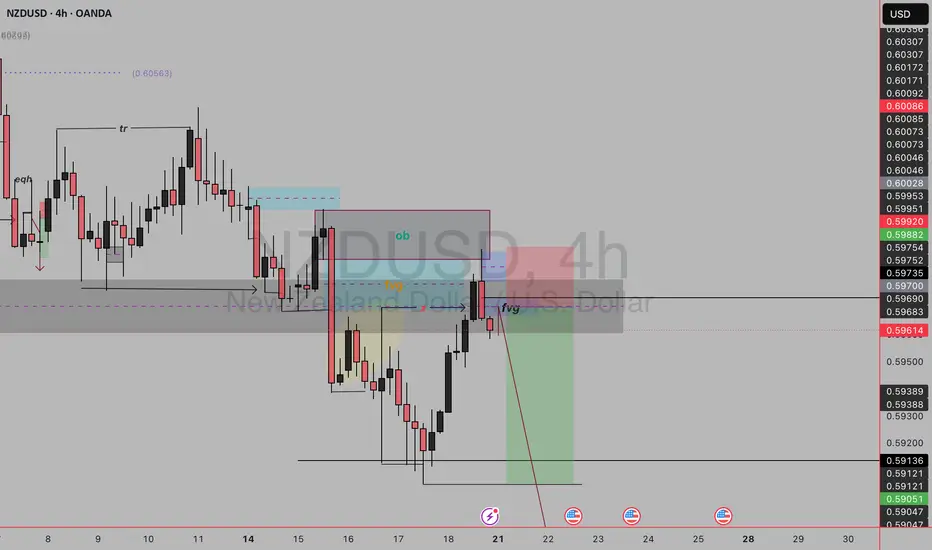
NZDUSD SELL SETUP✅Market Structure: Bearish.
Clear lower highs and lower lows.
Price retraced into a premium zone after the last strong sell-off.
✅Key Elements in the Setup
1.OB (Order Block) – Blue zone:
This is the last bullish candle before a strong bearish move.
Acts as a supply zone.
Price tapped into it before reacting.
2.FVG (Fair Value Gap) – Highlighted (yellow & blue):
Imbalance in price action (inefficient movement).
You marked this as confluence — price filled the FVG and rejected.
3.Liquidity Grab (EQH):
Equal highs were taken out — classic liquidity sweep.
This hints at a manipulation before the real move.
✅Entry Trigger:
Price pushed into the OB + FVG zone.
Rejection candle + break of structure on the lower timeframe.
You entered after that shift.
✅Trade Components
Entry: After price rejects OB + FVG area.
Stop Loss: Above OB and liquidity sweep (~0.60086).
Take Profit: Into previous low (~0.59047) or a bit lower for extended target.
Risk:Reward: Very healthy, above 1:4.
✅ Confluences Supporting the Sell
Premium pricing (above 50% of swing range).
Price filled FVG + tapped OB.
Liquidity above EQH taken.
Sharp rejection from that zone.
FVG left behind on the way down = price likely to seek lower inefficiencies.
NZDUSD keep bullish The main direction is bullish
-Price has rebounded from the 4H Order Block (OB), showing strong bullish intent and forming a Change of Character (CHOCH).
- Currently, the price is pulling back and is expected to retest the 1H Fair Value Gap (FVG) around 0.5940–0.5947, which aligns with a liquidity zone.
- A successful rejection from the FVG followed by a break and close above the descending trendline will strengthen the bullish structure and confirm continuation.
We have to enter points:
1- 0.5947 Where have a liquidity
2- 0.5940 Where FVG
Targets:
1- Resistance 1 (around 0.6040) – First take-profit area. Watch for candle behavior here (e.g.,
long upper wick or rejection); a close below could signal a short-term pullback.
2- Resistance 2 (around 0.6118) – Final bullish target if momentum continues.

NZDUSD SHORT SELLING # NZDUSD SHORT SELLING
Market IN monthly SIBI in Daily TF MSS , in Daily SIBI Going to LTF after Valid MSS with Run on Stop either Engage dose not Matter . entry with Tight SL and LONG Target Open
NZDUSD Bullish Pressure coming innOANDA:NZDUSD have finally closed above 0.59485 which is weekly support and NZDUSD is respecting it nicely, now with bullish pressure came it: it will touch 0.60060 as its the most important level at the moment, if price closed above 0.60060 making it good support then next level is 0.60345 if price kept bullish.
Key levels to look are:
0.60060
0.60345
and finally 0.60633 as weekly high.
0.60633 as Strong Resistance.
This is good trade, don't overload your risk like greedy, be disciplined trader.
I manage trade on daily basis.
Use proper risk management
Looks like good trade.
Lets monitor.
Use proper risk management.
Disclaimer: only idea, not advice

NZD/USD is on the verge of a dropBased on the fractal structure and the highs and lows in the market, a trend reversal on NZD/USD is confirmed — a drop is coming.
Exit at the marked target, or secure the majority of your profits.

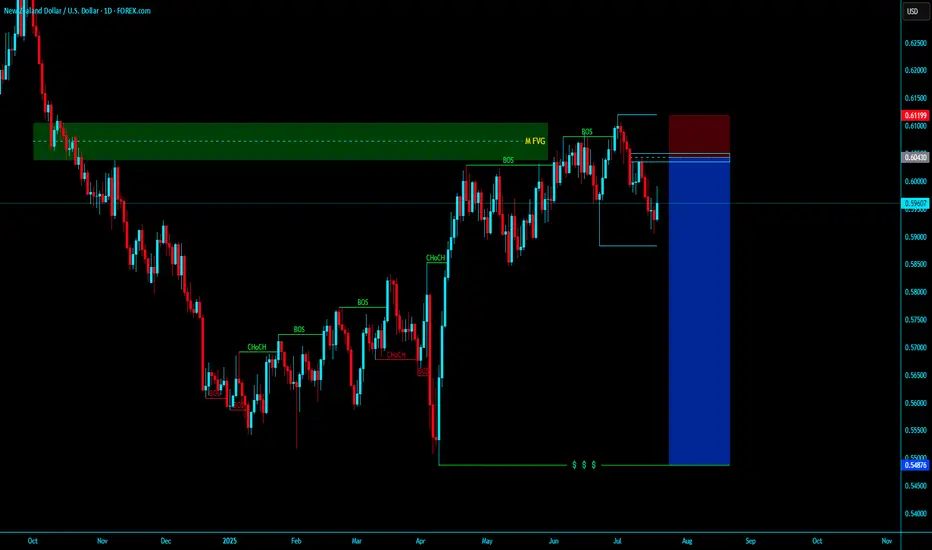
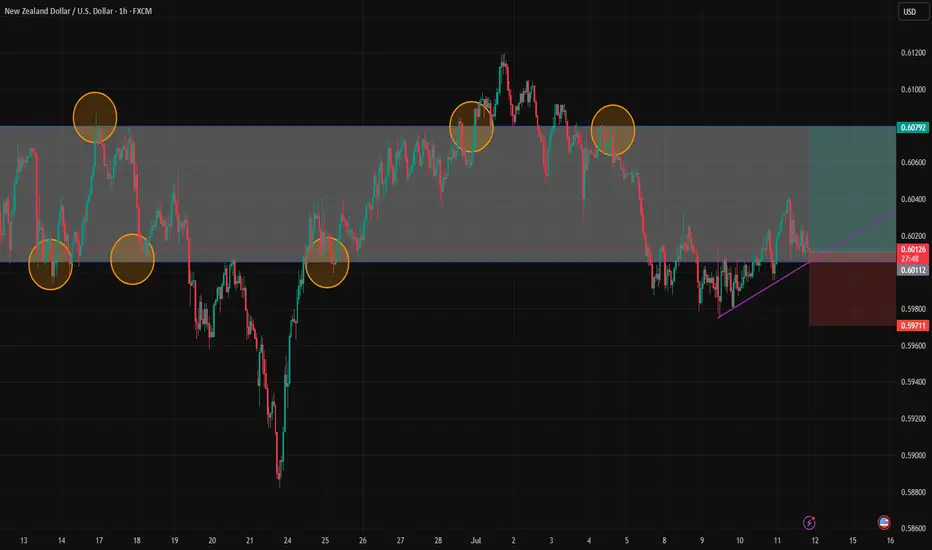
NZD/USD Technical Analysis | Smart Money Perspective🧠 NZD/USD Technical Analysis | Smart Money Perspective
On the current NZD/USD chart, price is trading around 0.5960, positioned between a clearly defined resistance zone (0.6130–0.6150) and a support zone (0.5890–0.5900).
We can observe the following key technical elements:
🔹 1. Liquidity Sweep
Price recently broke below the previous swing low near 0.5900, tapping into a pool of sell-side liquidity. This movement is commonly interpreted as a liquidity grab, where institutions manipulate price to trigger retail stop losses before reversing.
🔹 2. Double Bottom Formation
The chart indicates a potential double bottom forming at the support level — a classic accumulation signal. This pattern suggests buyers may be stepping in after liquidity has been taken out, anticipating a reversal.
🔹 3. Fair Value Gap (FVG)
An FVG (imbalance) is visible in the range of 0.5985 to 0.6015. This inefficiency was created by a sharp bearish move, leaving price action unbalanced. Price is now expected to retrace into this area to rebalance orders — a common smart money behavior.
🔹 4. Market Structure Outlook
If the double bottom confirms with a bullish break of structure above 0.5980, we could expect a continuation toward:
First Target: FVG zone around 0.6015
Second Target: Major resistance near 0.6150, where past distribution occurred.
✅ Conclusion
This setup combines key smart money concepts:
Liquidity grab below support
Accumulation phase at demand
FVG as target
Potential bullish market structure shift
Traders should monitor price action around the support zone for confirmation (e.g., bullish engulfing or break of short-term highs) before entering long positions. Targets remain at the FVG and resistance zones, but risk management is essential in case of a deeper sweep or macroeconomic catalyst.

Buy NUWhile price rejected up and down value area, price currently in a trendline formation. Now price formed a pin rejecting the lower trendline. Combining the value area low with rejection, I anticipate a buy, with SL in swing low, targeting value area high.
NZD-USD Will Go Down! Sell!
Hello,Traders!
NZD-USD already made a retest
Of the horizontal resistance
Of 0.5992 from where we
Are seeing a bearish reaction
And we will be expecting a
Further bearish move down
Sell!
Comment and subscribe to help us grow!
Check out other forecasts below too!
Disclosure: I am part of Trade Nation's Influencer program and receive a monthly fee for using their TradingView charts in my analysis.

Sell NZDUSD based on N patternNZD/USD has entered a bearish phase.
A sell opportunity will come after a break and retest of the 50% level.
