NZD/USD (4H time frame)..NZD/USD (4H time frame), here's the analysis:
---
📉 Chart Analysis Summary:
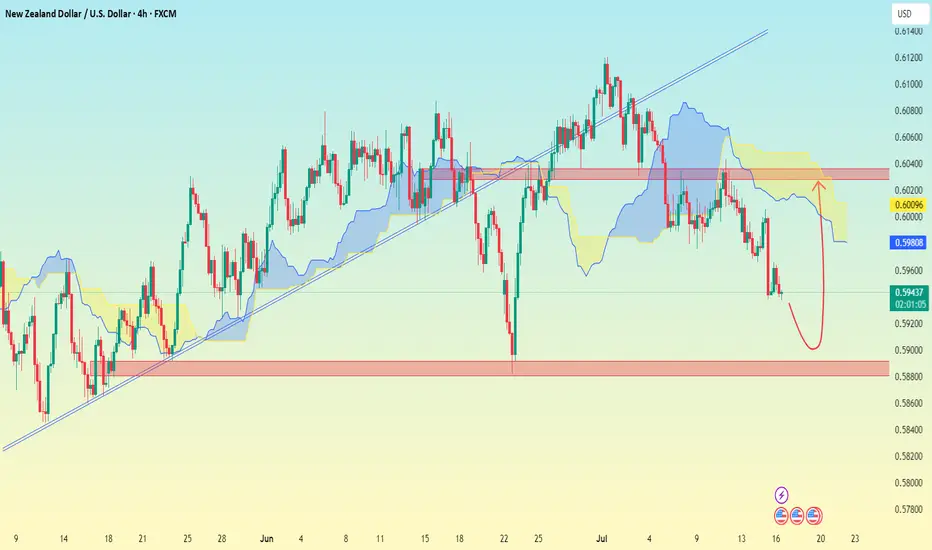
Price has broken below the trendline and is currently below the Ichimoku cloud, indicating bearish momentum.
A bearish move is likely continuing toward a strong support zone.
A rebound is drawn on my analysis suggesting a possible bounce after reaching a key demand zone.
---
🎯 Target Levels:
🔻 Bearish Move (Primary Setup):
Sell from: Current zone around 0.59400
Target 1: 0.59000
Target 2 (Main Support Zone): 0.58600
Stop Loss: Above the red horizontal resistance — around 0.60000
---
🔁 Possible Bounce Scenario (Secondary Setup):
If price hits the 0.58600 zone and shows reversal signs:
Buy from: 0.58600 – 0.58800
Target: 0.59800 – 0.60000
---
⚠ Key Zones:
🔴 Resistance: 0.60000 – 0.60200
🟢 Support: 0.58600 – 0.58800
USDNZD trade ideas

NZDUSD BEARISH 16-7-2025trend : bearish
divergence : n/a
reversal : n/a
continuation : lhs & lls
harmonics : n/a
bias : bearish

NZD USD longA correction could occur to gather more momentum for the continuation of its downward movement

NZDUSD H4 SHORT SETUP: 15 JULY 2025Based on the 4-hour chart of NZD/USD, here's a technical analysis of the current setup:
\---
🕒 Timeframe: 4H
💱 Pair: NZD/USD
📉 Current Price: Around 0.59430
---
🔍 Chart Structure and Analysis:
🔻 Trend:
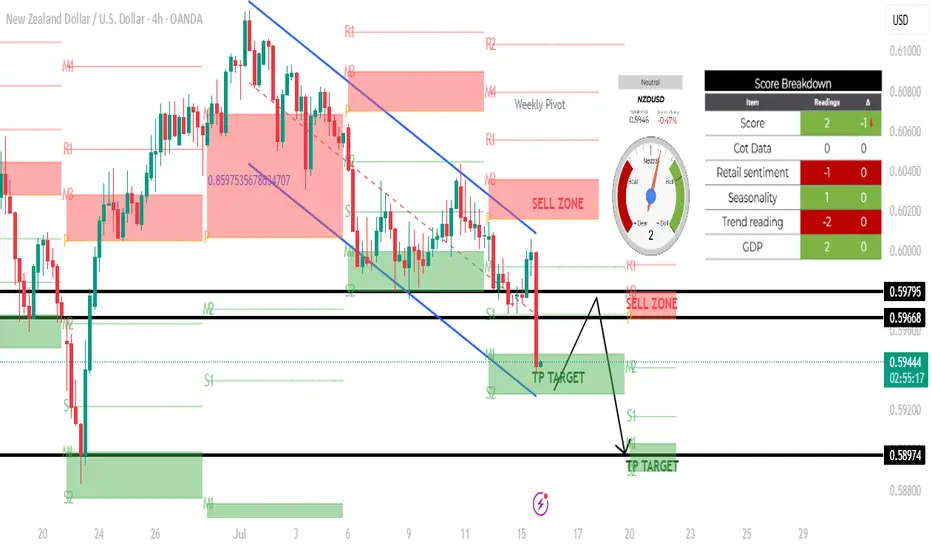
The market is in a clear downtrend, as indicated by the descending channel and the strong bearish candle that broke below the previous support zone.
Sellers are currently in control.
---
📍 Key Zones:
🔴 Sell Zones (Supply):
0.59668 – 0.59795: Marked as a supply/sell zone.
Price previously reacted here and dropped sharply. Expect selling pressure if price retests this zone.
---
🟢 Take Profit (TP) Targets / Demand Zones:
1. TP Target 1: Around 0.59430 – 0.59300 — Already hit; slight bounce seen.
2. TP Target 2: 0.58974 — This is the next key target/support zone, which aligns with a prior low.
---
🔁 Possible Scenarios:
✅ Scenario 1: Continuation Bearish
If price fails to break back above the 0.59668 resistance, it will likely:
Consolidate below,
Retest and reject again,
Then head lower toward 0.58974 (TP2).
⚠ Scenario 2: Short-Term Retracement
If there's a bounce (as seen by the current candle's wick), price may retest the sell zone at 0.59668–0.59795.
This could present another short entry opportunity with a target at 0.58974.
---
📊 Confluences:
Weekly Pivot + Structure Resistance near 0.59668: Strengthens the sell zone.
Strong Bearish Momentum Candle: Signals potential for continuation.
TP Zone overlaps with S2 level: Providing possible support/bounce area.

NZDUSD BUYSI’m looking to take buys on NZD/USD because the overall trend remains bullish. We’ve reached a strong technical level, and the new monthly candle has retraced into a key discount zone, offering a favorable entry. This pullback aligns with the broader upward momentum, so my bias is to the upside. That’s why I’m entering long from here—buying the dip within the context of a continuing uptrend.

IS USD STRENGTH BACK? or IS IT JUST A PULLBACK?All the information you need to find a high probability trade are in front of you on the charts so build your trading decisions on 'the facts' of the chart NOT what you think or what you want to happen or even what you heard will happen. If you have enough facts telling you to trade in a certain direction and therefore enough confluence to take a trade, then this is how you will gain consistency in you trading and build confidence. Check out my trade idea!!
www.tradingview.com

NZDUSD Pullback in Play – Head & Shoulders Signals More DownsideNZDUSD ( OANDA:NZDUSD ) is currently trading near the Resistance zone($0.612-$0.605) and has also managed to break the Support zone($0.604-$0.602) . We consider the Support zone as the neckline of the Head and Shoulders Pattern .
In terms of classic technical analysis , NZDUSD has managed to form a Head and Shoulders Pattern .
I expect NZDUSD to decline towards the Support zone($0.5968-$0.5946) after completing the pullback .
Note: Stop Loss(SL): $0.6062
Please respect each other's ideas and express them politely if you agree or disagree.
New Zealand Dollar/ U.S. Dollar Analyze (NZDUSD), 1-hour time frame.
Be sure to follow the updated ideas.
Do not forget to put a Stop loss for your positions (For every position you want to open).
Please follow your strategy and updates; this is just my Idea, and I will gladly see your ideas in this post.
Please do not forget the ✅' like '✅ button 🙏😊 & Share it with your friends; thanks, and Trade safe.

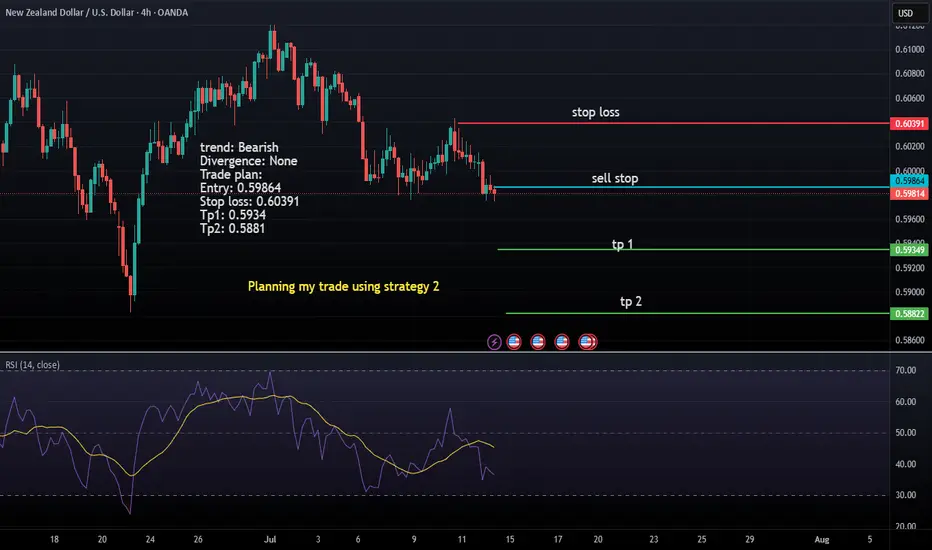
Bearish trend in NZDUSD pairA Bearish trend in the NZDUSD pair clear shows no divergence so I will short it and booking my tp 1 & tp 2
30Pips up from here is likely achievable Stay tuned as I go for instant execution for 30pips from here. Up of buy position.
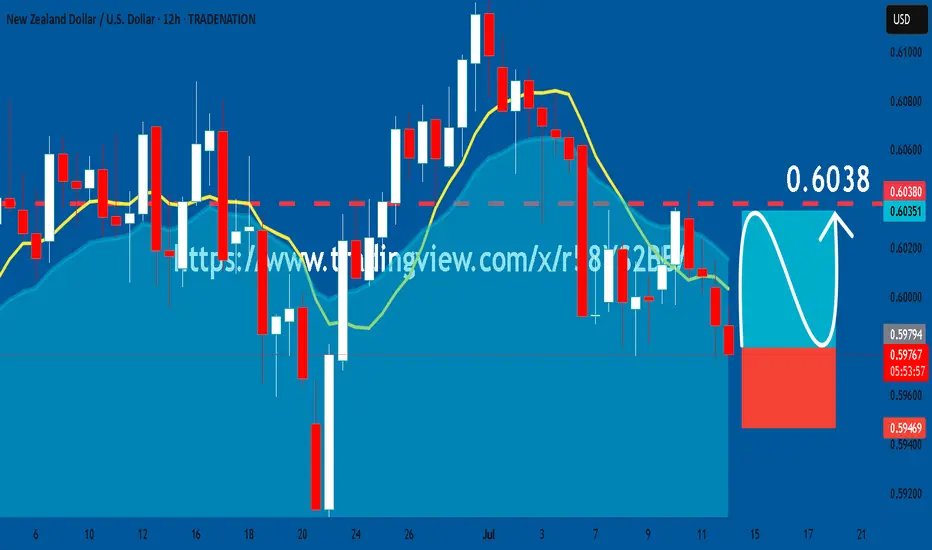
NZDUSD: Bullish Continuation & Long Trade
NZDUSD
- Classic bullish setup
- Our team expects bullish continuation
SUGGESTED TRADE:
Swing Trade
Long NZDUSD
Entry Point - 0.5978
Stop Loss - 0.5946
Take Profit - 0.6038
Our Risk - 1%
Start protection of your profits from lower levels
Disclosure: I am part of Trade Nation's Influencer program and receive a monthly fee for using their TradingView charts in my analysis.
❤️ Please, support our work with like & comment! ❤️
NZDUSD Bearish - SELL SetupNZDUSD is making series of LH and LLs. there is no divergence therofore bears will remain in control of the market. market has retraced to the the fib level of 0.382 and took rejection from the resistance level marked. futher market is moving in channel which is a continuation pattern. we are all set to take sell entry instantly with our SL defined above last LH.
manage your risk with a R:R of 1:2

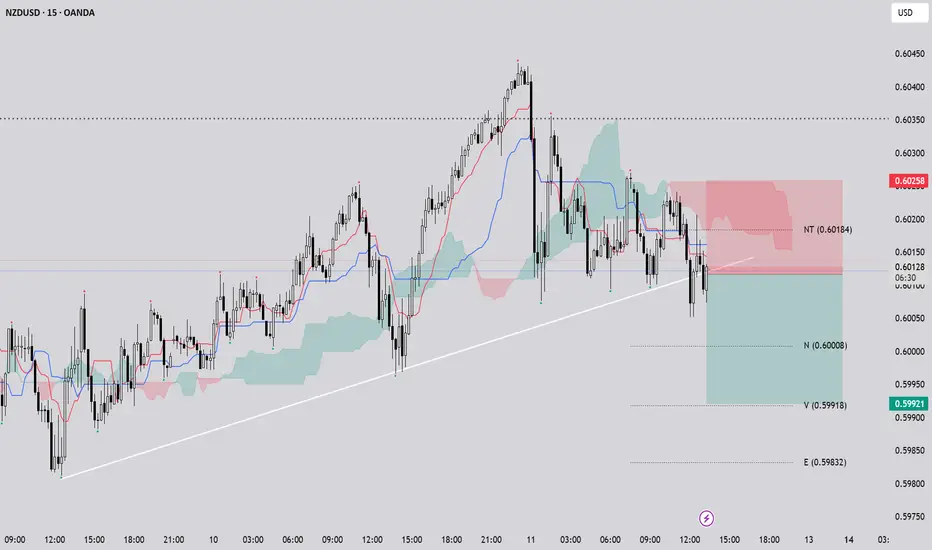
NZD USD / M15 / SHORTOn the 15-minute chart of NZDUSD, a shift in market structure is evident as the prior uptrend—previously supported by ascending trendlines—has been broken. The Ichimoku cloud (Kumo) outlines key support and resistance zones, and price movement outside the cloud reinforces the weakening of the bullish momentum. The crossover between the Tenkan-sen and Kijun-sen lines aligns with the wave structure, signaling a potential bearish phase. This combination of technical signals suggests that the market may be transitioning into a corrective move or a short-term downtrend, presenting a potential opportunity for short positions.
NZDUSD Potential LongsHere's how I'm watching NZDUSD for long trade setups. MSS+IND+RTO.
Stay reactive either ways

"Vault Breached! NZD/USD Bullish Loot (Live Heist)"🚨 "THE KIWI BANK HEIST" 🏦💰
NZD/USD Bullish Raid – Loot Fast Before the Cops Arrive!
🌟 Greetings, Money Bandits! 🌟 (Hola! Bonjour! Ciao! Konnichiwa!)
🔥 Thief Trading Intel:
The Vault is Open! 🏦➡️📈 – Price is bullish, but overbought.
Red Zone = Police Trap! 🚨 (Resistance/Reversal Risk)
Escape Plan: Take profits near 0.62400 (or bail early if traps trigger).
🔐 ENTRY: "BREAK IN NOW!"
"Buy the dip!" – Use 15M/30M swing lows for stealthy entries.
Set Alerts! ⏰ (Don’t miss the heist!)
🛑 STOP-LOSS: "THIEF’S SAFETY NET"
"Hide at 0.59500 (4H Swing Low)" – Adjust based on your loot size!
🎯 TARGET: "GRAB & VANISH!"
"0.62400 or escape earlier!" – Don’t get greedy; cops (bears) are lurking.
⚡ SCALPERS’ NOTE:
"Only steal LONG!" – Use trailing SL to protect your bag.
"Rich? Charge in! Poor? Wait for swings!"
📡 FUNDAMENTAL BACKUP:
"Kiwi is bullish… but check the news!" 📰 (COT, Macro Data, Sentiment)
⚠️ ALERT: Avoid trading during high-impact news – cops (volatility) love chaos!
💥 BOOST THIS HEIST! (Like & Share = More Loot!)
🚀 "Support the crew! Hit 👍, and let’s rob this market blind!" 💸🤝
Next heist coming soon… Stay tuned, bandits! 🏴☠️🎭

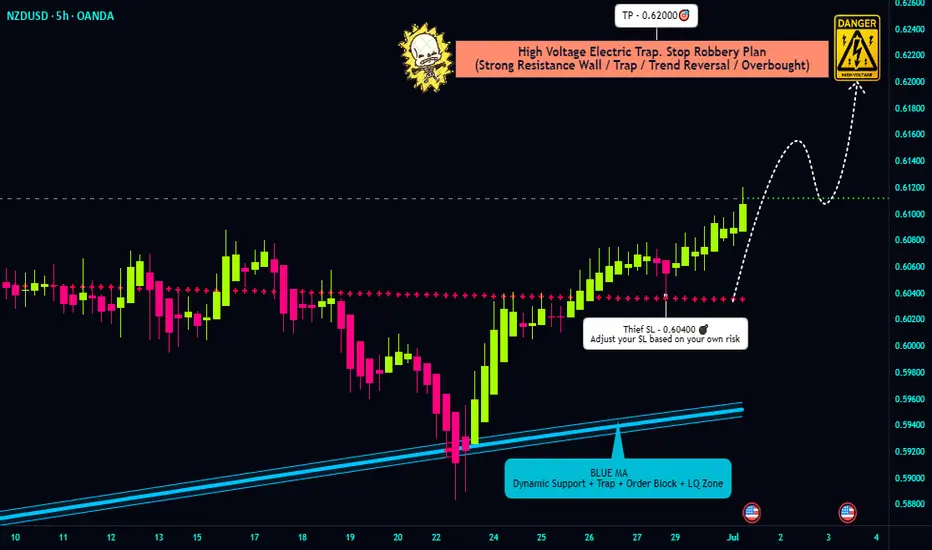
"NZD/USD Bullish Heist! Steal Pips Before the Reversal Trap! 🏴☠️ NZD/USD Kiwi Heist Masterplan – Steal the Bull Run! 💰
🌟 Hola, Money Makers & Market Marauders! 🌟
Welcome to the Thief Trading Style raid on the NZD/USD "The Kiwi" Forex vault. Follow the blueprint sketched in the chart for a bold long takeover — escape the high‑risk Yellow MA Zone before guards tighten!
🎯 Heist Blueprint
1. Entry 🚀
"The vault swings wide—yank that Bull loot at any price!"
Drop your buy-limit orders within the next 15–30 min (or at the latest swing low/high). Don’t sleep—set chart alerts for the perfect breach.
2. Stop‑Loss 🛑
Thief-style SL lurks at the nearest 5h swing‑low wick (≈ 0.60400) for intra‑day.
Adjust your SL based on your risk appetite, position size, and combo of orders.
3. Target 🎯
Aim to escape by 0.62000, or bail early for safety.
4. Scalpers’ Edge 🔍
Only rob on the long side. Big bankroll? Go all‑in. Prefer safety? Slide into the swing crew with a trailing SL to lock in your spoils.
🔍 Market Intel
Why the Kiwi Loot is Ripe:
Bullish momentum marches on, fueled by macroeconomic clues, COT data, sentiment shifts, inter-market moves — all pointing upward.
📚 For Full Recon:
Dive into the fundamental, macro, COT, quant, sentiment & intermarket intel — plus trend targets and scorecards. Check the data here 👉🔗🔗
⚠️ Caution Zone
News Watch & Position Safety:
Major news = guarded vault. Don't open new trades during release windows.
If you're in already, use trailing stops to shield your haul and lock in gains.
💪 Support the Crew
Smash that “Boost” to fuel our team and keep the raid running smooth. With Thief Trading Style, every day’s a payday.
🗓️ Stay tuned for the next Kiwi Heist – we’re just getting started. Happy robbing, legends! 🐱👤💥
NZDUSD beating for a robust up move soon The coming weekdmight be a more volatile week for NZD, Stay put, I feel take out for long positions when you see the Opportunities.

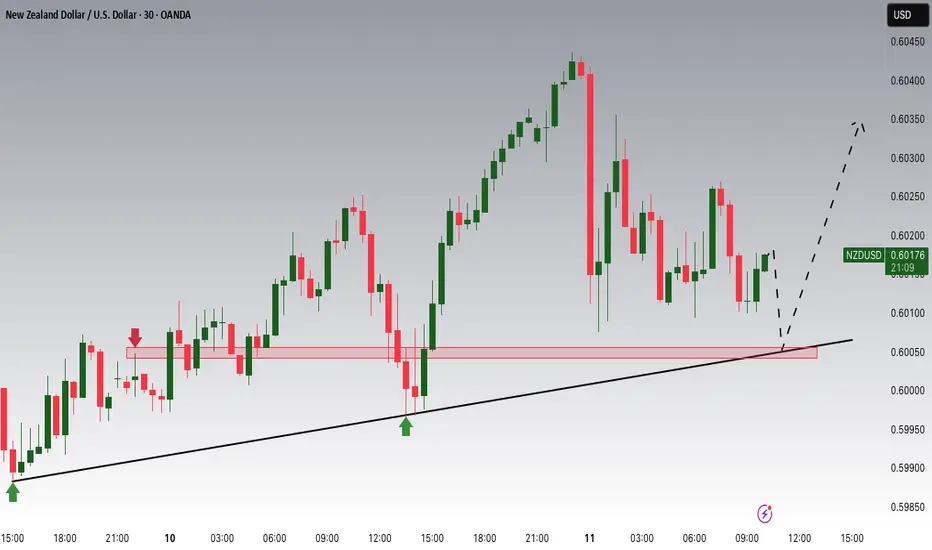
NZDUSD Potential UpsidesHey Traders, in today's trading session we are monitoring NZDUSD for a buying opportunity around 0.60000 zone, NZDUSD is trading in an uptrend and currently is in a correction phase in which it is approaching the trend at 0.60000 support and resistance area.
Trade safe, Joe.
NZD/USD H&S Reversal Pattern Clear,Short Setup To Get 150 Pips !Here is my opinion On NZD/USD On 4H T.F , If we checked the chart we will see that we have a very strong Historical res that forced the price many times to respect it and stay below it and now we have another good confirmation , we have a perfect reversal pattern and we have a clear closure below our neckline so the pattern already confirmed , i`m waiting the price to go up a little to retest my broken neckline and then we can enter a sell trade . only 1 case i will avoid this idea , if we have a daily closure agin above my res with clear closure .

NZDUSD: Bulls Will Push Higher
The analysis of the NZDUSD chart clearly shows us that the pair is finally about to go up due to the rising pressure from the buyers.
Disclosure: I am part of Trade Nation's Influencer program and receive a monthly fee for using their TradingView charts in my analysis.
❤️ Please, support our work with like & comment! ❤️

NZDUSDMarket structure suggests is preparing for its next move. The level will likely play a critical role in the upcoming direction.
If structure breaks and confirms the shift, a new bias might form after the retest.
