USDRUB 4HUSDRUB looks absolutely similar to indexes (RTS, SNP500). The only difference is that the pair will not go for new significant lows beyond 72
The same picture is happening with 6R1! (Russian Rubble Fu). If needed I will publish the subject chart.
USDRUB_TOD trade ideas


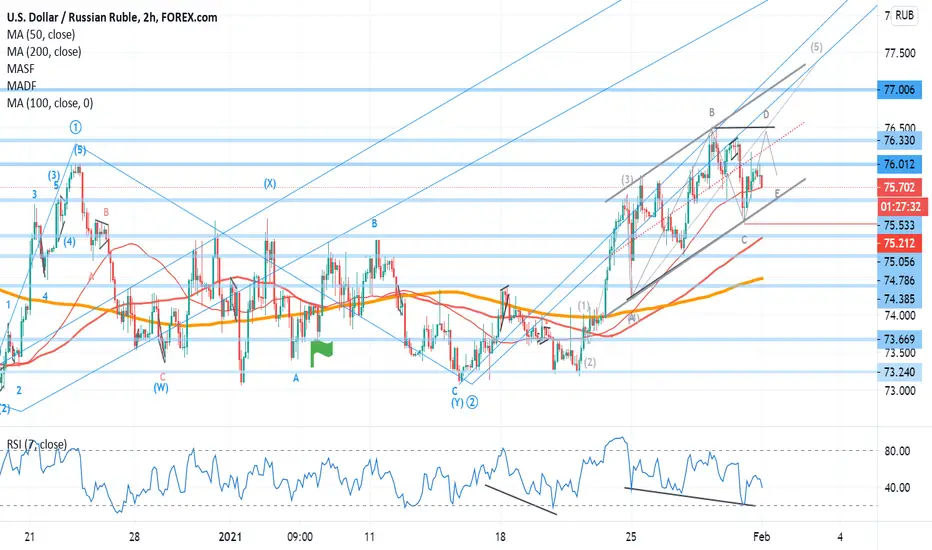
USDRUB. LONG POSITION1. Ascending Triangle (height is 16300)
2. Parallel Channel
The price reached the bottom of the Ascending Triangle which is located in the Parallel Channel. In addition, the price is also near the Parallel Channel bottom.
The first target: The price reaches about a half of the Triangle height
The second target: The price reaches the full height
Stop Loss: The Parallel Channel is broken and the price goes down

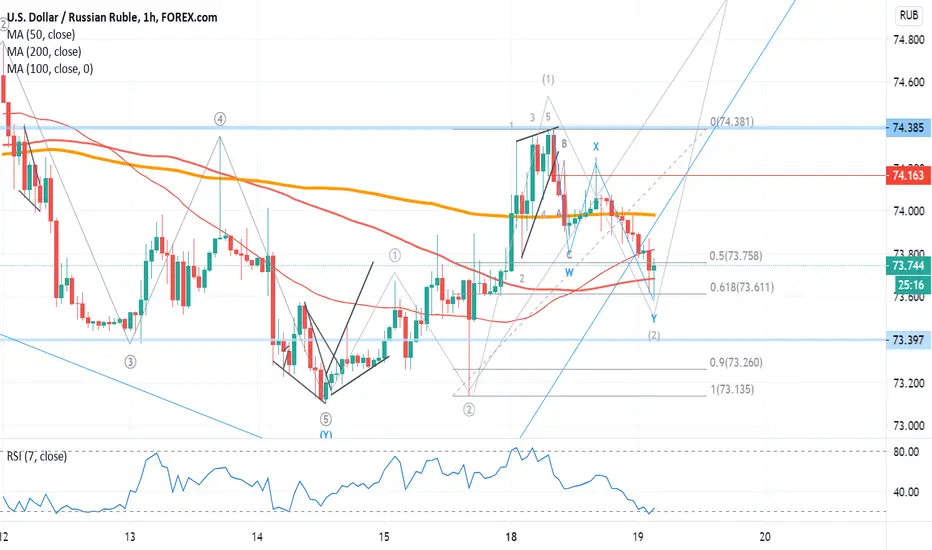
USDRUB could drop to RR 66-68 once below 72The RUB is getting stronger amid global weakness of USD (DXY) and rising crude oil.
Below RR 72 the move to the upside could be invalidated.
There is a chance that this drop could extend to the downside to build the large wave Y of WXY flat correction.
We saw such a drop in wave W before.
The minimum target is to hit the start point of wave X at RR 68.
The equal distance with wave W could send the USDRUB even deeper to RR 66.
I added the inverse UKOIL on the left scale.
It shows that RUB accumulated a huge divergence as oil is rising and RUB doesn't catch up with it.
Before last summer the correlation worked amazingly well.
Do you agree with this view? Please share your comments below.
Cheers!


USD/RUBThere is a monthly /weekly uptrend. The daily trend could possibly turn around here to start following the bullish momentum. Looking for buy opportunities on the bounce back.


USD/RUB Scheme IV
Psychological level acts as a local support level (might be long-term).
History shows that it used to act like a resistance.
Side trend with decreasing volatility is expected.
Pattern formations will occur within the geometric range of triangle.
Breaking above/below a line of fib channel is a signal of movement to the next series of fib ratios.
Scheme covers all unexpected oil factors.
Political factors such as undiplomatic tensions between Russia and "The West" also play significant role in this currency pair fluctuations.
Watch out for financial sanctions against Russian government bonds.
Crossing above red resistance downward line is a bad sign for Russian Ruble performance.
Price crossing below psychological level is a signal to start accumulating US Dollar in exponential lots.

USDRUB a perfect bounce at the 0.618 🦐USDRUB on the daily chart found a perfect bottom at the 0.618 Fibonacci level.
The price ends the retracement and started a new impulse.
According to Plancton's strategy, if the conditions will be satisfied, we can set a nice long order.
–––––
Follow the Shrimp 🦐
Keep in mind.
🟣 Purple structure -> Monthly structure.
🔴 Red structure -> Weekly structure.
🔵 Blue structure -> Daily structure.
🟡 Yellow structure -> 4h structure.
⚫️ Black structure -> <4h structure.
Here is the Plancton0618 technical analysis , please comment below if you have any question.
The ENTRY in the market will be taken only if the condition of the Plancton0618 strategy will trigger.

Traditional|USD/RUB|Long and shortLong and short USD/RUB
Activation of the transaction only when the blue zone is fixed/broken.
Working out local support and resistance levels in the consolidation zone.
The "forecast" tool is used for more noticeable display of % (for the place of the usual % scale) of the price change, I do not put the date and time of the transaction, only %.
The breakdown of the upper blue zone - long.
Breakdown of the lower blue zone - short.
Working out the stop when the price returns to the level after activation + fixing in the red zone.
Blue zones - activation zones.
Green zone - take zone.
The red zone - the stop zone.
Orange arrows indicate the direction of the take.
Red arrows indicate the direction of the stop.

USD is moving between 73 RUB & 76 RUB73 RUB good for going to USD & 76 RUB is a good time for Come back to RUB

Russian ruble's depreciation continuesRussian ruble's tests at around 80 seems to support the idea of further supply at and above this level. A further move towards 90 and above can be expected though the trend may turn afterwards.
Russia is an important commodity exports based country and oil is an important component of country's revenues. However, oil market outlook is not bullish and not supporting ruble's prospects.


Reverse of RUBSo, I see current situation so. The 5 wave in C was horizontal wedge, that point out to strong power of bears in Russian Forex market in Bull cycle, and, as a result, probably in nearest future we will watch sharp devaluation of RUB. This situation correlates with dynamics of Russian Government Bond Index. However there is probability, that is was wave 4 in C, but it seems to me low.