USDRUB_TOD trade ideas


USDRUB should correct to ~86 before uptrend resumesThe post-rebellion advance should be retraced. I was in that trend, it really felt smooth like butter, going up with no resistance at all. Means that too many longs have entered the game and a correction should follow.

💾 U.S. Dollar / Russian Ruble TOMI know you Forex people are all experts so there is no need for much "talking"/writing.
USDRUB goes above EMA50 weekly.
Bullish wave confirmed.
Potential targets are marked with a black dashed line on the chart.
This rally should last 2-3 months more or less.
Going below EMA50 invalidates most of the bullish momentum.
Namaste.

USDRUB People are asking for the update on USDRUB .
Nothing really has changed from my previous analysis. The only thing , I was sure that price will react on 87-89 range. But there is no sing of reversal from this level, so the next target is 95 rubles .
About the target for shorts. I still think that we going to drop lower than 50 rubles .
Second scenario is when price takes sellers liquidity. Because if we ask ourselves 'what price has made'? Correct answer is -- bearish break of structure (or change of character). So technically we are in a down trend from 2022. But after clear (in our example, bearish) choch price often moves higher to take previous high (121.50) as liquidity and only then price finally drops. I see this scenario all the time on 4h 15m or 5m charts.
If so target is 137 rubles for 1 US dollar.
But we have to stay positive and pray for 95 rubles level :)

possible bullish momentum three month timeframe fill candlebreaking highs on the 3 m timeframe and pushing to fill candle to the upside. becareful with who ever is buying cryptos we are about to see a dump occur for a discount price. anything against the dollar will go down
USDRUB to RGBI MonitorMonitor to compare ruble exchanre rate and bonds market/
See on relarion rubble to bonds

Mutiny Sends Ruble to Lowest in 15 MonthsMutiny Sends Ruble to Lowest in 15 Months
In one of the most turbulent trading sessions this year, the Russian ruble reached its lowest point against the US dollar in nearly 15 months on Monday. This decline followed the failed mutiny attempt by The Wagner group’s armed mercenaries over the weekend, which caused significant concern among traders. Initially catapulting to approximately 87 rubles per US dollar, the ruble later recovered some of its losses, settling at around 84.40, down 0.90% against the greenback.
The Wagner group, led by troops loyal to their leader, made an unexpected advancement toward Moscow, covering hundreds of miles before eventually reversing course. In a deal struck with the Kremlin, it is reported that the group's leader, Prigozhin, will go into exile in Belarus. This incident is regarded as the most significant challenge to Vladimir Putin's rule and could weaken his leadership.
The armed uprising also caused volatility in other markets. The international benchmark, Brent crude, rose by 0.8% to approximately $74 per barrel. The trading volume between the Russian ruble and Tether's USDT nearly quadrupled from $4 million on Saturday to $15 million on Sunday.
In other developments, the Japanese yen strengthened by 0.11% against the US dollar, trading at 143.50 per dollar. Vice Finance Minister for International Affairs, Masato Kanda, stated that Japan was not ruling out intervening in the currency markets again. He expressed concerns about the yen's rapid and one-sided depreciation against the dollar. Japan previously intervened in the foreign exchange markets in September and October of the previous year when the yen hit a 32-year low of nearly 152 per dollar.

USDRUBThe currency is now adopting a corrective upward behavior, including a final decline, for each three downward waves are formed, and the fourth wave ends

Long or Short ?hi every one
complete pullback to the trendline with 30% profit Potential
The information provided on this Page does not constitute investment advice, financial advice, trading advice, or any other sort of advice and you should not treat any of the website's content as such. this page does not recommend that any cryptocurrency should be bought, sold, or held by you. Do conduct your own due diligence and consult your financial advisor before making any investment decisio

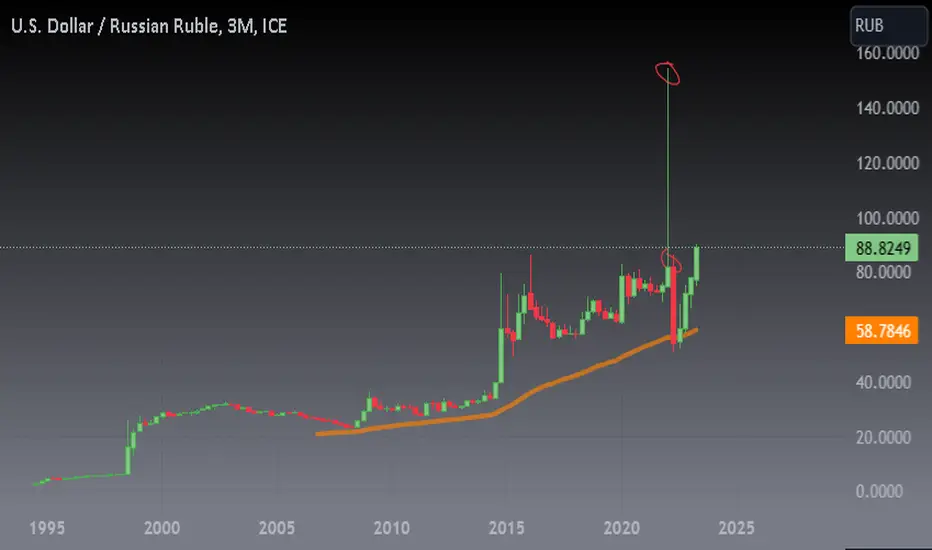
USDRUB going on 100 rub for 1 usdGlobally Russian ruble has logarithmic growing channel for previous 25 years. In previous year both boundaries of this channel was tested. Now the price accumulating under resistance 82.5 rub, and it had been tested for seven times previous 10 years. Correction will continue on average channel what means 100 rub at 01.01.2024.

USDRUB began to weakenI see in this graph how MOEX:USDRUB_TOM lose strength in main trend from 2022. Because of bullish signs from 29 may 2023 to today I can suggest rise to 82.6 value, but then downfall to 70-72 interval.
Globally I wait values >100 but I think this way will take ~150-180 days.

Volume Speaks VolumesLast time I saw volume spikes like this USD rallied hard against RUB. Will lightning strike twice?
I think 85:1 is a certainty. Beyond that, 90-100 but perhaps not this year. But the general theme remains the same - you don't pick a fight of finance with the Anglo's and expect to make it out in more than one piece.

USDRUB. TRIANGLEHello everybody!
Its update last idea.
There is no reason to strengthen. Only global speculation.

usd rubFirst Cypher , later ABCD. This analysis is not for trade , just wanted to see usd rub reaction to that analysis ))

- and here is the cooldown The writing was on the wall for this one -
>>rising wedge,
>>longest MACD green swing in this pairs history
>>lots of new analyses recently on this currency pair, which is usually dead, all of them bullish.
However, though a pullback was long overdue, I'd say fundamentally nothing has changed. At a glance, DXY is down a bit, albeit on strong support, US banking sector is under some stress, and interest rates/inflation continue to be a problem. However, obviously Russia is doing far worse.
My guess is, maybe 67-72 if it even comes to that and doesn't simply spring back up into the 80's.


USDRUB Non trending asset (order type buy and sell stop)As per my observation , USDRUB operating with in a zone instead of few exceptional higher high and lower low. I used support and resistance technique to take entry, on the basis of this buy and sell stop orders have been defined along with risk and reward.

💾 U.S. Dollar Bullish Against The Russian RubleWe are looking at a monthly chart, this is an extremely bullish setup.
USDRUB about to go up strong.
What we see here after the May-June 2022 crash is a recovery phase.
This recovery phase is completed December 2022 when USDRUB closes above EMA100, EMA10, EMA50 and EMA21 in the same month.
At this point the bullish bias is confirmed.
January 2023 was a month of consolidation, the session closed above the moving averages.
In February 2023 the bullish trend starts following the recovery.
In March 2023 we get bullish confirmation/continuation and in April the bullish bias intensifies.
After 4 months of slow but steady growth, the accumulation phase is reaching its end and we should see a reverse of the move that happened between May and June 2022.
As it crashed fast and strong, it will rise with force.
This analysis is supported by additional signals.
The MACD has gone bullish as it trades monthly above 0.
A very strong bullish cross took place and the histogram is full green.
It is also trading above Fib. resistance (now support).
Plenty of room available for additional growth.
The RSI can only be consider super strong when trading above 50 monthly, a great reading... Here is the chart:
Invalidation point
For this analysis to become invalid we would need to see a close monthly at least below EMA100 or $63. Technically speaking, the bullish bias still remains valid even with such a drop.
Prices would need to close below HKEX:50 for the current structure to breakdown.
Everything is pointing up.
I am sharing this update because many people showed interest in my previous analysis "USDRUB_TOM" from Dec. 2022, shared in the "Related Ideas".
Thanks a lot for your time and support.
Namaste.

The ruble - cylinder in a cylinder in which a rabbitGood evening ladies and gentlemen
for a long time I could not comprehend the schedule,
pondered for weeks, days and nights
on the full moon closer to Easter Sunday I realized:
USD\RUB is a livermore cylinder
more precisely, I would say a cylinder in a cylinder in which a rabbit
Nabiullina, of course, is still a magician, but the rabbit is real, and tricks are tricks.
I also have one in stock: if the forecast does not come true,
I will say that this dog ran over the keyboard and posted a post
Yes, exactly - not funny at all - but tricks - it's not jokes.
I told you, tricks are tricks.
Okay, the magic starts to end
I’ll go as soon as possible, the ficus is drying up, I need to water it.
Bye

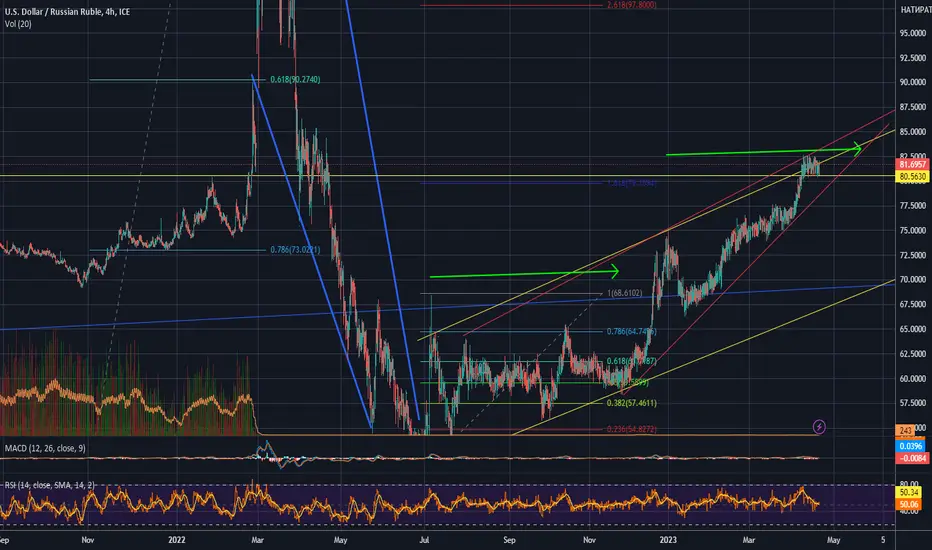
USDRUB updateUR has reached strong fibo level. It seems like it will continue to rise(big bullish candle). But I wouldn't be surprise if it start to revers now. Why?
Firstly it has touched strong resistance level that was holding price almost for 6 years. So its a strong level even though it was broken in February 2022.
Secondly. If you look at dollar index (green line) which represents strength of a dollar you will see that it's strongly bearish. As you can see from correlation UR and DI has positive correlation (if dollar falls ruble falls also) but with some delays. For example DI started to rise in May 2021 when UR had made big pish up only in November 2021.
I still see UR in sell zone. But April will be deciding month for Russian ruble (and most currencies).
If price will continue to rise next key levels are 87-89 and 90 rubles per 1 dollar. First target as I have mentioned in my previous analysis is 50 rub/dollar and max target is 30 rubles per dollar.
Let see how it'll go.
Good luck:)

Target 69.16Following weekly chart.
I got 2 long signals from indicators.
TP1 69.16
TP2 78.35
SL 56.8 please wait for the weekly close.
