The USDSEK Breaks Resistance The USDSEK is new to our trading blog and one that is starting to look like a potential long setup. We have recently featured both the EURSEK and the GBPSEK for trend trading trading opportunities so it is no surprise that the USDSEK is of interest too.
We last traded the USDSEK back in 2014/2015 when we had the last significant period of trend on several USD currencies. These currencies also included the AUDUSD, EURUSD and the GBPUSD.
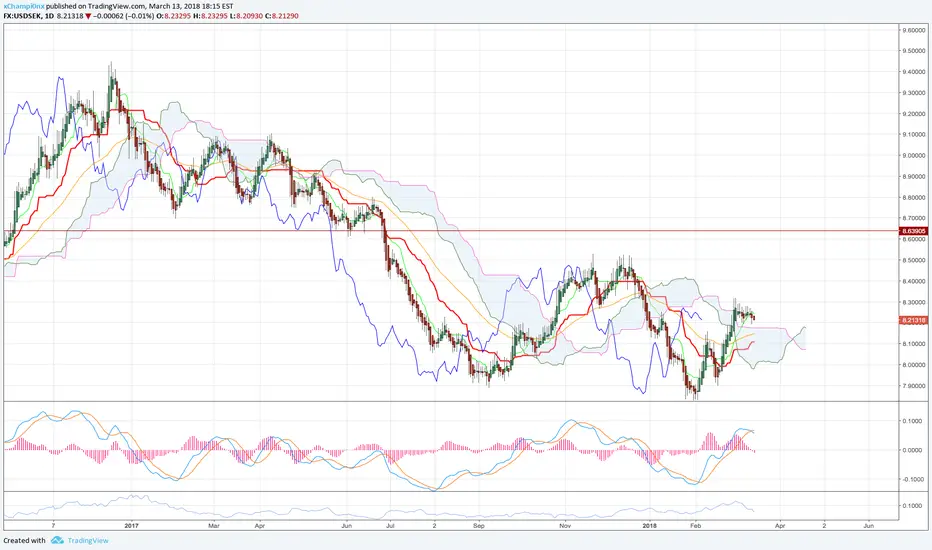
The USDSEK was one of the top performing currencies in that period producing a most linear trend from circa 6.5000 as support to just short of 9.0000 as resistance, a move of 2500 pips that was covered in a year offering multiple compounding opportunities along its ascent.
This was a period of trend where we extracted over 55 000 pips in 9 months on only a handful of positions across all the above mentioned currencies. Since then, the FX market has been notoriously difficult to trade with sustained trends being non-existent.
The money since 2016 has been in the bull run in stocks and so those who have focused heavily on FX in this time will have found it difficult to make sustained profits. Trading side-ways markets has no edge.
Looking at the setup on the USDSEK, we can see that price has now moved its way through the 200SMA and the 50SMA since February when the bulls took control of the market at the major support zone of 8.0000.
Price is now crucially also trading above the key pivot resistance of 2017 which is now acting as support. What we now want to see is a pullback to retest this level and then the next breakout to suggest a trend continuation towards 9.0000.
We will then look for the appropriate setup to start allocating risk to long trades.
Patience needed for now.
Any comments or questions, do not hesitate to leave them below. Hit agree if you share our sentiments!
Sublime Trading
USDSEK trade ideas

USDSEK Swing LongUSDSEK Swing Long . Market create long term Double Bottom and Break very important TL on high TF . actuly this market is on Rzone. if Break This R zone Flying UP on Profit Taker Level (Profit Taker R zone).

USDSEK shortIt is obvious at this point that what I see is basically a retracement of DXY for the coming week or two. But there is no doubt the dollar is on a long term bull trend. So short for now, significant retrace in my view.

USD/SEK: trading short-entryGrowing divergence after hitting the weekly barrier at 8.5290 suggests sellers are returning again. Expect a breach of the trend line and a correction back to 8.3000, 8.1570 and roughly 8-even over the next days and weeks.
Although the longer term is more or less neutral, broader USD weakness does support an aggressive short-entry strategy.
Near term trend: neutral
Long term trend: neutral/slightly negative
Outlook: correction, moderately negative
Strategy: avoid or aggressive short-entry
Support: 8.3000 / 8.1570 / 8.0050 / 7.8600-
Resistance: 8.4775 / 8.5290 / 8.66+
Outlook cancelled/neutralized: above 8.4775

USD/SEK 1H Chart: Pair diminishes trading rangeThe US Dollar has been trading in an ascending channel against the Swedish Krona since the beginning of 2018. The pair has appreciated 7.44% since its 2018 low of 7.8233, thus breaching the senior channel on March 28.
The Greenback continues to diminish its trading range and move in line with the wedge. The most recent test of its upper boundary occurred late on Friday when the rate reversed from the 8.48 mark.
It is likely that the given pattern is respected during the following trading days, thus setting the bottom wedge line circa 8.36 as a near-term target. A breakout to the downside might occur at this level. Nevertheless, this decline below 8.39 could be briefly hindered by the 100– and 200-hour SMAs.


selli think the price continue drop down to the targets. you can see the price brake down and retest the orange line and now will go down. sl if close day candle above the line

Time for USDSEK to fall soonCould get to 8.45 or maybe even 8.5. However, I think it could even be worth shorting within the next hour and seeing where it goes, seeing if the downside can get any traction. However, again, it might get to 8.45 or 8.5 in my view, so be prepared to take any gains from a short and look to re-enter

USDSEK shortTook profit and reversed to a short position at 8.45 with a stop at 8.60 looking for 8.15 area in a b wave correction lower before another leg higher in a c wave to 8.65-8.80

USDSEK(daily chart). Wolfe Wave at Weekly trend_line, 0.886 Fib.USDSEK(daily chart). Wolfe Wave at Weekly trend_line, 0.886 Fib.

USDSEK Bearish BatBearish bat formed in this pair USDSEK. Try to put pending order and dont miss the oppurtunity.


USDSEK: More head room availableUSDSEK erased 15-month bearish trendline
The daily RSI and oscillator are remaining bullish.
We forecast 8.40 and 8.52 in the near-term


USD/SEK 1H Chart: Continues trading in neat patternsThe historical price movement of USD/SEK demonstrates that the pair has a tendency to trade in neat channels. The past three weeks have not been an exception.
This latest junior pattern was formed late in February when the US Dollar reversed from the upper boundary of a medium-term channel circa 8.32 and began edging lower. Even if this short-term pattern fails to confine the rate any for long, it is still expected that the Greenback continues its movement south within the following two weeks until the senior channel is reached in the 8.10/12 area.
Two important support areas is the 55-, 100– and 200-hour SMAs and the weekly PP circa 8.20 and the weekly S1 and the monthly PP at 8.14. A breakout of the latter might set the pair for another decline down to the psychological 8.00 level.

Keep an eye on USDSEK!!This pair is consolidating nicely above flat kumo after breakout. Can see higher prices in coming weeks. Keep an eye on it for longs!!!
USDSEK H4 Medium term Long biasSome initial bears have been out, the NFP has provided ground for the next push.

USDSEK - Harmonic ShortENTRY 8.33400
SL - 8.34400
TP - 8.08210
TP - 7.82600
Red Dotted lines are temporary S&R levels
Orange lines are more well respected S&R levels

Take this trade for Long....I take this trade not because dollar strong, but swedish krona weakness..
and I make correlation with EUR/SEK and GBP/SEK too...

USD/SEK 1H Chart: Two scenarios possibleFollowing a reversal from a seven-month high of 8.52 mid-December, the US Dollar has been moving in a channel down against the Swedish Krona. The upper boundary of this pattern was tested on February 9—a move which was followed by a slight period of depreciation.
It seems that the pair is currently standing at the crossroads of two scenarios. On the bearish side, the pair should breach the 200-hour SMA and edge lower in line with the medium-term channel. A possible target within the following two weeks could be the 2016/2018 low of 7.8221. Technical indicators suggest that this is the more likely scenario.
On the other hand, the pair might fail to sustain its bearish movement in the steep channel down, thus resulting in a soon breakout north. The pair might even respect the three-week ascending channel and breach the 55– and 100-hour SMAs near 8.06. A surge up to the 24.60% Fibo retracement at 8.2053 is expected to follow.


