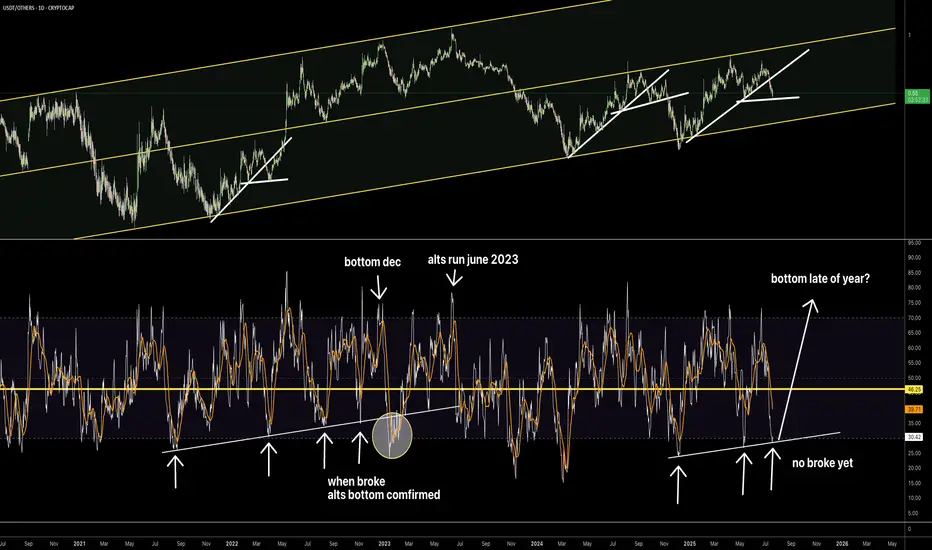
Where is the altcoin bottom?Hi everyone — keep a close eye on the 1D RSI of the USDT/OTHERS chart. As long as it holds, we’ll keep bouncing and seeing corrections. Only after it breaks can we start talking about a trend reversal.
Key data points
Previous close
—
Open
—
Day's range
—
About Market Cap USDT, $
Coin
The pioneer of the stablecoin model, Tether combines the best of two worlds, fiat currencies and the blockchain technology. It's pegged to US dollar so that 1 Tether could always be traded for $1, which decreases the risks usually associated with crypto. At the same time, it's still built on a blockchain and comes together with all the related perks, like transparency, innovation, widespread adoption features. With its dual nature, USDT is "disrupting the global financial industry". It's always interesting to watch where such ambitions will lead — you can do it with the chart we've prepared. It shows USDT market cap, which is the number of coins in circulation times their current price. A growing market cap might be a good sign for investors — it means the market favors the coin. However, a decrease might start any moment, in which case you'd better wait and reconsider your strategy.
Altcoins are in a similar channel as in 2022–2023.I believe that as long as the interest rate stays at 4.5%, we won’t see real growth in altcoins — only short-term pumps. Rate cuts are expected to begin in the summer, but it will take some time to have an effect. I would compare the current market to both 2019 and 2022.


ETH Bottomed last week!This chart illustrates the ratio of the market capitalization of the top three stablecoins and that of Ethereum (ETH).
The correlation is quite evident, as anticipated.
We are likely approaching a phase where these stablecoins will be deployed, with Ethereum being a key beneficiary, signalling t

My best-case scenario for ALTSFew people look at custom charts, and that’s a pity, because there’s a lot of truth to be found there. We’ve got fear in the market, and hardly anyone wants to buy right now.

USDT vs. ETH: A Silent Signal for the Crypto Market?We often scrutinize the price charts of volatile cryptocurrencies, but a look at stablecoin market capitalization can reveal surprising insights.
Recently, Tether's USDT market cap chart caught my eye, particularly when juxtaposed with leading cryptocurrencies.
While comparisons with Bitcoin have

Say No To Treasury-backed or institutional stablecoins Treasury-backed or institutional stablecoins are detrimental to crypto!
These will ultimately lead to stablecoins that are programmable money.
In other words, the issuers of these stablecoins will be able to manipulate them at will, freeze, burn, or inflate them as they please, rather than allowin

Liquidity entering the marketIn February, we may have experienced the greatest trap in Crypto Cycles, where the expected outcome was supposed to favor ETH and Alts, but instead, market makers pushed the price against all odds, using the narrative of tariffs against the retail investors.
A very nice M formation buildup failed t

Dow Theory Part 1 | Univers Of Signals AcademyWelcome to the Educational Content Section of Our Channel Technical Analysis Training
We aim to produce educational content in playlist format that will teach you technical analysis from A to Z. We will cover topics such as risk and capital management, Dow Theory, support and resistance, trends, mar

Prepare for the possible capitulation of altcoinsAnother chart that tells me of a possible impending altcoin capitulation in the next 2 months, let's see how it plays out.

See all ideas
Summarizing what the indicators are suggesting.
Oscillators
Neutral
SellBuy
Strong sellStrong buy
Strong sellSellNeutralBuyStrong buy
Oscillators
Neutral
SellBuy
Strong sellStrong buy
Strong sellSellNeutralBuyStrong buy
Summary
Neutral
SellBuy
Strong sellStrong buy
Strong sellSellNeutralBuyStrong buy
Summary
Neutral
SellBuy
Strong sellStrong buy
Strong sellSellNeutralBuyStrong buy
Summary
Neutral
SellBuy
Strong sellStrong buy
Strong sellSellNeutralBuyStrong buy
Moving Averages
Neutral
SellBuy
Strong sellStrong buy
Strong sellSellNeutralBuyStrong buy
Moving Averages
Neutral
SellBuy
Strong sellStrong buy
Strong sellSellNeutralBuyStrong buy
Displays a symbol's price movements over previous years to identify recurring trends.