USDT.D 3DUSDT.D ~ 3D Analysis
#USDT.D The movement we expect,. There is still an opportunity for further increase for Crypto, if USDT.D starts down. The dominance of the USDT dropped, meaning that more USDT was exchanged for Crypto.
USDT.D trade ideas

Usdt.dThe monthly RSI is below the 50 line. And this is a clear sign of a decline in Tether dominance, look carefully after a few months or better yet a few years, Tether dominance is below the 50 rsi.

USDT dominance. (USDC is similar). 03 2025Time frame 1 week. Crypto market dominance to % USDT. I showed this for the first time on 03 2022, nothing has changed since then, everything is the same and the logic is identical.
USDT dominance. USDT pumping indicator to the market 03 2022
USDT dominance. Indicator of USDT pumping to and from the market 05 2022
✔️Stablecoin dominance is falling — the market is growing.
✔️Stablecoin dominance is growing — the market is falling.
It cannot be otherwise (capital movement), until the time when ETFs with the US dollar are not massively introduced and popular, they will draw some of the liquidity to themselves. Which will slightly change the logic of this trend itself. Comparable, in terms of impact on the market, as before the introduction of trading pairs to alts/USDT instead of BTC/alts (everyone was like that). Until then, USDT was needed.
You need to understand that the main " transitional dollar for the people ", that is, USDT , - reflects the trend of all stablecoins. In particular, the main "competitor" - USDC, all the others (a temporary phenomenon) do not matter. Until USDT exists and can be used to track the direction of the money flow, that is, the direction of the cryptocurrency market.
In 2022 09, I also showed this game of liquidity flow into ideas with the combined dominance of USDC + USDT + BTC chart. But this is already a complication, everything is already visible and clear on the dominance of USDT.
Domination of USDT + USDC and lows/maxims of BTC. Correlation 2022 09
Remember, any stablecoin is an alt. The experience with UST (Moon Falling into an Urn) has taught many not to equate stablecoins to a real dollar.
The price stability of any stablecoin depends only on people's faith in its stability. This faith is projected by marketing activity, and first of all by the real capital that stands behind the creators. Everything conceived and implemented has a beginning and an end.
Bitcoin dominance to alts.
I will duplicate my latest idea on Bitcoin dominance here once again. I used it before (it was rational), before 2020 (I used to make a lot of ideas about local zones as triggers for market reversals). Now it doesn't do much. But I see people are fixated on this, not understanding the essence, and why it was so effective before and childishly clear when the market would be reversed (there were no pairs to USDT, but only alts to BTC).
Before 2018 (100% efficiency), before 2020 (partial), the dominance of Bitcoin to other alts was such an indicator of the pump/dump of the market. As it was the main direction of money flow. Almost all alts were traded only to Bitcoin.
Доминация BTC к альткоинам. Доминация стейблкоинов и памп рынка. 07 2022
Have a plan and understand what you are doing, observing money and risk management. As a result, you will be calm and satisfied with your profit from the market, if you are an adequate person.
Alt dominance.
And this is the idea of training/work (understanding the reversal zones of the crypto market of secondary trends) in 2023 on alts. That is, the dominance of alts without stablecoins, bitcoin and ether, which take away most of the market capitalization as a whole. The dominance is growing, naturally money is pouring into alta and vice versa. There are also similar ideas (look for publications in 2023) for certain groups of assets. That is, the point is to catch the hype, by groups of candy wrappers or, on the contrary, the threshold of stopping the flow of money into another hype.
BTC dominance to altcoins. Dominance of stablecoins and market pump . 07 2022
Without pain, there is no way for someone to gain benefits in the speculative market. Who will experience pain and who will gain benefits depends only on the qualities of the person who decided to engage in trading. That is, the totality of his positive/negative qualities that project his actions in the market. Everything is extremely simple and honest.
Dollar Index.
There are a series of interrelated ideas (three, detailed explanation), about the dollar index, that is, the larger cyclicality of the markets in general, and the crypto market as a small projection. Also, all publications of 2022-2023.
DXY Dollar Index USA. Recession and Pump/Dump Market Indicator 09 2022
DXY (Dollar Index) and Pump/Dump BTC. Market Cycles . 09 2022

When Bitcoin Goes Up, Tether Dominance Goes Down!I was wondering, does the Tether Dominance (USDT.D) index chart supports a bullish Bitcoin and a bullish Altcoins market? It does. Let's look at this chart together.
Bullish volume has been dropping steadily. Bearish volume is very high.
Tether Dominance has been in a downtrend, lower highs, since August 2024. Obviously, when Bitcoin hit bottom, USDT.D peaked. This index has been producing lower highs since. There is a clear downtrend on the chart.
A bearish hammer came on the 28-Feb. session. This is followed by another bearish signal 4-March. A continuation. Lower highs long-term and lower highs short-term.
The chart is pointing lower, has been going lower and will continue lower. This means that Bitcoin is going up.
Thank you for reading.
The signals are everywhere.
Namaste.

if abcde , bull marketIf the Elliott model of the downward continuum occurs, the market will surely see higher targets, so we can stay on this revised sample for Dominance Tetra.

crypto market pathHere is projection for upcoming targets path.
As we see tonight reaction gone further than 61%. This is not standard ratio and may indicate the power of underlying trend.
According to my waves count market is in a B wave of minor degree now. The important thing about it - is degree positions:
The end of subwave C will coincide with the beginning of the primary degree wave.
The only question how the wave will start: will it start from primary degree correction of previous bull market? Will it begin from a 1 wave of a new bull market comparable in size to the one we had since 2022 December? or we will face a tremendous bear market structure, correcting the whole 16 years crypto history?
My base scenario is the first will be -
1) A primary degree correction which could lead to usdt.d dominance to 6.4 - 8.5%! on Bitcoin, this could lead prices below 60k.
2) The first wave of new bull market will start after the primary correction.
I come to the wave count conclusion by analyzing MACD at 4d+ time frame. As you know 5 waves down is never the end. So the primary wave count may hint us continuation of the bull market, as part of the double zigzag at usdt.d. The leading indicator here may be DXY. There is a wave C, which can bring the dominance to 94 - 84%, and quite quickly.
I am looking for more confirmations of the structure, which may take time along with the pattern development.
Welcome to comments and see you soon!

Usdt.dThe 4-hour time frame of Dimension Tether could move down quickly, in which case the coins will recover and go up again.

#USDT.D is likely going to take 5.6-5.7% before rejection#USDT.D closed the daily above the PSL at 5% after bouncing from the 2D Demand level + 4H HOB located at 4.58%. The upside liquidity sitting at 5.6%-5.7% will likely be taken, which will likely coincide with 77K or potentially 72K BTC & 1900-1700 for $ETH. It could reject from the current liquidity block at 5.3%, but because we closed above 5% again, the probabilities of 5.6-5.7% increase. This should also coincide with some lower liquidity levels on some of the alts like #AR, #ETH, #TAO, #ATOM.

Usdt.dHello, I hope the altcoin season starts tomorrow, March 4th. This is just an opinion, and you should take responsibility for your own trading. I think altcoins will grow by 300% in this season.

USDT.DIn the series of pinned posts, we've analyzed and predicted all the ups, downs, and waves of the index for you. (How perfectly the analysis played out! 😉)
Here’s the sharp drop in USDT dominance within W4, a 18% dump, leading to a market pump. Of course, many are linking it to Trump’s speech in support of crypto, but did we know in advance what he was going to say? No! We just read the charts, analyzed market conditions, and presented a single scenario, which once again proved to be spot on!
Once this current hype settles, we'll update you on the next moves of dominance. But of course, it all depends on your reactions and energy! ❤️

trump pumpTrump has announced a very aggressive bull run,
it may be profitable and last soon
In fact it started 2 days ago, in the Friday
Here is the Top and
the whole this figure is an Extended flat figure
with targets:
3.82%
3.3 %
Dogecoin 0.335 or 0.81

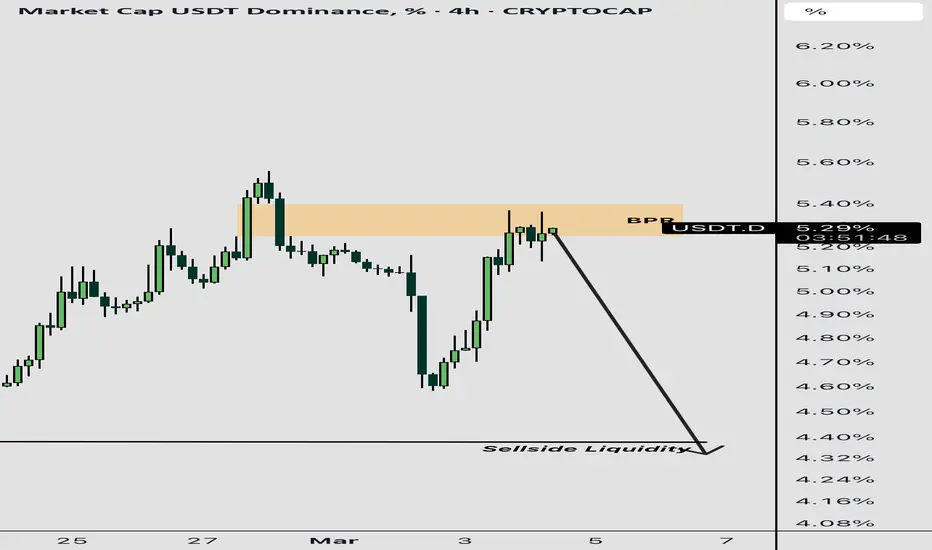
Bearish PennantAfter a long build up, the USDT.D has pretty much confirmed it is in a Bearish Pennant, and should eventually come crashing down, leading to the continuation of the bull market.

USDT.D Macro Update ( Alt Season ? )everything on the charts
I'm still holding my alts
For traders, this is one of the best charts in town (to find local tops and bottoms for potential swing opportunities)
This tells the whole story
If Invalidation occurs, I'll reconsider all my traders.
(not in the mood of writing much, check out the previous posts for more explanation + everything's on the chart)

USDT the big rebound - The Rise from the Ashesin my newest finding i will tell you about USDT rise from the Ashes
as you can see we build a very volume heavy low
corresponding to a low in March and a really good rebound is about to happen
be prepared for heavy downturns in the crypto market
as always, just my opinion and looking for ppl who share thougths on it
no trading advice

$USDT DOMINANCE ANALYSIS USDT.D is approaching a major downtrend resistance.
A rejection from this level could trigger a pullback, forming a lower high structure before targeting the key support zone at 3.80%.
Bearish Outlook:
Rejection at resistance 5.30% zone, Lower highs formation
Potential drop to strong support
What This Means for Crypto?
A decline in USDT dominance usually signals bullish momentum for #Altcoins & #BTC!
Keep an eye on the reaction at resistance.

USDT.D at 5.76% Key Level to Watch for Crypto Market “BOTTOM”Hey everyone! 👋 Let’s talk about a critical level on the USDT.D chart (Tether Dominance) that could signal a major opportunity for crypto traders. If you’re looking to long Bitcoin, altcoins, or other crypto assets, this is the area you need to watch closely: 5.76%.
Why is 5.76% So Important? 🤔
USDT.D measures the dominance of Tether (USDT) in the crypto market. When USDT dominance drops, it typically means money is flowing out of stablecoins (like USDT) and into riskier assets like Bitcoin, Ethereum, and altcoins. In simpler terms: a drop in USDT.D often signals a pump in the crypto market!
Right now, the 5.76% level on the USDT.D chart (as shown in the image) is a key support zone. You can see it’s been tested before, and it aligns with historical bottoms in the crypto market. When USDT.D hits this level, it often marks a turning point—a bottom for the crypto market—where prices of BTC, alts, and other assets start to rally.
What Does This Mean for Traders? 📈
If USDT.D reaches 5.76% and shows signs of reversing (like a bounce or consolidation), it’s a strong signal that the crypto market is ready to pump. Here’s why:
• Money Flow: A drop to 5.76% suggests investors are moving funds from USDT back into crypto assets, driving up prices.
• Market Bottom: This level has historically acted as a floor for USDT.D, meaning the crypto market could be at its lowest point before a big rally.
• Opportunity to Long: When USDT.D hits this zone, it’s a great area to consider longing Bitcoin, altcoins, or other crypto assets, as they’re likely to start pumping.
How to Play This? ⚡
1. Watch the 5.76% Level: Keep an eye on USDT.D as it approaches this key support. Look for signs of a bounce or reversal (like a strong candlestick pattern or increased volume).
2. Confirm with Other Indicators: Check Bitcoin’s chart, altcoin price action, or other indicators (like RSI or MACD) to confirm the market is turning bullish.
3. Take Action: If USDT.D hits 5.76% and starts to reverse, consider longing your favorite crypto assets. This could be the start of a big pump for BTC, alts, and the entire market!
Why This Matters for the Whole Market 🌍
The 5.76% level isn’t just about USDT.D—it’s a signal for the entire crypto market. When Tether dominance drops to this area, it often means the market has found a bottom, and we’re about to see a wave of bullish momentum. Whether you’re trading BTC, ETH, or smaller altcoins, this could be the best area to jump in for a long position.
Final Thoughts 💡
The 5.76% level on USDT.D is the area to watch right now. It’s historically been a bottom for the crypto market, and if we hit it again, we could see a massive pump across all crypto assets. Stay patient, wait for confirmation, and get ready to take advantage of this opportunity! 🚀
What do you think? Are you watching this level too? Let’s discuss in the comments! 👇
Why This Explanation Works:
1. Simple Language: It avoids jargon and explains USDT.D in a way anyone can understand.
2. Actionable Advice: It tells people exactly what to watch (5.76%) and what to do (long crypto assets).
3. Visual Reference: It ties into the chart you shared, pointing out the 5.76% level.
4. Engagement: It invites discussion, encouraging others to share their thoughts.
5. Big Picture: It connects the USDT.D level to the broader crypto market, making it relevant to all traders.

2 scenarios for USDT.D#USDT.D has 2 zones which are used as support and resistance zones which the price respected them many times i think that these zones are the best tool to analyze the whole market
we have 2 scenarios for USDT.D
once is rising to take the liq in higher numbers
the other is going down from here
any way if USDT.D make another rise we can be sure that the first scenarios is the true one

USDT.D update#USDT.D hit a strong supply zone we can be sure that the whole market can be bullish for a while but the BTC is still bearish so its better to make a long position when BTC hits a demand zone too

Possible Bearish CypherStronger RSI shows us that USDT.D is stronger than the previous bottom.
Therefore, a rise towards point D would not be surprising.
For those expecting a bull market in altcoins, point D may be the real altcoin buying point.
First target to the D point %7.49
Bearish cypher target %1.59
* What i share here is not an investment advice. Please do your own research before investing in any asset.
* Never take my personal opinions as investment advice, you may lose all your money.

USDT Dominance Drop Incoming? Short-Term Relief for Crypto!📉 USDT Dominance Update 📉
USDT.D is showing bearish divergence – price rising while RSI declines. A drop from 5.42 to 4.38 is likely, giving BTC and alts a temporary relief. However, higher timeframes still look weak, so this move may not last long. Stay cautious! ⚠️

USDT.DI think wave 3 of 4 is complete. Get ready for wave 5 and the final bullish wave in the market.

USDT.D - Just for funThe closer to the green line (and the longer it stays near), the stronger the bull market.
My guess is that crypto will pull back in the coming weeks and then open the doors to the bull market of this halving.
