USDT Dominance Chart (Bearish)The opposite of BTC & Crypto Charts, USDT. D is currently sitting on supply, weakend while the DXY & USDCAD also showing weakness. I expect this to fall further down towards demand, this shows a great buying opportunity for Crypto & Bitcoin. Will update the chart as we approach the demand.
USDT.D trade ideas

Usdt.D to get smashed For me , usdt.d is the most annoying chart out there , uncontrollably volatile but soon it’ll be out of importance as it’s dominance set to fall around 1% . This is the only sensible way in order to get a nice smooth bullrun , now the circle I did draw in my idea is the peak and it should start to fall from where is it till the mid April, we gonna have a correction there but not a vile one and be going up again till October or November, stay safe fam .

MACRO Crypto Cycle - Alt Seasonthis is what I'm expecting this year BUT
Follow the LTF analysis, we'll use this just for reference as it's pure speculation to predict until 2026
let's keep playing level by level

usdt dominance in daily timeAccording to the usdt dominance chart, the broken has been done and according to the fib retracement, it pullbacks up to 4.33. Please comment your opinion.i think btc will be bulish today.probebly

TradeCityPro | USDT Dominance Key Levels & Market Impact👋 Welcome to TradeCityPro!
In this analysis, I will break down USDT.D, one of the most critical indicators in crypto, which reflects the amount of money held in Tether dominance.
🔑 The higher the dominance, the more altcoins are being sold and converted into USDT. Conversely, when dominance decreases, USDT is being sold and converted into other cryptocurrencies. As a result, this chart usually moves inversely to Total2 and other crypto assets—when USDT dominance rises, Total2 typically declines, and vice versa.
📅 Weekly Timeframe
In the weekly timeframe, we observe an uptrend that followed an ascending trendline. However, after getting rejected at the 8.68 resistance, the trendline was broken, initiating a bearish leg that closely followed a descending curved trendline, reacting strongly to it. After reaching 3.87, the price made a deep pullback to the previous ascending trendline. Given the PRZ formed by the confluence of the trendlines, the 6.20 resistance, and the SMA99, the next bearish leg began.
🔍 Currently, the price has once again reacted to 3.87 and pulled back to the curved trendline. If this zone holds as resistance, the probability of 3.87 breaking on the next test increases significantly, potentially triggering the next bearish leg. This leg could extend down to 2.61, although considering the current liquidity in USDT, such a deep drop seems unlikely but remains technically possible.
🔼 If the curved trendline is broken and the trigger activates at 4.61, the price may form a consolidation box between 3.87 and 6.20. Upon breaking 4.61, we could see a movement toward the top of the range. The SMA99 has been a strong dynamic resistance, with multiple price reactions to it, so it could play a key role if USDT dominance increases.
📅 Daily Timeframe
In this timeframe, we see an accumulation box forming between 3.87 and 4.36, which was broken a few days ago. If the price stabilizes above 4.36, a move toward 4.99 is likely, with the ultimate target at 6.20, as mentioned in the weekly timeframe.
📉 If the price re-enters the accumulation box and this breakout turns out to be a fake move, strong bearish momentum could enter the market, significantly increasing the probability of a 3.87 breakdown.
✨ There are no other notable points in the daily chart—this timeframe has provided clear triggers. Now, let’s move on to the 4-hour timeframe for futures trade triggers.
⌛️ 4-Hour Timeframe
In this timeframe, we can see the recent price movements in more detail. As shown, the price has formed a key resistance at 4.60, which could be a decisive level. If this area is broken, it will confirm the accumulation box breakout, increasing the likelihood of a move toward 4.99.
✔️ On the other hand, if the price drops below 4.44 and re-enters the accumulation box, the entire upward move will be invalidated. In that case, breaking 4.23 could trigger further declines, leading to a test of the bottom of the accumulation range.
📝 Final Thoughts
This analysis reflects our opinions and is not financial advice.
Share your thoughts in the comments, and don’t forget to share this analysis with your friends! ❤️

USDT Dominance - Short-Term Analysis (1H)The correction appears to be a symmetrical pattern. This formation is suspicious, and we should expect the possibility of this index reaching the upper red box.
Once wave i is completed, a major stop hunt on altcoins will occur, allowing the market maker to accumulate more liquidity.
Let’s see what happens.
For risk management, please don't forget stop loss and capital management
Comment if you have any questions
Thank You

USDT DOMINANCE AT CRITICAL TURNING POINT BIG MOVE LOADING!USDT dominance remains confined within a well-structured descending channel, displaying a clear Wave formation. The recent wave (4) rejection perfectly aligns with the 200-day EMA and the critical 4.89% resistance level, reinforcing a bearish outlook.
The confluence of technical factors suggests wave (5) is in play, with downside targets at 3.71% and an extended move toward 3.10%. The Stochastic RSI hovering in overbought territory further supports the probability of an imminent drop. A breakdown below 4.44% would confirm this bearish continuation, signaling a shift towards a risk-on environment—bullish for crypto assets.
We should watch this level closely, as a decline in USDT dominance typically correlates with stronger momentum in Bitcoin and altcoins. If this plays out as expected, expect volatility to increase across the market!
Like & Follow for more real-time market insights!
Drop your thoughts in the comments are you: bullish or bearish?

USDT.D (how to find local reversals? no alt season this cycle?) sorry I forgot to post it here a week ago after the crash
I had that shit marked (small green box for a powerful reversal), which hit in the first week of December, but I forgot to check it out—lol, was too busy with other things = can anyone at least remind me or everyone's a lazy ass like me, these days?
Anyway, it was a perfect local top indication (USDT.D along with other macro charts are the best possible indicators for local top/bottom. One must capture these beautiful reversals where you have at least 80% of confidence, to accumulate more and more of your favorite tokens)
Trust me, BS news you see is just an excuse. It's almost always in the chart (in this case, tariffs) = This is how I was able to predict 5th August bottom (in that case, it was the Japanese Yen news but in reality, it's all in the chart but I missed it this time and I'll accept it, I was to busy so never looked at it.. the reason I stopped posting after November)
Good thing we still haven't reclaimed the macro trendline.
and look what happens after such long wicks into resistances ... (5th August one, 22nd Jan, and last year's)
and CT getting bearish? I get it that normie retails are fearful but good big CTs ???
This cycle really is different...
LOWER it now !!! (obviously there are many other confluences I've found but I'm too lazy to mention all that here)
PS. Yes, there will be an alt season and it will catch many off guard since most have lost hope and capitulated already.
It would be wonderful if you guys interact and keep things on your panel too, so we don't miss any market movements!!! I don't Trade full time, it's just 1/4 of my gigs

USDT Dominance Chart AnalysisUSDT dominance broke out of a long-term descending channel.
However, it is showing signs of rejection at nearly 4.60% and could head back towards support.
21-day MA (black line): Previously acted as resistance, but now provides some support.
100-day MA (purple line): Was breached, but is now being retested as support.
A red candle after the recent breakout suggests a possible failed breakout scenario.
The green arrow indicates a potential decline towards 4.20% or even lower.
Support: 4.20% (previous resistance, now potential support).
Low Support: 4.00%
Resistance: 4.60%
If you found this analysis helpful, hit the Like button and share your thoughts or questions in the comments below. Your feedback matters!
Thanks for your support!
DYOR. NFA

USDT.D update - Feb 10 2025Considering the current situation of the chart and the divergence that has formed in indicators, it is logical to assume that USDT dominance has the potential to drop towards 4.26% zone meaning that there is going to be some upward move in the market. So it is rational to look for buy/long opportunities in 4H charts.

Usdt dominanceAgain after like 4 years usdt dominance is deep and it is giloing up and the whole market is droping, the key levels are 5.3 and 5.8 then 6.2, for usdt dominance, Probably in this levels market regain its power and will be bullish

USDT.D ANALYSThe daily chart of Tether dominance indicates that it has been moving within a long-term descending channel. Recently, it has broken above the mid-line of the channel and is now attempting to reach the upper boundary. It is expected to touch the 5.3% level, after which further analysis will be required to determine whether it will break above the channel's resistance or retrace toward the lower boundary. A move toward the lower boundary could serve as a strong signal for the beginning of an alt-season.

Bad news... Tether Dominance is bullish!#usdt #tether dominance made W bounce in about 1 year period and in weekly candle stick size, #usdtd also formed bullish divergence. This movement seems not good for #crypto and #altcoins in mid term.

USDT Dominance - Short-Term Analysis (1H)In lower and smaller timeframes, it appears that USDT dominance has entered a correction. This correction started from the point where we placed the red arrow on the chart.
It seems that the candles are currently in wave B.
A bearish wave C is expected, which could push the candles toward the TP levels.
The closure of a 4-hour candle above the invalidation level will invalidate this analysis.
For risk management, please don't forget stop loss and capital management
Comment if you have any questions
Thank You

Tether Dominance still looks bullish#tether #usdt dominance chart the #usdtd looks bullish and may aid the wick it left upside. Bullish CRYPTOCAP:USDT dominance is bearish for #altcoins and #btc

USDT.D update#USDT.D is completing its pattern the market is making 5 elliot waves as you can see the 4th wave is made of an ABC pattern which hit 2 supplies with waves A and C so i think its not a possible idea if this chart cross the 2nd supply zone as the correction waves are over !


Rejection of range high on USDT D., if btc moves it moves now- update on this analysis:
- usdt d. has been rather tricky to play, with support box holding a number of times
- with this latest upmove all upside targets on usdt d. have been met however and with the 2W star cross happening soon, if btc wants to break to the upside it should do so in the next 14 days
- projected target north of 140k should that happen

USDT Dominance + USDC Dominance 1WIMPORTANT!
CRYPTOCAP:USDT Dominance + CRYPTOCAP:USDC Dominance
These two dominances show us the cash position in the market. This is the crudest expression.
With the rise of this chart, we can see that there is an increase in cash transitions in the market or hot money inflows to the market.
In my previous post, I shared information that there may be a movement from the bottom to the falling trend line (red) above. Because this possibility was much higher. The reason was that it made a double bottom formation, supported by the rising trend line (green) and also pointed to a harmonic pattern.
With the OB level on the daily chart, the price retreated with the falling trend line (red) acting as resistance. With its retracement, the upward movement on the BTC side was realised. Because as it is known, this chart works in inverse correlation with the BTC chart.
If this chart continues its upward movement, that is, if it breaks the falling trend line and provides a movement towards 11% levels, then we can see much deeper declines on the BTC side.
Let me add one more comment to overlap here;
On the BTC side, I have been emphasising that I have an expectation of $123k - $130k for the first batch for a long time. So if this chart moves one round lower than these levels, to the bottom of the rising trend line (green), it is possible to see the levels I mentioned on the BTC side. Then again, the dominance chart will now move upwards and may cross the red line, which is the falling trend line, and move towards 11% levels.
Of course, there are other OB resistances on the route, and a pre-bullish retest will probably do. This gives misleading information that the decline on the BTC side is over.
If BTC really returns from the level I mentioned above and moves as I explained in this chart, there may not be a second spring in the market until it reaches 11% levels.

Breaking Point: Will USDT Dominance Wave C Spark Altcoin Inflows
In my view, the "manipulative squeeze" observed the other day represents wave B within an expanded flat correction. Yesterday, CRYPTOCAP:USDT.D reached three key targets simultaneously (FVG on both weekly and monthly timeframes, along with tests of the MA200-d and MA20W), which inflicted substantial pressure on CRYPTOCAP:OTHERS , CRYPTOCAP:TOTAL2 & CRYPTOCAP:TOTAL3 . By the end of the day, a reversal candlestick pattern had formed. Of course, we need confirmation, and the price may likely retest the wick area from yesterday’s candle — a normal market reaction.
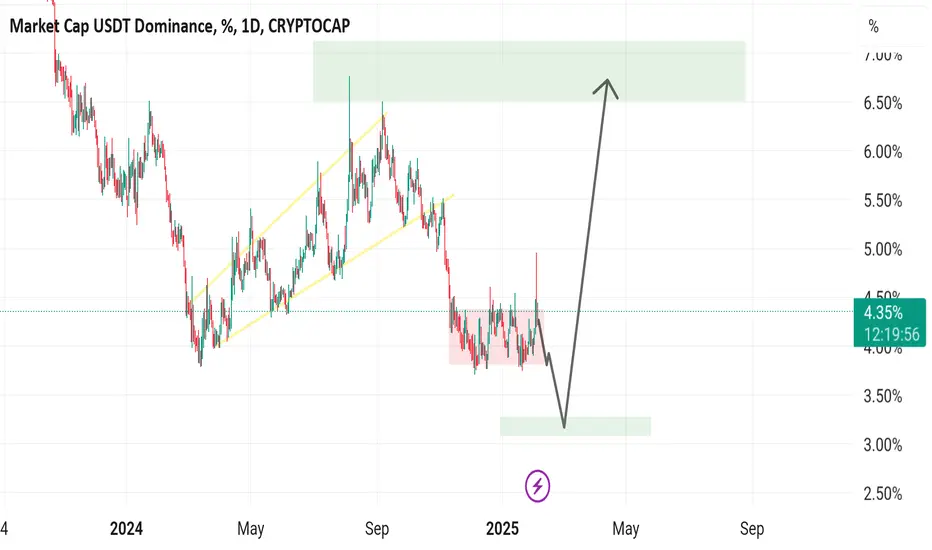
Nevertheless, the overarching conclusion is that USDT Dominance may be prepping for a potential downward wave C, targeting the 3.2–3.4% range. If realized, this scenario could lead to an influx of capital into altcoins, benefiting from a reduced share of stablecoins.
At the same time, it’s essential to remember external factors such as news, macroeconomics, monetary policies, and developments in global financial markets. Any significant shifts in these areas can alter the balance of power and consequently adjust the current outlook for USDT Dominance.
My last global forecast

USDT.D CHART SAYS ALL!!i dont need explain anyting for this chart. Cause i drawed my think . So what do you think? Drop this comment ur opinion
Called move after move for Bitcoin, what happens next?If you been lucky enough to work out my analysis and pull the trigger on the trade setups that played out over and over again, I commend you for your knowledge of how to read an analysis and then use it to make an informed decision.
If you caught the last analysis I mentioned about a bear trap spike below the blue line and as you can see it played out. You can see I have removed the green trendline on left chart as it is now done with and the green trendline on the right hand side chart is basically invalidated now.
We see on the left chart the orange trendline is respected with the candle closing above it. The white major trendline also held as major support. You can see the other trendlines still being used, especially on 4 hour timeframe.
So, what now?
We need to watch for the right hand side RSI to breakdown under the red trendline for BTC to get to 108k.
On the left chart the RSI needs to break back above trendline. In regards to the price action, we can see a massive buy up in the crash candle that was just made. Price could move up to 108k from here now there are trapped short traders below. This would put the right USDT.D chart at the blue trendline and as per previous analysis we know what happens if that then breaks below this line.
On the bearish side, if price loses the light green vwap line then expect another retest of the white trendline.
Smash the like button and good luck!

$USDT February Local Top Hit!well well well... look at that.
TA PERFECTION 💯
Should I start charging for my calls? 😂
I couldn't imagine anyone not following my account at this point 🧐
(see prior USDT chart for the original call).
