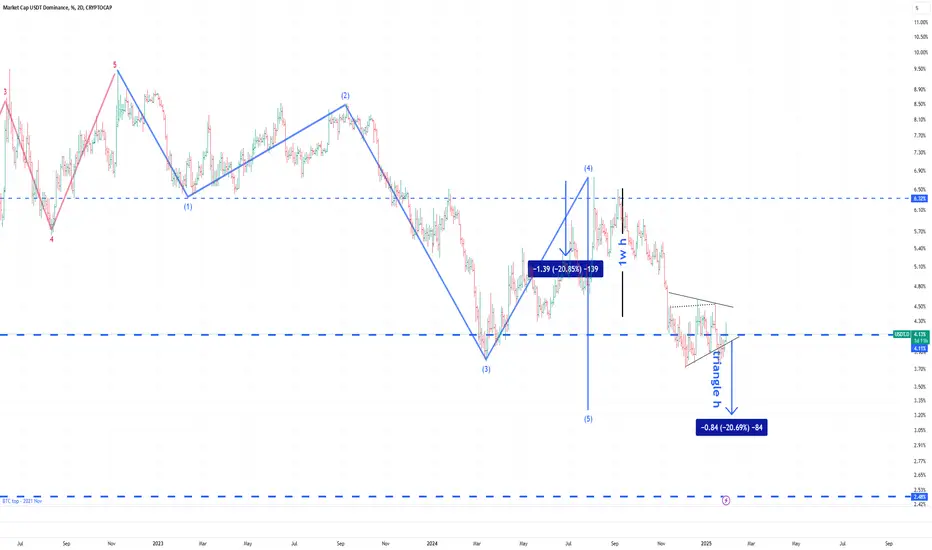
Key to upcoming price action pathHere are 2024 September - November USDt rally metrics:
66 days, 4.6 Trillions volume.
The first sub wave of micro degree is 1.39 points or 20.85% length.
The third sub wave of micro degree is 2.32 points or 35.7%. Which led to +89% at BTC, from 52k to 99k.
The triangle in fourth position has 0.75 points - 16.77% min basement or 0.97 - 20.69% max height. Triangles usually precede the last wave in the direction of the main trend. The terminal point for this triangle may reach 3.15% dominance and last in approximately the next 80 days.
The dominance of USDt on RSI 2D TF signals a downward divergence.
I think the signal line could reach ~22% before meeting the support trend line and reversing. It is -18% from the current point.
These values coincide with trend lines on Bitcoin, about 155k, or +55% from the current point.
Dodgecoin in percentage terms does move about 2x further.
This is a third confirmation proving upcoming rise in all crypto assets.
keep in mind that there is always place for an alternative waves count, but i bet that the analysis results worth millions!
So, wish you safe trading, fat profits and see you again :)
USDT.D trade ideas
USDT.DHere’s a suggested caption for your post in English:
🟢 USDT Dominance Key Reversal Zone
The 4.70% - 5.30% zone on the USDT dominance chart is a critical area to watch for a potential reversal and further decline. Keep an eye on this level for upcoming market movements! 📉
💡 What are your thoughts? Are we about to see a significant drop in dominance, or will the market surprise us?
For the chart, make sure to highlight the 4.70%-5.30% zone with a clear label and maybe add some annotations to explain the possible scenario visually. If you’d like, I can help you design an exact text overlay or annotations for the chart.

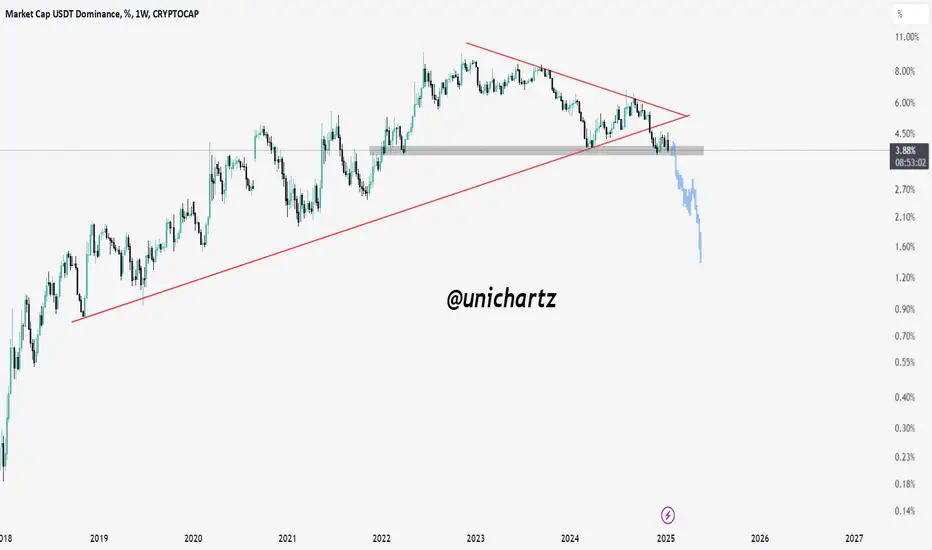
USDT.D at Key Support: Will Altseason Ignite?USDT.D Weekly Analysis:
Key Zone: USDT.D is trading at a critical support zone, with a successful retest of the broken trendline confirming bearish momentum.
Bearish Potential: A breakdown could lead to a 48% drop in dominance, paving the way for an altseason as funds rotate out of stablecoins.
Bullish Risk: If the support holds, bearish momentum could stall, delaying the altcoin rally.

USDT.D - BTC/USDTHEre is a very simple way to see what the market can do and where we can go from here.
This may mark the top and also the bottom for the next cycle, just by following the indicator and logic of T.A alone.
Will Keep Updating

USD.T Crypto Super Cycle AnalysisSup Gang, DegenJake Here with another godly breakdown.
Here we have Bitcoins ying to the Yang. Were seeing it want to go ahead and grab low side liquidity which it is extrmely close to and then reverse finding some support that it yet wont be able to break, and go ahead and direct itself to the 4.12% level take liquidity and then BOOM come back down crash down through this 3.73% level illustrated by the red horizontal line and ALT SEASON WILL START MUAHAHAHA. Very close we are gang.

USDT.D Dominance of USDTis it bullrun ? of course , just broken out down 4h Ma 50 and now tested . should be dump to 2.5 and market pumping . dont worry , i am here

SHORT #USDT! LONG EVERYTHING USDT Dominance The bull market hasn't even started yet!
The 7 year trending line has been broken and tested.
Don’t get shaken out when the future is still so bright

Usdt.dUsdt.d very bearish and goes to lower level to main support and alts go to the moon btc.d goes to %40 .
All of this indicator show us all of market just buy crypto like celr strk atom pol meme

Possible downward breakout of $USDT.D as start of altcoin seasonThe Order Blocks may indicate that the often canceled Altcoin-Season could be imminent
CRYPTOCAP:USDC.D dominance is struggling to break through the crucial Order Block in Chart 1 between 3.7%-4% to the downside
If the breakout to the downside happens, nothing should hinder the Altcoin-Season 🙏
There is usually an inverse relationship between USDT dominance and altcoins. If the dominance falls, crypto degens exchange their stable token for altcoins and their prices rise
Another positive sign is that CRYPTOCAP:ETH relative to CRYPTOCAP:BTC in BINANCE:ETHBTC chart faces two significant Order Blocks around the 0.03 and 0.025 ranges from 2021
If one of them holds and should an upward reversal occur here, CRYPTOCAP:ETH could lead altcoins upward as in past cycles

Usdt.dI am not very confident the crypto market will keep going up . This is like the 10th time usdt hits support . Usdt going up means volatility on the crypto market going up means crypto go down . Until they clear this resistance i think bears still have a chance for a big correction . We will see if bulls can keep up the momentum otherwise bears will enjoy the correction

USDT.D time fram DDominance Tether is in a pattern and has come below the moving 20, and it is possible for the digital currency to grow.

USDT.DWe should see a decent red candle closes below the green block if not then the manipulation continues.

USDT D UPDATE Yesterday it broke the flag down but it pulled back in. It is still going. I would place a stop at 4.11.

USDT Dominance (USDT.D)USDT Dominance (USDT.D)
The USDT Dominance chart reflects the percentage of the cryptocurrency market capitalization held in Tether (USDT), providing insights into market sentiment and risk appetite. Here's an analysis based on the chart structure:
Key Levels and Observations:
Supply Zone at 6.50%:
The 6.50% level acts as a critical resistance where the "Bull vs Bear Flip" is observed. This zone marks the upper limit of a supply area, where sellers are dominant.
A rejection here could signal an increase in market risk appetite as funds flow out of USDT and back into crypto assets.
Demand Zone at 3.63%:
The 3.63% level serves as a strong demand zone, historically supporting USDT.D during bearish periods in the broader market.
This is marked as the lower boundary of the "Bull vs Bear Flip," indicating increased caution if revisited.
Median Level at 4.48%:
The chart highlights the 4.48% level as the median point, balancing bullish and bearish sentiment. Current price action is hovering around this zone, signaling indecision and a potential breakout or breakdown.
Harmonic Pattern Formation:
A harmonic pattern is evident, with key retracement levels at 0.449 and 0.734 marking the price's journey from points X, A, B, C, and D.
Point D, near 3.63%, aligns with the demand zone, completing the pattern and triggering a potential bounce.
Rounded Bottom Formation:
A rounded bottom is visible on the left side of the chart, indicating a previous reversal from bearish to bullish sentiment. This reinforces the importance of the 3.63% level as a long-term support.
Bear Zone at 2.83%:
Below the demand zone lies the 2.83% "Bear Zone," signaling extreme bearish sentiment for USDT dominance and likely strong risk appetite in the crypto market.
Scenarios to Watch:
Bullish Scenario:
A breakout above the 4.48% median and sustained movement toward the supply zone at 6.50% would signal increased market caution as investors move to USDT.
If the 6.50% level is breached with volume, USDT.D could trend higher, indicating market-wide fear or profit-taking in crypto.
Bearish Scenario:
A breakdown below the 4.48% median would confirm bearish momentum, with the next target being the demand zone at 3.63%.
A fall below 3.63% could lead to a retest of the 2.83% "Bear Zone," indicating renewed bullish sentiment for crypto assets.
Volume Analysis:
Recent volume spikes during the recovery indicate significant interest at current levels.
However, diminishing volume near resistance suggests hesitation among market participants, requiring confirmation of the next directional move.
Conclusion:
The USDT Dominance chart is currently in a state of equilibrium around the median level (4.48%), reflecting market indecision. The next significant move will likely depend on whether the supply zone (6.50%) or demand zone (3.63%) is tested first. Traders should watch for volume confirmation and macroeconomic catalysts for the next trend in risk sentiment.

USDT.D 8H Update From a technical perspective, we are in need of a third bottom. Currently, there is a significant resistance level in the way of USDT.D, which I believe will lead to a price reversal and the formation of this third bottom 🫡🚀

USDT.D update - Jan 20 2025As it was expected, USDT dominance ceased to drop after touching the 3.7% - 3.8% zone. As stated before the upward move in USDT.D must be a small one ending somewhere in the 4.08% - 4.26% zone so that it prepared to break through the 3.7% support zone.
Crossing below the mentioned support zone shall lead to a heavy pump reaction in the market specially in altcoins so it is advised to consider adding to your altcoins' spot bag while USDT dominance is completing its temporary upward move.

USDT.D : Roadmap For crypto market with USDT Hi Friends,
As you can see in the Tether chart, we did not reach the previous low, but Bitcoin managed to experience its highest price. This is also a type of negative divergence. Please be very careful with Bitcoin. The market is very emotional.
SecondChanceCrypto
⏰ 20/Jan/25
⛔️DYOR
Always do your research.
If you have any questions, you can write them in the comments below and I will answer them.
And please don't forget to support this idea with your likes and comments.

Crypto is going highUSDT.D is quite weak lately.
If a red candle closes below the pink box, you can buy more crypto.
This is just for entertainment to hit "Play" in the future and see how right or wrong I was :)

Buy usdtAfter 6 years, usdt completed its wave one and two and is now ready to climb the third and big wave of 5 waves...slowly and steadily.

USDT.D UPDATEThe inverted flag in USDT dominance has broken down. This could take us to levels 3.5%. In Bitcoin, these levels appear to be 114-116k.

What is the current structure of USDT.D (8H)?This analysis is an update of the analysis you see in the "Related publications" section
It seems the structure is a diametric, and wave F is nearing completion. Wave F was a bearish wave.. A bullish G wave remains in this structure. Let's see which direction the market will take.
For risk management, please don't forget stop loss and capital management
Comment if you have any questions
Thank You

Usdt.dTether dominance is very bullish, I think crypto will be very red, sorry for those who have invested in crypto…. Be careful

USDT.D Retests Breakdown: Is a Strong Altcoin Rally Ahead?USDT Dominance (USDT.D) has broken below its rising trendline and is trading at a key support zone after a successful retest of the breakdown. A break below this support could trigger a sharp decline, signaling capital rotation into altcoins.
This setup aligns with the potential for a strong altcoin season and an active trading period ahead.