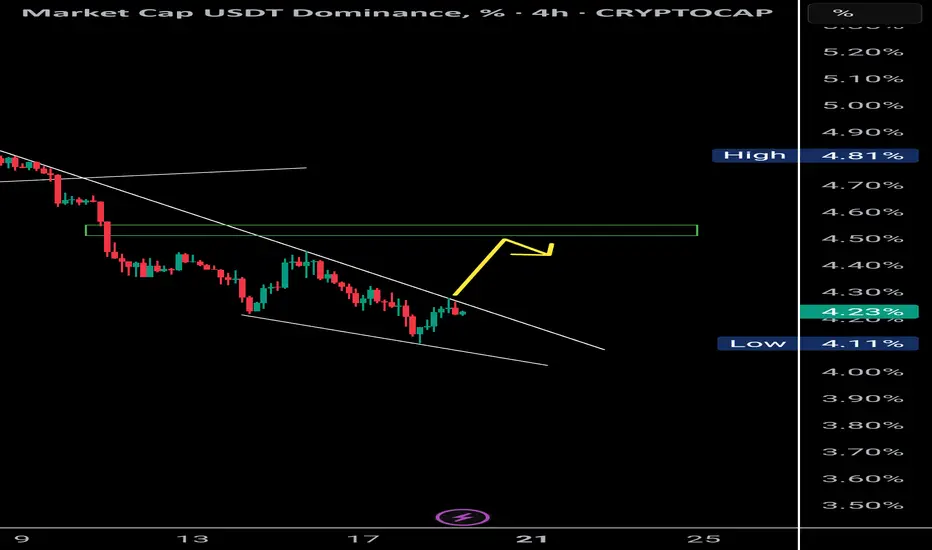
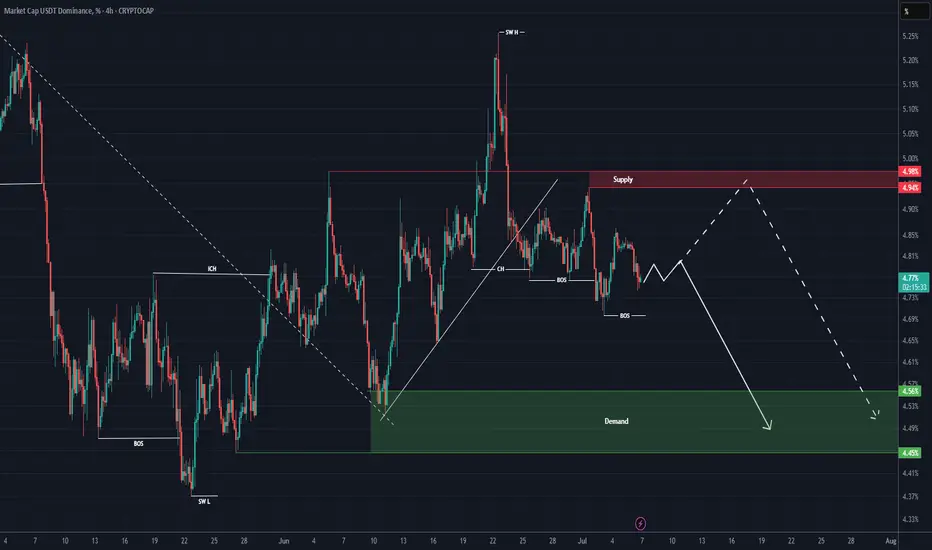
USDT Dominance Forming Bullish Divergence | Altcoins May Retest 📉 USDT Dominance (4H):
Currently forming a bullish divergence with RSI, supported by a falling wedge structure. Price is respecting a clear supply OB (resistance zone) and might retest the 4.55% level.
🔁 Historically, a rise in USDT.D signals short-term corrections in BTC and altcoins, creating opportunities for OB/supply fills and long setups.
📊 This could be the retest phase for major crypto assets before resuming upward momentum.
🧠 Use this phase wisely — it’s where strong setups begin to form.
USDT.D trade ideas
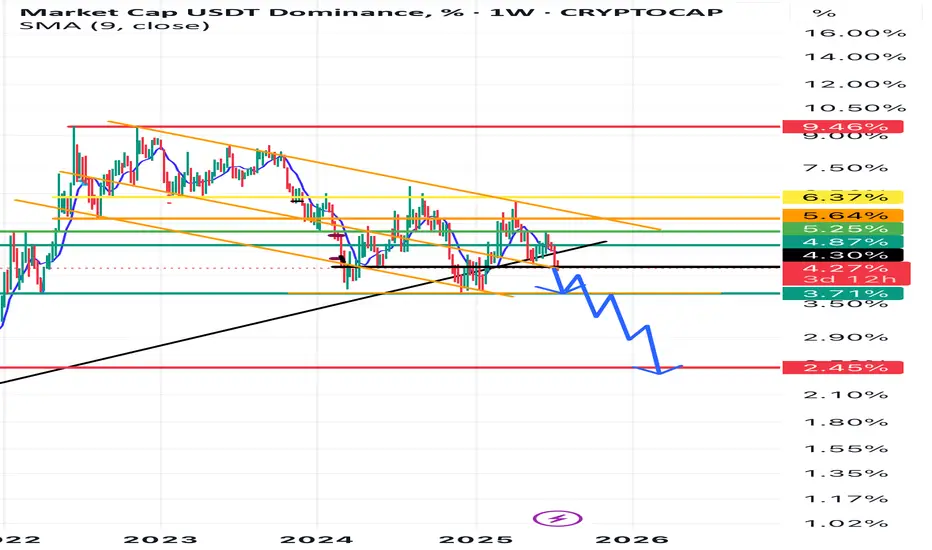
USDT.D — 1W FVG Test & RSI Bull Div | Caution for RiskUSDT Dominance is testing a major 1W FVG support area while developing bullish divergences on the 4H RSI. Although a short-term bounce and market correction are likely, the overall bullish trend in BTC means a sharp reversal is not guaranteed. Risk management is a priority here — no high-risk positions until the RSI resets and market context is clearer.
1W FVG support + 4H RSI bull div
Bounce likely = correction on risk assets
RSI needs reset to 50 before reassessing
If lost — risk-off, possible slice down
Reasoning: Support + momentum, but trend is bullish — not risking gains here


USDT Dominance Looks Really Bearish In Big TimeFrames (3D)Before anything else, pay close attention to the timeframe | it’s a high timeframe and will take time to play out.
From the point where we placed the red arrow on the chart, it seems that the correction of USDT dominance has begun on the higher timeframes.
After wave A completed, the price entered wave B, which formed a symmetrical pattern, followed by an X wave and then a triangle.
Now that the triangle appears to be complete, we seem to be in the bearish wave C of a larger degree.
It is expected that in the coming months, the price will reach the green zone.
Note that this is a high timeframe analysis, and the move will take time, with lots of fluctuations along the way.
For risk management, please don't forget stop loss and capital management
Comment if you have any questions
Thank You

Defining the $BTC top with USDT.DWhy is USDT.D so important in defining a CRYPTOCAP:BTC top?
Because, when BTC is in price discovery, there is no previous price action to determine where we might expect a reaction based on price. Therefore, all we really have are fib extensions and speculation if we solely look at past CRYPTOCAP:BTC price. Fear not, USDT.D gives us previous dominance action to evaluate when the BTC price might react. This is because USDT.D is inversely correlated with CRYPTOCAP:BTC price. Evaluating the correlation of USDT.D and CRYPTOCAP:BTC price, I found that in the current cycle, the correlation is approximately a doubling of BTC price for every -3% drop in USDT.D.
IMPORTANT: Everything below is for speculative fun. I will be watching this play out as part of an overall strategy to define a cycle top, but would never think to use it to make any decision in my life, especially if I should do a destination or hometown wedding or what brand of salve to put on my hemorrhoids.
How can we use the USDT.D/ CRYPTOCAP:BTC correlation to help pick a top? Well, we can find demand zones and calculate how far away we are from them. I don't have previous demand zones on the chart, but they have worked in the past to predict a reaction. The demand zones are somewhat subjective, so you can should verify on your own, but there are a few main zones that I see and have marked in yellow. The top of the demand zones, along with the distance from the current USDT.D in parenthesis, are 3.1% (-1%), 2.8% (-1.5%), 1.8% (-2%), and 1.3% (-2.5%). Using these drops in USDT.D, we might see some intermediate tops around $130K, $150K, and $180K.
The cycle top might be around $196K if we get to the lowest demand zone plotted on the chart. Of course, there are more demand zones below that, but I have a hard time seeing USDT.D go below 1.3%.
I added the price path as an extra bit of intrigue. It will likely not play out as I have it drawn, but why post my ideas if I'm not going to climb out on a limb and see if the prediction plays out. That would be a move of a cowardly douche. And although I am a douche, I'm not a coward.
--Da_Prof

usdt.dHello friends (I haven't been watching the market for a long time because of a series of bad things that happened to me in the last year) Today I was watching the crypto market and I saw that Tether's dominance could move in this direction. I wanted to share with you and this is just my personal opinion. Good luck with the daily timeframe.

USDT DOMINANCE New Update (2H)This analysis is an update of the analysis you see in the "Related publications" section
According to the previous analysis, the price dropped nicely, which helped turn the market green.
Now the structure appears clearer, and we have a zigzag diamond pattern on the chart.
To complete wave F of this pattern, the price might move slightly higher toward the areas marked with yellow circles.
The price still hasn't reached the strong support zone and remains at a distance from it.
Let’s wait and see what happens.
For risk management, please don't forget stop loss and capital management
Comment if you have any questions
Thank You

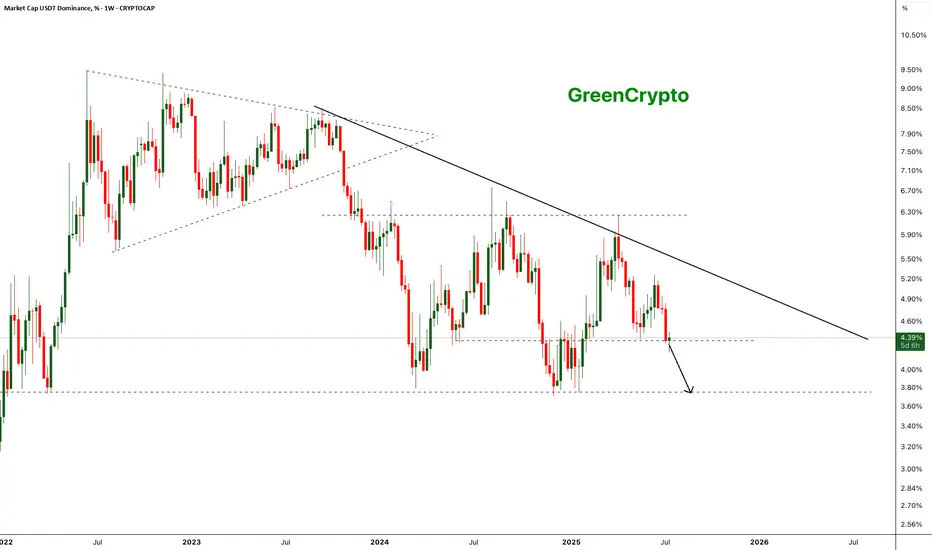
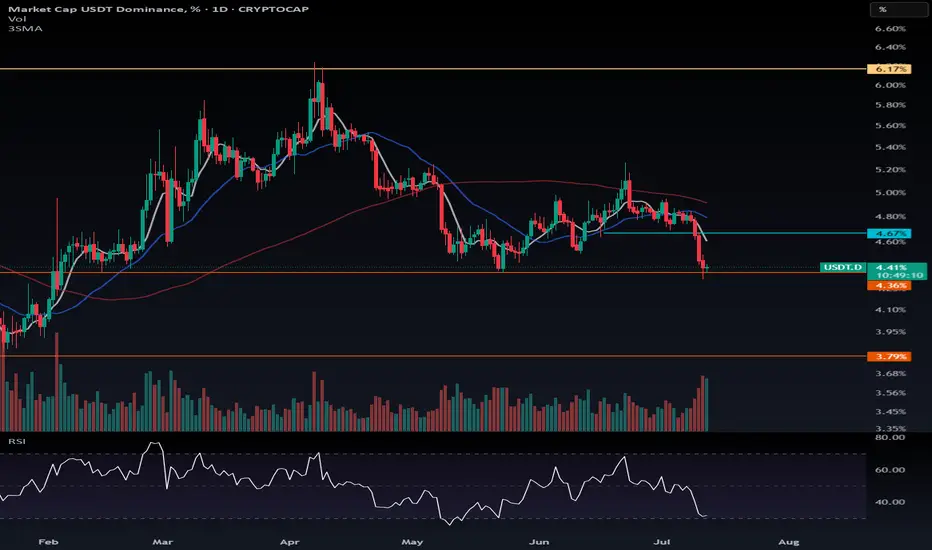
Bearish Breakdown in USDT Dominance - Altseason Loading?The chart shows a clear long-term descending trendline acting as resistance since mid-2023. After multiple failed attempts to break this trendline, USDT dominance has broken below a key horizontal support around ~4.35% on strong bearish momentum.
- Weekly close below the ~4.35% horizontal support.
Next key support zone: ~3.65–3.70% (marked by previous 2023 lows).
- Strong bearish engulfing candle confirming breakdown.
- Bearish continuation expected if dominance remains below 4.35%.
Further drop of the usdt dominance will start the altseason
Cheers
GreenCrypto
USDT Dominance $USDT.D – Channel Breakout in Action!!USDT.D has officially broken out of the descending channel, indicating a potential shift in momentum.
Key Points:
- LTF bullish divergence supported the recent push.
- Price is now testing the breakout level with potential to move higher.
- Next key resistance levels are marked at 4.85%, 5.23%
Both levels align with Fibonacci retracement zones, adding to their importance.
If this move sustains, we might see temporary pressure on alts due to increased USDT strength.
However, if price fails to hold above the channel and confirms a deviation, alts may resume dominance.
Weekly close remains key — it will either validate this breakout or trap the breakout traders.

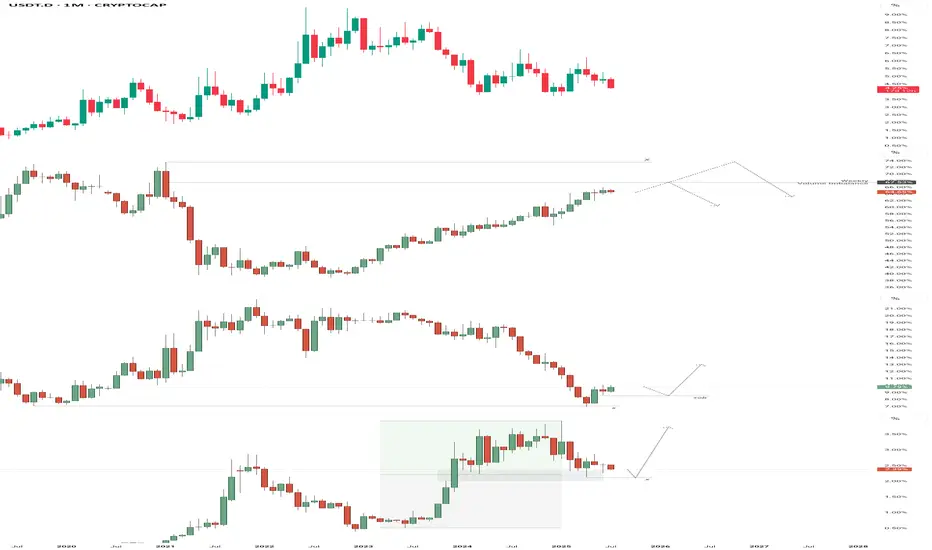
Capital Flow Outlook – BTC Leads, Alts Await a SignalOver the past two quarters, Tether's (USDT) market cap has expanded by over 66%, rising from ~$95B in late 2024 to ~$159.5B by mid-July 2025. This confirms a strong capital injection into the crypto space — reminiscent of early bull market cycles.
But where that capital flows tells the deeper story:
USDT.D is in a clean downtrend, showing that capital is actively rotating out of stables — a risk-on signal.
BTC.D continues climbing, confirming Bitcoin as the primary recipient of inflows. While the current move hasn’t reached exhaustion, the nearest potential reversal point is the weekly volume imbalance at ~67.5%.
Should that level fail to trigger a reaction, the next major reversal zone lies near 73% — the last known macro ceiling for dominance.
ETH.D has shown a structural shift, bouncing from a key macro low with a clear Change in State of Delivery (CSD). A revisit to the April high around 8.55% is looking increasingly likely.
SOL.D is fighting for structure, having reacted to a mid-point imbalance situated in the discount zone. This positioning is favorable for buyers, but structurally it still leans toward sweeping the April low at 2.13% before a valid CSD can form.
---
🧠 Conclusion:
While capital is clearly flowing back into the market, Bitcoin remains the primary destination. Until we see:
A reaction or rejection at BTC.D reversal zones
ETH.D continuing upward toward prior range highs
And SOL.D confirming a structural shift from discount
...a full altseason expansion remains premature.
> The capital is here — but the rotation isn’t.
Altseason is still brewing — and could take the rest of the year to fully materialize.
— Silent Edge
Higher targets for BTC & AltsUSDT dominance is starting to drop, which usually means investors are moving money out of stablecoins and back into Bitcoin and altcoins. This shift often leads to rising prices across the market. If this trend continues, the first key zone to watch for USDT dominance is between 3.57 and 3.76 — a move toward that range could help fuel further growth in BTC and alts. Mini Altseason is already started and it is on its way to higher targets.

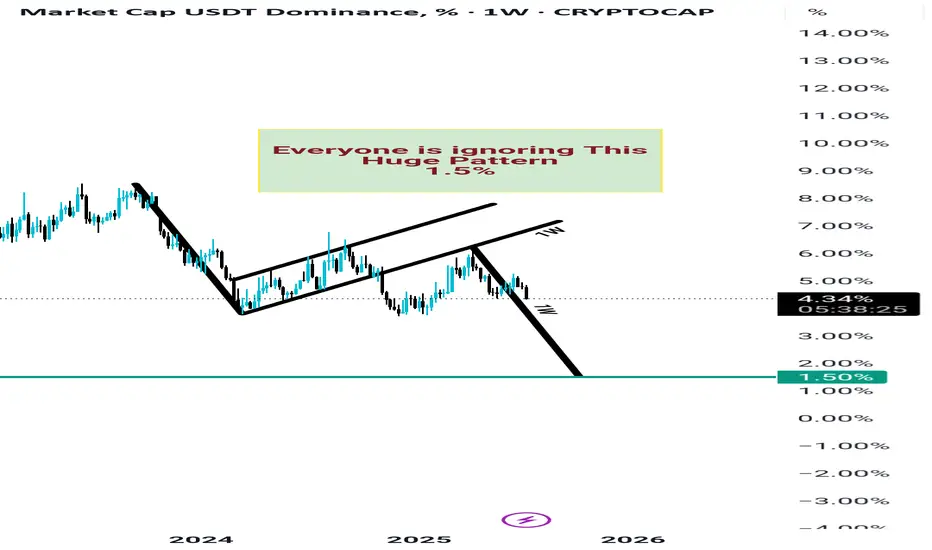
USDT DOMINANCE Huge Crash incoming? Everyone seems to be ignoring the breakdown of the rising wedge on the weekly timeframe of USDT dominance. While many are clinging to small hopes of Bitcoin reaching new highs—some targeting $130K, others $150K—they’re overlooking a major pattern that could flip the entire game.
Just think for a moment: if this pattern plays out and USDT dominance hits its target, it could drop all the way down to 1. 5% to 2%. When that happens, imagine where Bitcoin's price could go. The upside potential is massive.
You can exit at 2% for safe side.
Nothing in trading is ever 100% certain—anything is possible—but this is a scenario that most people are missing. And if it does unfold, it could trigger a supercycle and potentially the biggest blow-off top in Bitcoin’s history.
Keep this possibility in mind. Watch closely. The chances of this playing out are high.
Market Might Go Sideways or Slightly Correct📊 Market Might Go Sideways or Slightly Correct
Since BTC has hit its first target and USDT.D has reached a key support level, I expect the market to range for a while or correct down to around 4.67% on USDT.D.
At this point, USDT.D matters more than BTC.D for me — because BTC dominance hasn’t broken down yet.
So for now, I take confirmation for entries mainly from USDT.D.
Once BTC.D starts dropping, I’ll pay less attention to USDT.D — because that’s when whales start rotating profits from BTC into altcoins. You can see this shift reflected in BTC.D, and at that stage, USDT.D might not show strong moves anymore, since money is flowing within crypto — not out of it.
🛑 Support around 4.36% on USDT.D might get broken sharply.
So don’t forget to place your stop-buy orders after a range or pullback.
⚠️ Don’t get caught in the correction — and avoid shorting against Bitcoin’s trend.
If you’re already in a long, take some profit now.

100% Win Rate on BTC & Alts! Where’s the Next Breakout?USDT Dominance Update:
While the herd chases the latest hype, we called this before it even unfolded. BTC’s recent surge was lightning-fast.
These were the trades shared in the last 30 days. I'm just saying we could've had more wins!
Our setups didn’t just hit targets…
They exploded through them 🚀
These are spot gains, imagine trading wth leverage with these.
There's more to come in the next week.
✅ MIL:ENA +53%
✅ HOSE:VIC +50%
✅ $CHILLGUY +40%
✅ NASDAQ:HUMA +35%
✅ CRYPTOCAP:XRP +34%
✅ $VOXEL +32%
✅ OMXTSE:MAGIC +30%
✅ CRYPTOCAP:RENDER +25%
✅ CRYPTOCAP:AVAX +24%
✅ SEED_DONKEYDAN_MARKET_CAP:FLOKI +25%
✅ CRYPTOCAP:LINK +17.65%
✅ CRYPTOCAP:SUSHI +17.3%
✅ AMEX:MBOX +15%
✅ $MAVIA +14.7%
✅ TVC:MOVE +11.66%
✅ $EPT +11%
✅ BME:ETC +10.3%
✅ PSX:POL +20%
✅ CRYPTOCAP:SUI +20%
✅ LSE:ONDO +7.5%
✅ SET:PORT +6.17%
✅ CRYPTOCAP:TON +3%
📈 These aren’t just simple trades; they’re alpha-backed calls.
If you’re still watching from the sidelines…
You’re watching others print.
Be patient and precise with your entries and exits. Never FOMO.
The market will bait you into bad timing if you let it.
A 4.4% drop in USDT dominance marks the start of a new altcoin season, but remember, BTC will steer this cycle.
More setups on the way.
Stay tuned.
Do hit the like button and share your views in the comments.
Thank you
#PEACE

USDT Dominance Is Still Bearish (1D)This index is still bearish. It could either drop from here or turn bearish again after a pullback to a higher level.
The larger structure is bearish, and the price is breaking through structures in an attempt to reach the main demand zone. This bearish trend is expected to continue.
Let’s wait and see what happens.
For risk management, please don't forget stop loss and capital management
Comment if you have any questions
Thank You

USDT dominance showing a clear path- for more than a year now "price" has been stuck in a giant range (yellow boxes)
- with the latest development (being a breakdown from an ascending broadening wedge) it is likely this "asset" trades back to range lows which should result in overall crypto upside
- if hit, I expect range lows will offer temporary support (implying the crypto market stalls and goes down into a corrective period)
- that said, once/if that USDT. D support breaks, the entire crypto market is going to absolutely explode to the upside and at that point I would expect for Bitcoin to put in its cycle top (likely around October, November period)

$USDT Dominance CRYPTOCAP:USDT dominance just broke down from a key pattern, and that’s a big signal.
It means people are likely moving money out of stablecoins and back into altcoins and Bitcoin.
If this drop continues, we could see a strong altcoin rally soon.
Keep an eye on it, altseason might be around the corner.
DYOR. NFA

USDT DOMINANCE New Update (4H)By analyzing the chart, it becomes clear that the USDT dominance structure is bearish.
After the structural shift to a downtrend, with lower highs and lower lows forming, it is expected that the price will drop to the main support zone in order to collect major orders from lower levels.
The price could drop from the current level or from the upper supply zone, which would signal a bullish move in the overall market.
The target is the green box.
A daily candle closing above the supply zone would invalidate this analysis.
For risk management, please don't forget stop loss and capital management
Comment if you have any questions
Thank You
USDT.D UPDATEThere is such a formation in USDT dominance and it is about to break. Often, to trigger this type of formation, they first do the opposite and then start it. It is worth being careful. Don't be in a heavily loaded coin.

usdt.dHello friends (I haven't been watching the market for a long time because a lot of bad things happened to me in the last year). Today I was watching the crypto market and I saw that Tether's dominance could move in this direction. I wanted to share with you and this is just my personal opinion. Good luck.
